

Abstract
The neurogenic potential of the subgranular zone (SGZ) of the hippocampal dentate gyrus is likely to be regulated by molecular cues arising from its complex heterogeneous cellular environment. Through transcriptome analysis using laser microdissection coupled with DNA microarrays, in combination with analysis of genome-wide in situ hybridization data, we identified 363 genes selectively enriched in adult mouse SGZ. These genes reflect expression in the different constituent cell types, including progenitor and dividing cells, immature granule cells, astrocytes, oligodendrocytes and GABAergic interneurons. Similar transcriptional profiling in the rhesus monkey dentate gyrus across postnatal development identified a highly overlapping set of SGZ-enriched genes, which can be divided based on temporal profiles to reflect maturation of glia versus granule neurons. Furthermore, we identified a neurogenesis-related gene network with decreasing postnatal expression that is highly correlated with the declining number of proliferating cells in dentate gyrus over postnatal development. Many of the genes in this network showed similar postnatal downregulation in mouse, suggesting a conservation of molecular mechanisms underlying developmental and adult neurogenesis in rodents and primates. Conditional deletion of Sox4 and Sox11, encoding two neurogenesis-related transcription factors central in this network, produces a mouse with no hippocampus, confirming the crucial role for these genes in regulating hippocampal neurogenesis.
Keywords: Neurogenesis, Subgranular zone, Transcriptome, Development, Rhesus monkey, Hippocampus
INTRODUCTION
Neurogenesis in the adult brain is restricted to the subgranular zone (SGZ) of the hippocampal dentate gyrus (DG) and the subventricular zone (SVZ) along the walls of the lateral ventricle (Gage et al., 1998; Lois and Alvarez-Buylla, 1993). These microenvironments (i.e. ‘niches’) retain many soluble factors and membrane-bound molecules and much of the extracellular matrix present during brain development, permitting stem cell self-renewal and progenitor differentiation into neurons throughout life (Alvarez-Buylla and Lim, 2004; Riquelme et al., 2008). The stem cells in the adult SGZ and SVZ are likely to be multipotent (Temple, 2001), and these niches utilize many of the signals and morphogens expressed during development, such as Notch, sonic hedgehog (SHH), bone morphogenetic proteins (BMPs) and noggin (Alvarez-Buylla and Lim, 2004). Adult neurogenesis has been observed in many mammals, including mice, rats, rabbits, hamsters, dogs, monkeys and humans (Amrein et al., 2011; Eriksson et al., 1998), and the rate of neurogenesis and the survival of newly generated neurons can be modulated by behavior and external environment (van Praag et al., 1999).
Similar processes have been described in the SGZ and SVZ of mice, including a sequential progression through progenitor types during neurogenesis. In the SGZ, glial fibrillary acidic protein (GFAP)- and nestin-positive radial glia-like (type 1) progenitors (or B cells, which we refer to as ‘radial astrocytes’ throughout this paper) slowly divide to give rise to proliferating stem cells [type 2 intermediate progenitor cells (IPCs)] (Fukuda et al., 2003; Seri et al., 2001). Type 2 IPCs form tight clusters around the processes of type 1 cells, where they rapidly divide to produce neuronal progenitors (type 3 IPCs). Regulated by neurogenic stimuli, type 3 IPCs generate immature neurons, which develop predominantly into mature granule cells. These different cell types can be classified on the basis of their molecular profiles, which have been the focus of intense study. For example, nestin marks stem cells (Lendahl et al., 1990) and is expressed in both type 1 (GFAP+) and type 2 (GFAP-) progenitor cells in the SGZ (Ming and Song, 2011). Ki-67 (also known as MKI67) specifically labels proliferating cells over the whole cell cycle from G1 to M phases (Jabès et al., 2010). CD24 marks differentiating post-mitotic neurons (Calaora et al., 1996), whereas doublecortin (Dcx) (Brown et al., 2003) and Sox11 (Mu et al., 2012) show high expression in proliferating progenitor cells and newly generated neuroblasts but have sharply decreased expression as neurons mature. Progenitor populations of the SGZ and SVZ also have extensive contact with the environment, including other cell types of the neurogenic niche (Alvarez-Buylla and Lim, 2004; Beckervordersandforth et al., 2010; Ming and Song, 2011; Riquelme et al., 2008). A more complete characterization of the entire neurogenic niche will help characterize this complex cellular milieu and identify molecular cues likely to play crucial roles in adult neurogenesis.
The discrete spatial location of the SGZ allows its direct isolation for profiling using laser microdissection (LMD) in combination with microarrays (Bernard et al., 2012; Gurok et al., 2007). Here, we systematically characterize the molecular makeup of the SGZ in adult mouse and postnatal developing rhesus monkey using this strategy in combination with publicly accessible in situ hybridization (ISH) data resources in mouse (Lein et al., 2007) and rhesus monkey (http://www.blueprintnhpatlas.org/). Together, these data allowed an extensive characterization of the SGZ niche, a comparison between species across postnatal development, and the identification of a conserved set of genes correlated with postnatal granule cell neurogenesis, two of which we confirm as functionally essential for hippocampal neurogenesis (SOX4 and SOX11).
RESULTS
Mouse SGZ displays a highly distinct molecular profile representing its diverse cellular makeup
The SGZ contains many cell types, including endothelial cells, quiescent radial stem cells, proliferating stem cells, neural progenitors, immature neurons, mature granule neurons, inhibitory interneurons, astrocytes and oligodendrocytes (Fig. 1A,B), which together provide an environment permissive for neurogenesis into adulthood (Altman and Das, 1965; Ming and Song, 2005; Zhao et al., 2008). To characterize directly the molecular environment of the SGZ, we used laser capture microdissection (LCM) to capture the inner granule cell layer (GCL) (which contains the SGZ) and compare it with the outer GCL of the DG in nine adult C57BL/6 mice. Specifically, for the SGZ we isolated a two- to three-cell-thick band of cells at the base of the GCL that deliberately avoided the hilus of the DG and the specialized cells that make up that region such as mossy cells; similarly, for the GCL sample we isolated a two- to three-cell-thick band of cells near the outer boundary of the GCL (supplementary material Fig. S1). For this manuscript, we refer to the inner GCL as the SGZ, although the actual isolation contains both the SGZ and immediately overlying granule cells. RNA was isolated from these samples and amplified for analysis on Affymetrix MG-U74Av2 microarrays.
Fig. 1.

Identification of neurogenic niche genes in the adult mouse SGZ. (A) Thionin-stained cryosection of mouse DG showing the subgranular zone (SGZ), located at the base of the granule cell layer (GCL) and adjacent to but separate from the hilus. (B) Schematic representation of the many different known cell types in the SGZ. Also shown are excitatory mossy cells in the hilus and mature granule cells. Corresponding labels share the same color as the cell type. The schematic was derived from labeled cells shown in previously published studies (Amaral, 1978; Claiborne et al., 1986; Jessberger et al., 2008; Kosaka and Hama, 1986; Lawrence and McBain, 2003; Palmer et al., 2000; Seki and Arai, 1999). (C-E) SGZ enrichment for Dcx and Sox11 corroborated by ISH (C,D) and microarrays (E). Dcx and Sox11 ISH also show enrichment in the wall of the lateral ventricle (LV) and rostral migratory stream (RMS). Insets in C,D show high magnification views of the boxed areas. In E, box and whiskers represent 25/75% and 5/95% quantiles, respectively. (F) Highly significant agreement was seen between SGZ-enriched genes found using ISH and microarrays (P<10-35). y-axis is the density distribution (scaled average count) across paired t-test statistics for regional differential expression between SGZ and GCL (x-axis). Genes confirmed by ISH (red) show a significant skew towards SGZ enrichment relative to those not found in the SGZ using ISH (black). Vertical red and black lines show the mean of each distribution. Scale bars: 100 μm (A); 500 μm (C,D).
To identify a high confidence set of genes showing enrichment in the SGZ, we first analyzed these microarray data to identify candidate genes using paired t-tests, which we used as the starting point for an extensive screen of the Allen Mouse Brain Atlas (Lein et al., 2007). For example, as shown in Fig. 1C-E, microarrays predicted SGZ enrichment for doublecortin (Dcx) and the transcription factor Sox11, and these genes showed clear enrichment in the SGZ by ISH as expected [Dcx, P=0.00035 (Brown et al., 2003); Sox11, P=0.0054 (Mu et al., 2012)]. Furthermore, both of these genes were enriched in the lateral wall of the lateral ventricle and the rostral migratory stream (RMS), indicating a selective enrichment in neurogenic regions of the mouse brain. Additional SGZ-enriched genes were identified through curation during atlas production (Lein et al., 2007), using informatics-based data mining tools on the atlas website (Ng et al., 2009), and through confirmation of cell type-enriched genes from the literature (Bracko et al., 2012; Cahoy et al., 2008; Sugino et al., 2006). Altogether, we identified a nearly complete list of 363 genes with obvious cellular enrichment by ISH in the SGZ (supplementary material Table S1), and showing high concordance with microarray data (P<10-35; Fig. 1F; note the rightward shift of the red curve).
This list was significantly over-represented for development-related GO Biological Process categories expected for a neurogenic zone, including ‘neurogenesis’, ‘organogenesis’ and ‘morphogenesis’ (Table 1). Furthermore, these genes displayed a remarkable diversity of cellular expression patterns in the hippocampus (supplementary material Fig. S3) and throughout the brain, reflecting the highly heterogeneous nature of the SGZ neurogenic niche. We assigned cell type labels to those genes for which we could make high confidence calls based on overall cellular distribution patterns and available information in the literature, including markers for isolated neural stem cells (NSCs) and immature neurons (Bracko et al., 2012) (supplementary material Table S1). Not all genes could be assigned to a particular cell class, and a great diversity of cellular patterns is seen within most cell classes. Furthermore, many genes appear to be expressed in multiple cell types. Nevertheless, many genes displayed highly specific patterns representing restricted expression in different SGZ cell types, as shown in Figs 2 and 3.
Table 1.
Enriched categories in the high-confidence list of 363 mouse SGZ genes
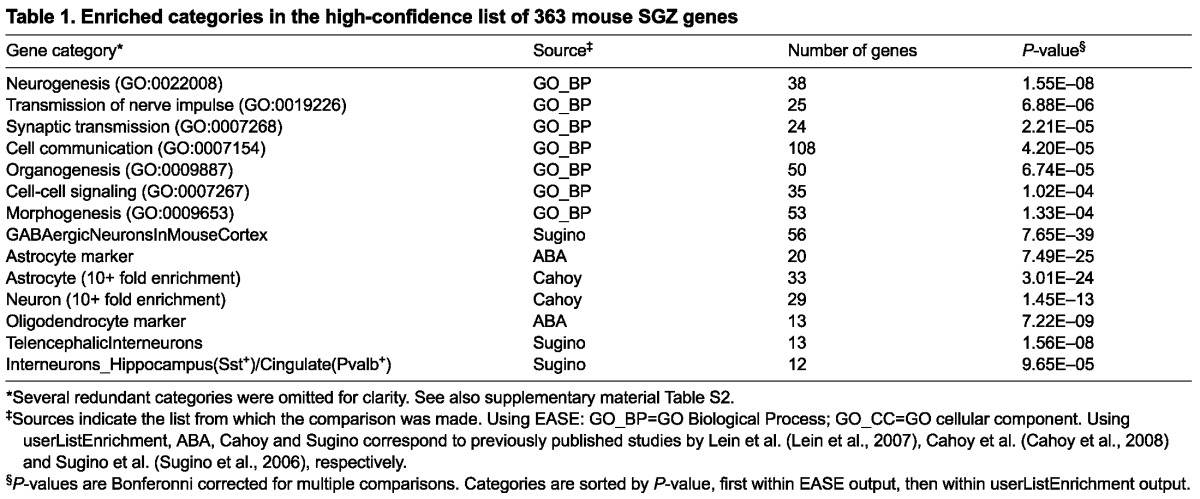
Fig. 2.

Genes labeling interneurons, oligodendrocytes and vascular cells in the adult SGZ. (A-C) ISH demonstrating enriched cellular expression in the SGZ compared with the overlying GCL selectively in GABAergic interneurons (A), oligodendrocytes (B) and vascular cells (C) in coronal (A,C) or sagittal (B) sections through the P56 mouse hippocampus. Inset panels show high magnification views of the GCL and SGZ corresponding to boxed regions in low magnification images. High magnification images are oriented with SGZ positioned below the GCL regardless of which blade of the dentate gyrus is represented. Scale bar: 500 μm.
Fig. 3.

Known and predicted gene markers for neurogenesis-related cell types found in the adult SGZ. (A-C) ISH demonstrating enriched cellular expression in the SGZ compared with the overlying GCL in coronal or sagittal sections through the P56 mouse hippocampus. Genes enriched in astrocytes (A) and dividing cells (B) are shown, along with other genes with diverse hippocampal expression patterns and striking SGZ enrichment (C). Inset panels show high magnification views of the GCL and SGZ corresponding to boxed regions in low magnification images. High magnification images are oriented with SGZ positioned below the GCL regardless of which blade of the dentate gyrus is represented. Scale bar: 500 μm.
Many SGZ-enriched genes are expressed in inhibitory GABAergic interneurons (Fig. 2A). For example, glutamic acid decarboxylase 2 (Gad2) is expressed in all GABAergic neurons and labels a dense band of large cells along the SGZ. Other known hippocampal and cortical interneuron-enriched genes label sparser populations of putative interneurons in the SGZ, including v-erb-a erythroblastic leukemia viral oncogene homolog 4 (Erbb4), parvalbumin (Pvalb), cannabinoid receptor 1 (Cnr1), prepronociceptin (Pnoc), tyrosine-protein kinase (Kit), tachykinin 2 (Tac2) and serotonin receptor 3A (Htr3a). The great majority of cortical interneuron-enriched genes identified in the Allen Mouse Brain Atlas (Lein et al., 2007) are expressed in the SGZ (our unpublished results), indicating a diverse GABAergic neuron population therein. These interneurons may play an important role in adult granule cell neurogenesis and maturation, as newly generated granule cells initially only receive GABAergic input from local interneurons (Overstreet Wadiche et al., 2005).
Other SGZ-enriched genes were expressed in oligodendrocytes or cells associated with vasculature. Well-known oligodendrocyte genes, including myelin basic protein (Mbp), myelin oligodendrocyte glycoprotein (Mog), gelsolin (Gsn) and crystallin alpha B (Cryab), showed labeling primarily in the alveus and other hippocampal white matter tracts, but also showed scattered labeling in the SGZ (Fig. 2B). As dentate granule cell mossy fibers are unmyelinated, presumably these cells myelinate fibers from local hilar mossy cells and SGZ interneurons. Genes enriched in vascular endothelial cells, e.g. phospholipid transfer protein (Pltp) and claudin 5 (Cldn5), showed mild SGZ enrichment, as did hemoglobin synthase genes (Hbb-b1, Hbb-b2), presumably expressed in red blood cells in local vasculature (Fig. 2C). Dividing cells in the adult SGZ cluster around vasculature, and in many cases are also immunoreactive for endothelial markers, implicating the SGZ as both a neurogenic and angiogenic niche (Palmer et al., 2000).
Most well-known astrocyte markers are expressed in a dense, relatively uniformly spaced band of cells in the SGZ (Fig. 3A), similar to the ‘picket fence’ astrocyte pattern described for star-shaped astrocytes (Distler et al., 1991). For example, aldolase C (AldoC), cystatin C (Cst3), phosphatidic acid phosphatase 2B (Ppap2b) and platelet-activating factor acetylhydrolase (Pla2g7) all show a similar ‘pan-astrocyte’ pattern in the entire hippocampus (Fig. 3A). By contrast, the canonical astrocyte marker glial fibrillary acidic protein (Gfap) showed a much more restrictive pattern, but with a dense band in the SGZ, which probably reflects its known expression in radial astrocytes therein (Fukuda et al., 2003; Seri et al., 2001).
Several genes related to cell division showed highly specific and robust expression in zones of adult neurogenesis. Mki67, an S phase-expressed gene commonly used as a marker of dividing cells (Jabès et al., 2010), labeled sparse cells in the SGZ and larger numbers in the lateral wall of the lateral ventricle/RMS (Fig. 3B). Likewise, several other genes associated with cell cycle progression, e.g. protein regulator of cytokinesis 1 (Prc1) and cell division cycle associated 3 (Cdca3), or with DNA structure associated with replication during cell division, e.g. DNA topoisomerase 2 alpha (Top2a) and histone 3, H2a (Hist3h2a), were enriched in these same neurogenic regions.
Finally, many genes had highly enriched, dense cellular labeling along the SGZ (and in many cases the wall of the lateral ventricle) that we could not easily assign to a specific cell type (Fig. 3C). Several such genes have previously been associated with adult neurogenesis and are likely to label salient cells associated with neurogenic processes, including specialized astrocyte/progenitor populations, e.g. radial cells [Fabp7 (Matsumata et al., 2012)], late stage neural progenitors, and immature granule neurons [Calb2 (Brandt et al., 2003), Neurod1 (Gao et al., 2009; Roybon et al., 2009), Stmn2 (Camoletto et al., 2001)].
Genome-wide transcriptional analysis of the rhesus monkey SGZ shows striking similarities with mouse
We next sought to measure the extent to which the transcriptional machinery of the neurogenic niche is preserved between mouse and rhesus monkey. As part of the NIH Blueprint Non-Human Primate (NHP) Atlas (http://www.blueprintnhpatlas.org), we performed LMD and microarray analysis on brains (including hippocampi) from newborn, infant, juvenile and young adult monkeys (T=0, 3, 12 and 48 postnatal months, respectively), with n=3 at each time point. Similar to mouse, the SGZ and GCL isolations targeted the inner and outer portions of the granule cell thickness while avoiding the underlying polymorphic layer (PO), which was isolated as a separate sample (Fig. 4A,B; supplementary material Fig. S4). In contrast to mouse, which shows fairly extensive adult SGZ neurogenesis (Amrein et al., 2011), most granule cell neurogenesis in rhesus monkey occurs early in postnatal development (Jabès et al., 2010). Over the first three months, there are dramatic changes in the cellular makeup and appearance of the DG (Fig. 4B): at birth, there is a dense Nissl-stained band at the base of the GCL (for consistency called the SGZ here), which becomes less obvious by 3 months and barely visible by 12 months. Cell division occurs in the underlying PO, notable for the high density of small cells that rapidly disappear with age.
Fig. 4.

Genome-wide analysis of macaque SGZ-enriched genes across postnatal development. (A) Nissl-stained coronal sections of rhesus monkey DG at 0, 3, 12 and 48 months. (B) High magnification images of the DG corresponding to boxed regions in A, showing developmental changes in the appearance and cellular makeup of the DG. MO, molecular layer; GCL, granule cell layer; SGZ, subgranular zone; PO, polymorphic layer. (C) Multidimensional scaling (MDS) plot of the top 388 ANOVA genes (P<10-8). Dots are samples, and text is mean value in group (green G, GCL; red S, SGZ; blue P, polymorphic layer). Percentages indicate the variance explained by the first (x-axis; cell layer) and second (y-axis; age) principal components. (D) Genes marking proliferating cells (MKI67), immature neurons (DCX), astrocytes (GFAP) and interneurons (SLC32A1) show expected spatiotemporal expression patterns across time. Each dot represents the mean expression level of that gene at the labeled age point. Scale bars: 500 μm.
Transcriptional changes mirror anatomical changes, as shown by principal component analysis (PCA; Fig. 4C; Materials and methods). For example, the SGZ and GCL become increasingly less distinguishable with age, reflecting the increasing proportion of mature granule cells in samples taken from the inner GCL. The spatiotemporal expression patterns of known marker genes for proliferating cells (MKI67), late-stage progenitor/immature neurons (DCX), astrocytes (GFAP) and GABAergic interneurons (SLC32A1) also show expected patterns (Fig. 4D). For example, the proliferating cell marker MKI67 is expressed primarily in the PO, where it is high at 0 months and decreases to a stable low by 12 months. The late-stage progenitor/immature neuron marker DCX is expressed most highly at birth, is highest in the SGZ, and decreases with age. By contrast, the astrocyte marker GFAP is highest in the PO, is low at 0 months, and increases with age. Finally, the vesicular GABA transporter SLC32A1 is highest in the PO and SGZ, consistent with the anatomical distribution of GABAergic interneurons, and is stable over time. Thus, the developmental axis provides significant advantages to identifying molecular signatures of postnatal neurogenesis.
To find a general set of SGZ-enriched genes in macaque, we compared GCL with SGZ samples in all 12 monkeys using a paired t-test, which takes into consideration the brain of origin for each sample when identifying laminar genes. This strategy improved our statistical power and allowed us to compare our results directly with mouse. Overall, 1068 genes showed a general enrichment in SGZ relative to GCL (P<0.01, Benjamini-Hochberg corrected). As with mouse, these genes were enriched for ‘neurogenesis’ and other development-related GO Biological Process categories, as well as for astrocyte, oligodendrocyte and interneuron marker genes (Table 2). Furthermore, many of the 363 high-confidence SGZ genes identified in mouse were also enriched in macaque SGZ (Fig. 5A; P<10-41; supplementary material Table S3). Many of the mouse genes presented in Figs 2 and 3 also have higher expression in the macaque SGZ than in the GCL, including markers for interneurons (GAD2, PVALB), astrocytes (ALDOC, PPAP2B) and immature neurons (DCX, SOX11) (Fig. 5B), suggesting that the basic cellular and molecular characteristics of the SGZ niche are well conserved in mouse and monkey.
Table 2.
Enriched categories in macaque SGZ genes
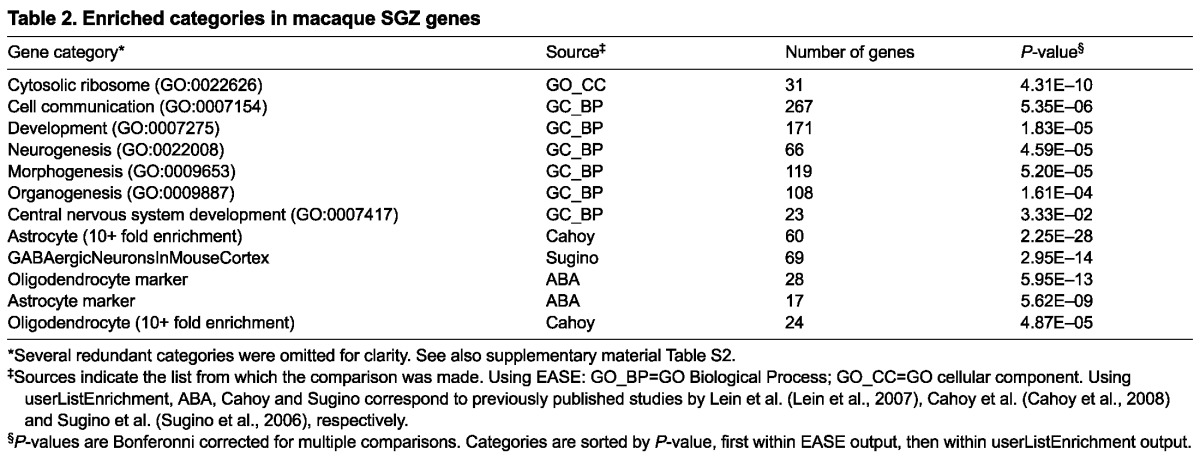
Fig. 5.
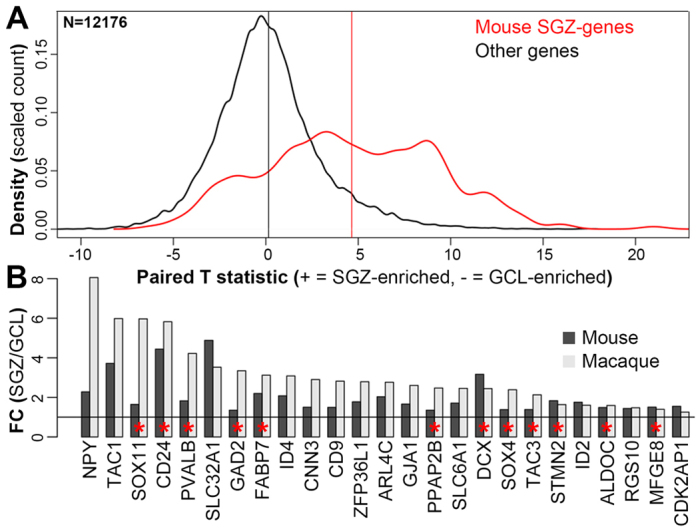
Good agreement between mouse and macaque markers for SGZ. (A) Highly significant agreement between rhesus monkey microarray data and the SGZ-enriched genes in mouse. Genes confirmed as SGZ-enriched by ISH in mouse (red) show a significant skew towards SGZ enrichment relative to those not found in the SGZ using ISH (black). Labeling as in Fig. 1F. (B) Many top macaque markers (t>6 in A; P<0.0001) also show significant enrichment in mouse microarray (P<0.01) and ISH. Fold changes (FC) of mean SGZ versus mean GCL expression for 25 select genes in macaque (light gray) and mouse (dark gray) microarrays are shown. Genes with red asterisks are shown by ISH in mouse in Figs 1, 2, 3, and the remaining genes are shown in supplementary material Fig. S3.
Network analysis identifies SGZ-enriched gene clusters with distinct temporal patterns
A major advantage of the rhesus monkey developmental series is that it allows concurrent analysis of gene regulation across structure and age. To do this, we used weighted gene co-expression network analysis (WGCNA), which groups genes into modules that have strongly co-varying patterns across the data set in an unbiased manner (Zhang and Horvath, 2005) and has previously been used to identify genes co-expressed in specific cell types (Oldham et al., 2008), regions (Hawrylycz et al., 2012) and disease networks (Horvath et al., 2006) in brain. Here, we identified 18 modules mostly corresponding to genes with different spatiotemporal profiles in the developing macaque DG (Fig. 6A,B; supplementary material Table S4). Of particular interest are four modules containing genes highly enriched in the SGZ relative to the GCL (Fig. 6B, third row; modules marked with asterisks), which contain many of the same SGZ marker genes identified in mouse (Fig. 6B, second row; P<10-11 for each module), suggesting that these clusters of genes represent common features of SGZ between species. These modules each show decreasing expression from 3 to 48 months, but have distinct temporal profiles during early postnatal development (Fig. 6B, bottom two traces; Fig. 6C). Genes in the tan module show decreased expression from T=0 to T=3, genes in the cyan module show increased expression, and genes in the green-yellow and midnight-blue modules are relatively unchanged.
Fig. 6.

Network analysis distinguishes subclasses of SGZ-enriched genes based on developmental expression profiles. (A) WGCNA cluster dendrogram groups genes into distinct modules. The y-axis corresponds to distance determined by the extent of topological overlap (1-TO). Dynamic tree cutting identified highly parsimonious modules, generally dividing them at significant branch points in the dendrogram. (B) Top color band: Genes in the 18 modules are color-coded. Genes not assigned to a module are labeled gray. Second color band: Genes in mouse SGZ based on ISH are labeled black, and are enriched in the cyan, green-yellow, midnight-blue and tan modules (*P<10-11). Third color band: Plotted t-values of SGZ versus GCL samples, collapsed across all ages. Red corresponds to SGZ-enriched and green to GCL-enriched. Fourth and fifth color bands: Plotted t-values of 0-month versus 3-month, and 3-month versus 48-month samples in SGZ, respectively. Red corresponds to increased and green to decreased expression with age. (C) Module eigengene (ME) expression for the four modules showing SGZ enrichment. y-axes show ME expression (in arbitrary units). Bars represent individual samples (ordered ascending by age). Modules are labeled using selected category enrichments (see supplementary material Table S5 for complete enrichments).
To characterize these modules, we performed enrichment analyses as described above, also including markers for interneurons from supplementary material Table S1 (see supplementary material Table S5). The tan module shows enrichment for genes related to neurogenesis, DNA binding, and development, and is likely to include a core set of cross-species neurogenesis markers (discussed below). By contrast, the cyan module shows enrichment for markers of several glial cell types, probably reflecting the increasing rate of gliogenesis in postnatal rhesus monkey with age, relative to neurogenesis (Eckenhoff and Rakic, 1988). The green-yellow module is also highly enriched for astrocyte markers, but not oligodendrocytes, and has the highest overlap with mouse (P<10-32). Both this and the midnight-blue module contain genes expressed in cortical radial glia, which are also likely to be expressed in SGZ radial astrocytes. For example, the green-yellow module contains HES5 (Basak and Taylor, 2007) and METRN (Nishino et al., 2004), whereas the midnight-blue module contains FABP7 (Feng et al., 1994) and NOTCH2 (Tanaka et al., 1999). Interestingly, GABAergic interneuron markers were not enriched in any module, and were under-represented in the tan and cyan modules (P<0.05). Finally, the green-yellow and tan modules are enriched for genes highly expressed in GFAP+/PROM1- SVZ astrocytes (P<10-7) and GFAP+/PROM1+ SVZ adult NSCs (P<10-10), respectively (Beckervordersandforth et al., 2010), confirming some level of consistency in cell type marker genes between SGZ and SVZ.
Module containing SOX4 and SOX11 is associated with hippocampal neurogenesis
To identify genes directly corresponding to postnatal granule cell neurogenesis, we correlated module eigengene expression in SGZ, GCL and PO with counts of Ki-67+ dividing cells in age-matched rhesus monkey DG (Jabès et al., 2010). Remarkably, the tan module showed nearly perfect correlation in the SGZ (Fig. 7A; R=0.99, P=7.7×10⁻¹⁰). This module is also associated with neurogenesis based on GO enrichment (Fig. 6C) and contains many such genes identified by ISH expression in mouse (including CD24, DCX, FABP5, SEMA3C, SOX4, SOX11, STMN2 and TNC from Figs 1 and 3), suggesting that expression of these genes is closely related to cell proliferation. To prioritize module genes based on their position in the network, we depicted the strongest connections using the program VisANT (Fig. 7B) (Hu et al., 2004). The transcription factor genes SOX11 and SOX4 had the most representative expression patterns of this module (as indicated by the large number of connections with other genes in this network depiction), consistent with the finding that these genes are both expressed around the time of neuronal commitment in adult mouse hippocampus and are required for neuronal differentiation therein (Mu et al., 2012).
Fig. 7.
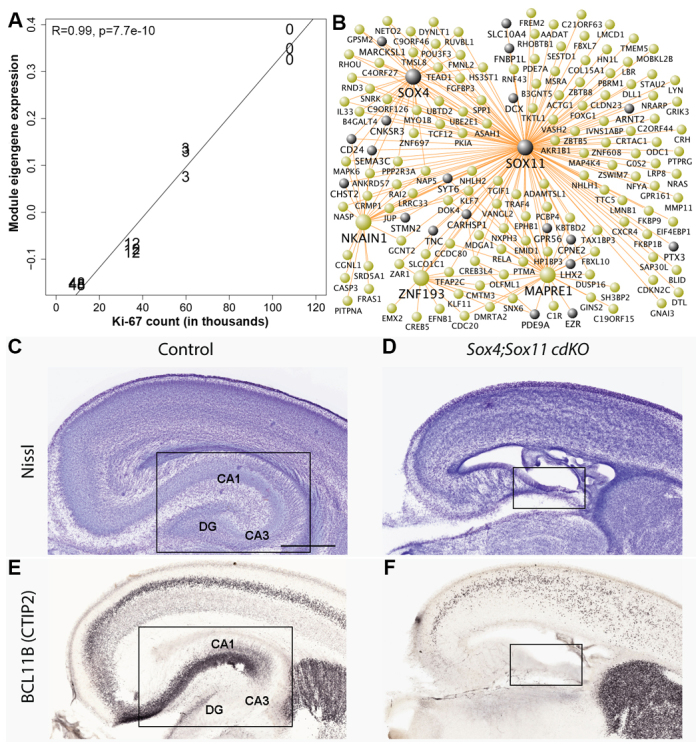
Gene network experimentally confirmed as neurogenesis-related. (A) Tan module expression in SGZ correlates strongly with the number of proliferating cells across postnatal development (R=0.99, P=7.7×10⁻¹⁰). Each point represents an SGZ sample for which age is labeled in months (0, 3, 12 and 48). y-axis shows module eigengene expression (in arbitrary units). x-axis shows the average number of proliferating cells in the DG of age-matched macaque monkeys from Jabès et al. (Jabès et al., 2010). The 48-month count was estimated using reported counts for earlier and later ages. (B) Network depiction of this module allows visualization of intramodular connections and hub (central) genes. Gray nodes indicate genes that are included in the mouse SGZ list. Large nodes are hub genes with 15+ of the 250 total connections. Node locations were chosen to highlight network structure and allow visibility of all gene names. (C) Nissl stain of sagittal section through control mouse at P0 showing normal hippocampal development. (D) Nissl stain of plane-matched section in a Sox4;Sox11 cdKO mouse shows severe anatomical malformations, including an undeveloped hippocampus. (E,F) Adjacent sections of control (E) and cdKO (F) mice stained for BCL11B (CTIP2) IHC. BCL11B expression is disrupted in cortex and missing in the hippocampal region of cdKO mice. Box indicates location of hippocampus. Scale bar: 1 mm.
To assess the phenotypic effects in hippocampus of inactivating these genes, we selectively inactivated Sox4 and Sox11 in neural progenitors of the cerebral cortex, including the hippocampus, by crossing floxed Sox4 and Sox11 mice with the Emx1-Cre transgenic line (Shim et al., 2012). Based on our network results and on previous findings from other labs (Mu et al., 2012), we would predict that knocking out these hub genes would significantly affect development of DG granule cells. Although we observed no obvious gross defects in the hippocampus of either single knockout mouse at postnatal day (P) 0 (data not shown), probably owing to redundancy in function (Cheung et al., 2000; Shim et al., 2012; Sock et al., 2004), conditional double knockout (cdKO) mice for Sox4 and for Sox11 (Sox4fl/fl;Sox11fl/fl;Emx1-Cre) showed major cortical defects and a severely stunted or missing hippocampus (Fig. 7C,D). To characterize this phenotype further, we stained brain sections with BCL11B (also known as CTIP2), a protein marking middle to deep cerebral cortex layers and neurons in CA1, CA2 and the DG (Leid et al., 2004). Control mice showed the expected staining (Fig. 7E), whereas Sox4;Sox11 cdKO mice show disruption of cortical lamination and a striking lack of staining near the expected hippocampal location (Fig. 7F). Together, these results confirm the role of SOX4 and SOX11 as crucial neurogenic genes in hippocampus, and suggest a role for several other genes in developmental and adult neurogenesis in the SGZ.
Spatiotemporal expression patterns of rhesus monkey neurogenesis-related genes are conserved in mouse
To examine whether the spatiotemporal regulation of neurogenesis-associated (tan) module genes is conserved between monkey and mouse, we examined the developmental patterns of several such genes using data available in the NIH Blueprint NHP Atlas and the Allen Developing Mouse Brain Atlas (http://www.brain-map.org) using ISH. The spatiotemporal patterns of Dcx and Sema3c predicted by the microarray analysis were confirmed at cellular resolution (Fig. 8A). A dense band occupying roughly the inner half of the GCL is strongly labeled at 0 months, narrows at 3 months, and is reduced to scattered and sparse labeled cells in the SGZ by 12 and 48 months, respectively, paralleling the developmental decrease in adult neurogenesis over this time. Dcx and Sema3c also show striking, common developmental regulation in mice, as do several other tan module genes (Sox11, Sox4, Cd24a, Tnc; Fig. 8B), transitioning from diffuse labeling in the DG at embryonic day (E) 18.5 and P4 to robust dense labeling in the inner GCL by P14. The thickness and labeling intensity decrease from P14 to P56, in a similar temporal progression as that observed from 0 to 12 months in rhesus monkey (Fig. 8C), although the decrease by P56 in mouse is less pronounced than in monkey by 48 months. These data suggest that core molecular machinery associated with postnatal granule cell neurogenesis is highly conserved between mice and monkeys and that the timing of this process is delayed relative to birth in mice, as expected given the protracted fetal development in monkeys.
Fig. 8.

Consistent spatiotemporal expression patterns in mouse and macaque SGZ. (A) ISH for DCX and SEMA3C in coronal sections of rhesus monkey show SGZ enrichment and decreasing expression level with increasing age, consistent with microarray data. (B) Tan module genes show consistent spatiotemporal patterning in mouse SGZ. Top row: Nissl sections of sagittally sectioned mouse DG at E18.5, P4, P14, P28 and P56. Remaining rows: Expression patterns of Dcx, Sema3c, Sox11, Sox4, Cd24a and Tnc. (C) Schematic of DG development in mouse and rhesus monkey, with time points aligned on the basis of gene expression patterns in A and B. Scale bars: 500 μm.
DISCUSSION
The SGZ and SVZ are uniquely permissive for persistent adult neurogenesis in mammals (Ming and Song, 2011; Riquelme et al., 2008). Most studies of the SGZ focus on dividing stem and progenitor cells and their progeny as they differentiate into mature granule neurons. However, the SGZ neurogenic niche is highly complex in its cellular composition, and interactions within this unique cellular milieu are likely to contribute to its permissiveness for neurogenesis. Here, we aimed to profile at a molecular level the entire SGZ in mouse and rhesus monkey using microdissection-aided microarray analysis and transcriptome-wide ISH. We identified 363 genes showing robust cellular enrichment in adult mouse SGZ relative to the overlying GCL, which were largely consistent with monkey, suggesting that the basic cellular environment is conserved. These genes robustly labeled many cell types that have been described in the SGZ, including progenitor cells, immature neurons, GABAergic interneurons, astrocytes, oligodendrocytes, vascular endothelial cells and red blood cells. Furthermore, markers for any particular class displayed heterogeneous cellular patterns. For example, many genes labeled subsets of GABAergic interneurons at different densities, and with numerous overall hippocampal patterns, suggesting a diversity similar to the 21+ interneuron subtypes identified in nearby CA1 (Klausberger and Somogyi, 2008). Finally, many genes showed complex patterns not easily assigned to a single cell class.
At least two astrocyte types co-exist in the SGZ: (1) GFAP+/nestin+ radial astrocytes, which extend radial processes into the GCL and divide to form intermediate progenitors; and (2) S100+/nestin- horizontal astrocytes, the processes of which remain beneath the GCL (Seri et al., 2001). We find many different cellular and spatiotemporal patterns for putative astrocyte markers in the DG, suggesting a high molecular diversity. For example, Aldoc and Cst3 are highly expressed in all ‘star-like’ astrocytes in mouse hippocampus, whereas Gfap shows specific expression in a subset of non-neuronal cells. In monkey, known astrocyte markers (Cahoy et al., 2008) group into at least two distinct clusters of SGZ-enriched genes. One set (cyan module), which includes many markers for mature astrocytes, has peak expression relatively late in postnatal development. A second set (green-yellow module) contains genes expressed in cortical radial glia, and probably also in SGZ radial astrocytes, including HES5, which regulates the timing of NSC differentiation as part of the notch signaling pathways (Hatakeyama et al., 2004), and METRN, which is expressed in radial glia and undifferentiated neural progenitors and promotes axonal extension and glial cell differentiation (Nishino et al., 2004). Altogether, our results suggest a more diverse population of astrocytes in the SGZ than is currently characterized.
Among the SGZ-enriched genes for which cell type distributions are difficult to assess, several have previously been associated with neurogenesis or neuronal differentiation in the SGZ (including some discussed above). As an additional example, knockout of the genes encoding fatty acid binding proteins 5 and 7 (Fabp5/7) produces a dramatic reduction in neural progenitor cells and enhanced neuronal differentiation in the mouse SGZ (Matsumata et al., 2012). Interestingly, a few of these genes have previously been associated with neurogenesis in the SVZ, but not thus far in the SGZ. For example, overexpression of diazepam binding inhibitor (Dbi) during the peak of olfactory bulb neuron generation increases cell proliferation by inhibiting GABA-induced currents and preventing progenitors from exiting the cell cycle (Alfonso et al., 2012). Likewise, both stathmin (Stmn1) and SCG10 (Stmn2) may have a role in neurogenesis (Camoletto et al., 2001). Thus, many neurogenic genes may be common to the SVZ and SGZ, although some genes enriched in the SVZ were not expressed in hippocampus (data not shown). Further characterization of genes commonly and specifically expressed in these niches offers an important area of future research.
Adult neurogenesis occurs in the SGZ of nearly all mammalian species studied, although the rates of new neuron generation and functional integration in the hippocampus vary considerably between species (Amrein et al., 2011). Our results strongly suggest that adult neurogenesis represents the persistence of a conserved developmental program that comes to an end in other brain regions (Ming and Song, 2011), rather than a novel developmental process. Several neurogenesis-related markers have been shown to colocalize with DCX across the human lifespan, and show decreased labeling with age, suggesting a similar course of adult SGZ neurogenesis as in mouse (Knoth et al., 2010). Likewise, we found that many genes are commonly enriched in the SGZ of both mouse and rhesus monkey (Fig. 5A; P<10-41), including several that show a progressive decrease in expression with time in both species (Dcx, Sox4, Sox11, Sema3c, Cd24a, Tnc; Fig. 8) and that are part of a neurogenesis-related gene network (Figs 6, 7). Interestingly, Sox4 and Sox11, which are important regulators of a wide range of processes during embryogenesis and adulthood (Cheung et al., 2000; Mu et al., 2012; Sock et al., 2004) and are known to regulate Dcx (Mu et al., 2012) and Sema3c (Liao et al., 2008) expression, were central (hub) genes in this network. Selective knockout of Sox4 and Sox11 in the dentate gyrus of adult mice has shown that these genes are essential for differentiation of NSC progeny in the SGZ (Mu et al., 2012). Similarly, we find that Sox4 and Sox11 are crucial for proper hippocampal development, as cortex-specific cdKO mice entirely lack a hippocampus (Fig. 7C-F). These results are consistent with the idea that developmental and adult neurogenesis represent the same, highly conserved process, as all of these genes showed much less restricted expression in hippocampus at earlier ages in mouse (before P14). Altogether, these data present the SGZ as a highly heterogeneous and complex neurogenic niche and represent a valuable resource for the scientific community.
MATERIALS AND METHODS
ISH
All ISH data presented herein were generated using a high throughput semi-automated non-isotopic ISH platform (Lein et al., 2007) and are available through the Allen Brain Atlas portal (http://www.brain-map.org/). Data shown is from the Allen Mouse Brain Atlas, the Allen Developing Mouse Brain Atlas, and the National Institutes of Health (NIH) Blueprint Non-Human Primate (NHP) Atlas. Technical white papers describing these projects are available under the ‘Documentation’ tabs in each atlas. For adult mouse, developing mouse and non-human primate, the relevant documents are titled ‘In Situ Hybridization’, ‘Overview’ and ‘In Situ Hybridization’, respectively.
LCM and DNA microarray analysis of mouse SGZ
All animal procedures were performed according to protocols approved by The Salk Institute for Biological Studies Animal Care and Use Committee. Brains from 10- to 11-week-old C57BL/6 male mice (n=9) were quickly removed, flash-frozen in OCT (Sakura Finetek) and stored at -80°C. Cryostat sections (12 μm) were stained with Cresyl Violet and rapidly dehydrated through graded xylenes. An Arcturus PixCell II machine (Arcturus) was used to isolate two- to three-cell thick bands from the outer and inner (including the SGZ, and specifically excluding cells of the hilus) portions of the dentate GCL (supplementary material Fig. S1). Total RNA was purified using the Absolutely RNA Nanoprep Kit (Stratagene) and RNA yield was assessed using RiboGreen RNA Quantitation Reagent (Molecular Probes). RNA from three groups of three animals (0, 4 and 30 days of running) was isolated independently and amplified separately. Total RNA (5 ng) was amplified using the MessageAmp aRNA Kit (Ambion). First and second rounds were performed per the manual, with an additional third round identical to the second except using the Enzo BioArray High Yield RNA Transcript Labeling Kit (Affymetrix). Finally, 15 μg of biotinylated aRNA was fragmented and hybridized to Affymetrix MG-U74Av2 arrays. All data are available at Gene Expression Omnibus (Edgar et al., 2002) under accession number GSE39697. We were unable to dissociate batch effects from behavioral conditions, and therefore focused analysis only on anatomical separation, which was not impacted by batch effects.
LMD and DNA microarray analysis of rhesus monkey SGZ across postnatal development
Detailed technical white papers describing tissue processing and microarray profiling are available at the Allen Brain Atlas portal through the Non-Human Primate link, or directly from the NIH Blueprint NHP Atlas website (http://www.blueprintnhpatlas.org/), under the ‘Documentation’ tab. Microarray data can be viewed online by selecting ‘Microdissection’ under the ‘Microarray’ tab and can be downloaded under the ‘Download’ tab. Frozen postmortem tissue samples from male rhesus macaque (Macaca mulatta) were provided by the California National Primate Research Center (CNPRC; http://www.cnprc.ucdavis.edu), and all procedures were approved by the Institutional Animal Care and Use Committee (IACUC) at UC Davis. Brain regions were collected from well-characterized rhesus monkeys born and raised at the CNPRC in outdoor, half-acre enclosures that provide a naturalistic setting and normal social environment. Extensive health, family lineage and dominance information is maintained on all animals.
Samples were analyzed from three replicates per age (0, 3, 12 and 48 months). Briefly, frozen coronal tissue slabs containing the hippocampus were cryosectioned at 14 μm onto polyethylene naphthalate (PEN) slides (Leica Microsystems), dried and stored at -80°C. A 1:10 Nissl series was generated for neuroanatomical reference. Slides for LMD were also very lightly Nissl stained with Cresyl Violet to allow cytoarchitectural visualization and were then dehydrated. LMD was performed on a Leica LMD6000 (Leica Microsystems), using the Nissl stain as a guide to identify target brain regions. Microdissected tissue was collected directly into lysis buffer with β-mercaptoethanol, RNA was isolated using the RNeasy Micro Kit (Qiagen). Samples passing RNA quality control were amplified, labeled and hybridized to Affymetrix GeneChip Rhesus Macaque Genome Arrays as described by Bernard et al. (Bernard et al., 2012) with a few modifications. Briefly, samples were amplified and labeled using a custom two cycle version, using two kits of the GeneChip HT One-Cycle cDNA Synthesis Kit from Affymetrix. Five ng of total RNA was added to the initial reaction mix together with 250 ng of pBR322 (Invitrogen). In vitro transcription (IVT) for the first cycle was performed using a 5X MEGAscript T7 Kit (Ambion). Following the first round of IVT, the plasmid carrier was removed with a DNaseI (Qiagen) treatment. The first round IVT products were purified using the Qiagen MinElute Kit (Qiagen). Input into the second round was normalized to 400 ng.
Microarray data normalization and analysis
Microarray data from mouse and macaque were processed as similarly as possible. The BioConductor ‘affy’ package was used to read macaque Affymetrix microarray data and summarize probe level data into Robust Multichip Analysis (RMA) expression measures (Bolstad et al., 2003). Initial data analysis and normalization of mouse data were performed in Affymetrix Expression Console using RMA and Probe Logarithmic Intensity Error Estimation (PLIER) using the minus mismatch option (-MM). For both data sets, ComBat was applied to reduce systematic bias across batches (Johnson et al., 2007). To allow better comparison with orthologous mouse genes, macaque probe sets were annotated with human gene symbols instead of using the Affymetrix annotation (supplementary material Fig. S2), and only the single probe set with the highest mean expression per gene was included in the analysis (Miller et al., 2011), leaving a total of 12,176 macaque and 9184 mouse genes, of which 6089 were in common (orthologs).
Genes differentially expressed between SGZ and GCL were calculated in both species using paired t-tests across all samples (i.e. across all batches/age groups). PCA in macaque was performed on the top 388 genes (P<10-8) from an ANOVA comparing each of the groups (three regions and four time points), to allow visualization of the two components of the data that explain the most variance.
WGCNA was performed on all 24 macaque SGZ/GCL samples with all genes using the standard method (Horvath et al., 2006; Zhang and Horvath, 2005) (using v1.20 of the WGCNA library). Specifically, the adjacency was calculated (in linear space) using a signed network (power=14). Topological overlap (TO) was then calculated and genes were hierarchically clustered using a dynamic tree-cutting algorithm (Horvath et al., 2006; Langfelder et al., 2008; Zhang and Horvath, 2005) with 1-TO as the distance measure. Modules were graphically depicted using the program VisANT (Hu et al., 2004). Module characterizations were made using module eigengene (ME; first principal component) expression, gene ontology enrichment using Enrichment Analysis Systematic Explorer (EASE), v2.0 (Hosack et al., 2003), and enrichment for cell types using the R function userListEnrichment (Miller et al., 2011). Module enrichment for mouse-derived SGZ genes was calculated using a hypergeometric test. Differentially expressed genes were also annotated using EASE and userListEnrichment. Modules were associated with cell division by correlating ME expression with the average number of proliferating cells in the DG of age-matched macaque monkeys, as reported by Jabès et al. (Jabès et al., 2010). The 48-month count was estimated using reported counts for earlier (1 year) and later (5-10 years) ages.
Characterization of Sox4fl/fl;Sox11fl/fl;Emx1-Cre mouse hippocampi
Generation of Sox4fl/fl;Sox11fl/fl;Emx1-Cre has been previously described (Shim et al., 2012). Mice were anesthetized and sacrificed at birth (P0). Brains were dissected and fixed by immersion in 4% paraformaldehyde in PBS, pH 7.4, overnight. After washing once in PBS for 10 minutes, tissue was embedded in 4% agarose and sectioned at 70 μm with a Vibratome VT1000S (Leica). For BCL11B (also known as CTIP2) immunohistochemistry, tissue sections were pre-incubated in 1% hydrogen peroxide in PBS, washed and incubated in blocking solution (BS) containing 5% normal donkey serum (Jackson ImmunoResearch Laboratories), 1% bovine serum albumin (BSA), 0.1% glycine, 0.1% lysine and 0.3% Triton X-100 in PBS for 1 hour at room temperature (RT) and overnight at 4°C in BCL11B antibody (rat; 1:250; Santa Cruz Biotechnology, sc-56014) diluted in BS. After washing in PBS, tissue sections were incubated in avidin-biotin-peroxidase complex (Vectastain ABC Elite Kit, Vector Laboratories) for 1 hour at RT. Peroxidase activity was visualized using a DAB peroxidase substrate kit (Vector Laboratories). Sections were mounted on Superfrost Plus charged slides, dehydrated, coverslipped with Permount and scanned with Aperio scanner. Nissl staining was performed on sections mounted on Superfrost Plus charged slides. Once dried, sections were rehydrated in descending series of ethanol (100%, 95%, 70% and 50%) and water for 3 minutes each followed by staining in 0.1% Cresyl Violet solution for 3 minutes. Then, the sections were quickly rinsed in water to remove excess stain and differentiated in 95% ethanol containing 0.1% glacial acetic acid for 30 seconds followed by dehydration in 95% and 100% ethanol for 3 minutes each, treated with xylene and coverslipped with Permount.
Supplementary Material
Acknowledgments
We thank the Allen Institute founders, Paul G. Allen and Jody Allen, for their vision, encouragement and support. We also acknowledge the Atlas Production Team; Paul Wohnoutka, Amanda Ebbert, Lon Luong and Erich Fulfs for supporting high-throughput histological data production; and Chinh Dang for supporting database needs. Thanks to Tracy Lemon, Rebecca Morgan, Jefferey Chen, Naveed Mastan, Lindsey Gourley, Cathy Copeland and Eric Olson for contributing to tissue sectioning and laser microdissection; and Jeff Goldy for bioinformatics assistance in macaque-human gene alignments.
Footnotes
Competing interests
The authors declare no competing financial interests.
Author contributions
E.S.L., A.B., F.H.G. and J.N. conceived the overall experimental design in rhesus and mouse. J.A.M. and E.S.L. analyzed the rhesus microarray and developing mouse ISH data, performed the between-species comparison, and wrote the manuscript. C.-K.L., M.J.H. and A.R.J. assisted with microarray data analysis and manuscript preparation. J.N., F.H.G. and E.S.L. generated mouse microarray data, identified and characterized SGZ genes using adult mouse ISH data, and assisted with writing. D.F., S. Shim, and N.S. generated the Sox4fl/fl;Sox11fl/fl;Emx1-Cre mice and characterized the expression of these mice relative to controls. R.A.D, S. Shapouri, K.A.S., S.M.S., A.B., J.L.B. and D.G.A. collected and processed rhesus tissue and microarray data for the NIH Blueprint NHP Atlas. All authors read and approved the final manuscript.
Funding
Work in the laboratory of Nenad Sestan was supported by the National Institutes of Health (NIH) [grant NS054273]. The NIH Blueprint project described was supported by the National Institute of Mental Health [contract HHSN-271-2008-0047]. Deposited in PMC for release after 12 months.
Supplementary material
Supplementary material available online at http://dev.biologists.org/lookup/suppl/doi:10.1242/dev.097212/-/DC1
References
- Alfonso J., Le Magueresse C., Zuccotti A., Khodosevich K., Monyer H. (2012). Diazepam binding inhibitor promotes progenitor proliferation in the postnatal SVZ by reducing GABA signaling. Cell Stem Cell 10, 76–87 [DOI] [PubMed] [Google Scholar]
- Altman J., Das G. D. (1965). Autoradiographic and histological evidence of postnatal hippocampal neurogenesis in rats. J. Comp. Neurol. 124, 319–335 [DOI] [PubMed] [Google Scholar]
- Alvarez-Buylla A., Lim D. A. (2004). For the long run: maintaining germinal niches in the adult brain. Neuron 41, 683–686 [DOI] [PubMed] [Google Scholar]
- Amaral D. G. (1978). A Golgi study of cell types in the hilar region of the hippocampus in the rat. J. Comp. Neurol. 182, 851–914 [DOI] [PubMed] [Google Scholar]
- Amrein I., Isler K., Lipp H.-P. (2011). Comparing adult hippocampal neurogenesis in mammalian species and orders: influence of chronological age and life history stage. Eur. J. Neurosci. 34, 978–987 [DOI] [PubMed] [Google Scholar]
- Basak O., Taylor V. (2007). Identification of self-replicating multipotent progenitors in the embryonic nervous system by high Notch activity and Hes5 expression. Eur. J. Neurosci. 25, 1006–1022 [DOI] [PubMed] [Google Scholar]
- Beckervordersandforth R., Tripathi P., Ninkovic J., Bayam E., Lepier A., Stempfhuber B., Kirchhoff F., Hirrlinger J., Haslinger A., Lie D. C., et al. (2010). In vivo fate mapping and expression analysis reveals molecular hallmarks of prospectively isolated adult neural stem cells. Cell Stem Cell 7, 744–758 [DOI] [PubMed] [Google Scholar]
- Bernard A., Lubbers L. S., Tanis K. Q., Luo R., Podtelezhnikov A. A., Finney E. M., McWhorter M. M. E., Serikawa K., Lemon T., Morgan R., et al. (2012). Transcriptional architecture of the primate neocortex. Neuron 73, 1083–1099 [DOI] [PMC free article] [PubMed] [Google Scholar]
- Bolstad B. M., Irizarry R. A., Astrand M., Speed T. P. (2003). A comparison of normalization methods for high density oligonucleotide array data based on variance and bias. Bioinformatics 19, 185–193 [DOI] [PubMed] [Google Scholar]
- Bracko O., Singer T., Aigner S., Knobloch M., Winner B., Ray J., Clemenson G. D., Suh H., Couillard-Despres S., Aigner L., et al. (2012). Gene expression profiling of neural stem cells and their neuronal progeny reveals IGF2 as a regulator of adult hippocampal neurogenesis. Neuroscience 32, 3376–87 [DOI] [PMC free article] [PubMed] [Google Scholar]
- Brandt M. D., Jessberger S., Steiner B., Kronenberg G., Reuter K., Bick-Sander A., von der Behrens W., Kempermann G. (2003). Transient calretinin expression defines early postmitotic step of neuronal differentiation in adult hippocampal neurogenesis of mice. Mol. Cell. Neurosci. 24, 603–613 [DOI] [PubMed] [Google Scholar]
- Brown J. P., Couillard-Després S., Cooper-Kuhn C. M., Winkler J., Aigner L., Kuhn H. G. (2003). Transient expression of doublecortin during adult neurogenesis. J. Comp. Neurol. 467, 1–10 [DOI] [PubMed] [Google Scholar]
- Cahoy J. D., Emery B., Kaushal A., Foo L. C., Zamanian J. L., Christopherson K. S., Xing Y., Lubischer J. L., Krieg P. A., Krupenko S. A., et al. (2008). A transcriptome database for astrocytes, neurons, and oligodendrocytes: a new resource for understanding brain development and function. J. Neurosci. 28, 264–278 [DOI] [PMC free article] [PubMed] [Google Scholar]
- Calaora V., Chazal G., Nielsen P. J., Rougon G., Moreau H. (1996). mCD24 expression in the developing mouse brain and in zones of secondary neurogenesis in the adult. Neuroscience 73, 581–594 [DOI] [PubMed] [Google Scholar]
- Camoletto P., Colesanti A., Ozon S., Sobel A., Fasolo A. (2001). Expression of stathmin and SCG10 proteins in the olfactory neurogenesis during development and after lesion in the adulthood. Brain Res. Bull. 54, 19–28 [DOI] [PubMed] [Google Scholar]
- Cheung M., Abu-Elmagd M., Clevers H., Scotting P. J. (2000). Roles of Sox4 in central nervous system development. Brain Res. Mol. Brain Res. 79, 180–191 [DOI] [PubMed] [Google Scholar]
- Claiborne B. J., Amaral D. G., Cowan W. M. (1986). A light and electron microscopic analysis of the mossy fibers of the rat dentate gyrus. J. Comp. Neurol. 246, 435–458 [DOI] [PubMed] [Google Scholar]
- Distler C., Dreher Z., Stone J. (1991). Contact spacing among astrocytes in the central nervous system: an hypothesis of their structural role. Glia 4, 484–494 [DOI] [PubMed] [Google Scholar]
- Eckenhoff M. F., Rakic P. (1988). Nature and fate of proliferative cells in the hippocampal dentate gyrus during the life span of the rhesus monkey. Neuroscience 8, 2729–47 [DOI] [PMC free article] [PubMed] [Google Scholar]
- Edgar R., Domrachev M., Lash A. E. (2002). Gene Expression Omnibus: NCBI gene expression and hybridization array data repository. Nucleic Acids Res. 30, 207–210 [DOI] [PMC free article] [PubMed] [Google Scholar]
- Eriksson P. S., Perfilieva E., Björk-Eriksson T., Alborn A. M., Nordborg C., Peterson D. A., Gage F. H. (1998). Neurogenesis in the adult human hippocampus. Nat. Med. 4, 1313–1317 [DOI] [PubMed] [Google Scholar]
- Feng L., Hatten M. E., Heintz N. (1994). Brain lipid-binding protein (BLBP): a novel signaling system in the developing mammalian CNS. Neuron 12, 895–908 [DOI] [PubMed] [Google Scholar]
- Fukuda S., Kato F., Tozuka Y., Yamaguchi M., Miyamoto Y., Hisatsune T. (2003). Two distinct subpopulations of nestin-positive cells in adult mouse dentate gyrus. J. Neurosci. 23, 9357–9366 [DOI] [PMC free article] [PubMed] [Google Scholar]
- Gage F. H., Kempermann G., Palmer T. D., Peterson D. A., Ray J. (1998). Multipotent progenitor cells in the adult dentate gyrus. J. Neurobiol. 36, 249–266 [DOI] [PubMed] [Google Scholar]
- Gao Z., Ure K., Ables J. L., Lagace D. C., Nave K.-A., Goebbels S., Eisch A. J., Hsieh J. (2009). Neurod1 is essential for the survival and maturation of adult-born neurons. Nat. Neurosci. 12, 1090–1092 [DOI] [PMC free article] [PubMed] [Google Scholar]
- Gurok U., Loebbert R. W., Meyer A. H., Mueller R., Schoemaker H., Gross G., Behl B. (2007). Laser capture microdissection and microarray analysis of dividing neural progenitor cells from the adult rat hippocampus. Eur. J. Neurosci. 26, 1079–1090 [DOI] [PubMed] [Google Scholar]
- Hatakeyama J., Bessho Y., Katoh K., Ookawara S., Fujioka M., Guillemot F., Kageyama R. (2004). Hes genes regulate size, shape and histogenesis of the nervous system by control of the timing of neural stem cell differentiation. Development 131, 5539–5550 [DOI] [PubMed] [Google Scholar]
- Hawrylycz M. J., Lein E. S., Guillozet-Bongaarts A. L., Shen E. H., Ng L., Miller J. A., van de Lagemaat L. N., Smith K. A., Ebbert A., Riley Z. L., et al. (2012). An anatomically comprehensive atlas of the adult human brain transcriptome. Nature 489, 391–399 [DOI] [PMC free article] [PubMed] [Google Scholar]
- Horvath S., Zhang B., Carlson M., Lu K. V., Zhu S., Felciano R. M., Laurance M. F., Zhao W., Qi S., Chen Z., et al. (2006). Analysis of oncogenic signaling networks in glioblastoma identifies ASPM as a molecular target. Proc. Natl. Acad. Sci. USA 103, 17402–17407 [DOI] [PMC free article] [PubMed] [Google Scholar]
- Hosack D. A., Dennis G., Jr, Sherman B. T., Lane H. C., Lempicki R. A. (2003). Identifying biological themes within lists of genes with EASE. Genome Biol. 4, R70 [DOI] [PMC free article] [PubMed] [Google Scholar]
- Hu Z., Mellor J., Wu J., DeLisi C. (2004). VisANT: an online visualization and analysis tool for biological interaction data. BMC Bioinformatics 5, 17 [DOI] [PMC free article] [PubMed] [Google Scholar]
- Jabès A., Lavenex P. B. P., Amaral D. G., Lavenex P. (2010). Quantitative analysis of postnatal neurogenesis and neuron number in the macaque monkey dentate gyrus. Eur. J. Neurosci. 31, 273–285 [DOI] [PMC free article] [PubMed] [Google Scholar]
- Jessberger S., Toni N., Clemenson G. D., Jr, Ray J., Gage F. H. (2008). Directed differentiation of hippocampal stem/progenitor cells in the adult brain. Nat. Neurosci. 11, 888–893 [DOI] [PMC free article] [PubMed] [Google Scholar]
- Johnson W. E., Li C., Rabinovic A. (2007). Adjusting batch effects in microarray expression data using empirical Bayes methods. Biostatistics 8, 118–127 [DOI] [PubMed] [Google Scholar]
- Klausberger T., Somogyi P. (2008). Neuronal diversity and temporal dynamics: the unity of hippocampal circuit operations. Science (New York, N.Y.) 321, 53–57 [DOI] [PMC free article] [PubMed] [Google Scholar]
- Knoth R., Singec I., Ditter M., Pantazis G., Capetian P., Meyer R. P., Horvat V., Volk B., Kempermann G. (2010). Murine features of neurogenesis in the human hippocampus across the lifespan from 0 to 100 years. PLoS ONE 5, e8809 [DOI] [PMC free article] [PubMed] [Google Scholar]
- Kosaka T., Hama K. (1986). Three-dimensional structure of astrocytes in the rat dentate gyrus. J. Comp. Neurol. 249, 242–260 [DOI] [PubMed] [Google Scholar]
- Langfelder P., Zhang B., Horvath S. (2008). Defining clusters from a hierarchical cluster tree: the Dynamic Tree Cut package for R. Bioinformatics 24, 719–720 [DOI] [PubMed] [Google Scholar]
- Lawrence J. J., McBain C. J. (2003). Interneuron diversity series: containing the detonation—feedforward inhibition in the CA3 hippocampus. Trends Neurosci. 26, 631–640 [DOI] [PubMed] [Google Scholar]
- Leid M., Ishmael J. E., Avram D., Shepherd D., Fraulob V., Dollé P. (2004). CTIP1 and CTIP2 are differentially expressed during mouse embryogenesis. Gene Expr. Patterns 4, 733–739 [DOI] [PMC free article] [PubMed] [Google Scholar]
- Lein E. S., Hawrylycz M. J., Ao N., Ayres M., Bensinger A., Bernard A., Boe A. F., Boguski M. S., Brockway K. S., Byrnes E. J., et al. (2007). Genome-wide atlas of gene expression in the adult mouse brain. Nature 445, 168–176 [DOI] [PubMed] [Google Scholar]
- Lendahl U., Zimmerman L. B., McKay R. D. (1990). CNS stem cells express a new class of intermediate filament protein. Cell 60, 585–595 [DOI] [PubMed] [Google Scholar]
- Liao Y.-L., Sun Y.-M., Chau G.-Y., Chau Y.-P., Lai T.-C., Wang J.-L., Horng J.-T., Hsiao M., Tsou A.-P. (2008). Identification of SOX4 target genes using phylogenetic footprinting-based prediction from expression microarrays suggests that overexpression of SOX4 potentiates metastasis in hepatocellular carcinoma. Oncogene 27, 5578–5589 [DOI] [PubMed] [Google Scholar]
- Lois C., Alvarez-Buylla A. (1993). Proliferating subventricular zone cells in the adult mammalian forebrain can differentiate into neurons and glia. Proc. Natl. Acad. Sci. USA 90, 2074–2077 [DOI] [PMC free article] [PubMed] [Google Scholar]
- Matsumata M., Sakayori N., Maekawa M., Owada Y., Yoshikawa T., Osumi N. (2012). The effects of Fabp7 and Fabp5 on postnatal hippocampal neurogenesis in the mouse. Stem Cells 30, 1532–1543 [DOI] [PubMed] [Google Scholar]
- Miller J. A., Cai C., Langfelder P., Geschwind D. H., Kurian S. M., Salomon D. R., Horvath S. (2011). Strategies for aggregating gene expression data: the collapseRows R function. BMC Bioinformatics 12, 322 [DOI] [PMC free article] [PubMed] [Google Scholar]
- Ming G. L., Song H. (2005). Adult neurogenesis in the mammalian central nervous system. Annu. Rev. Neurosci. 28, 223–250 [DOI] [PubMed] [Google Scholar]
- Ming G.-L., Song H. (2011). Adult neurogenesis in the mammalian brain: significant answers and significant questions. Neuron 70, 687–702 [DOI] [PMC free article] [PubMed] [Google Scholar]
- Mu L., Berti L., Masserdotti G., Covic M., Michaelidis T. M., Doberauer K., Merz K., Rehfeld F., Haslinger A., Wegner M., et al. (2012). SoxC transcription factors are required for neuronal differentiation in adult hippocampal neurogenesis. J. Neurosci. 32, 3067–3080 [DOI] [PMC free article] [PubMed] [Google Scholar]
- Ng L., Bernard A., Lau C., Overly C. C., Dong H.-W., Kuan C., Pathak S., Sunkin S. M., Dang C., Bohland J. W., et al. (2009). An anatomic gene expression atlas of the adult mouse brain. Nat. Neurosci. 12, 356–362 [DOI] [PubMed] [Google Scholar]
- Nishino J., Yamashita K., Hashiguchi H., Fujii H., Shimazaki T., Hamada H. (2004). Meteorin: a secreted protein that regulates glial cell differentiation and promotes axonal extension. EMBO J. 23, 1998–2008 [DOI] [PMC free article] [PubMed] [Google Scholar]
- Oldham M. C., Konopka G., Iwamoto K., Langfelder P., Kato T., Horvath S., Geschwind D. H. (2008). Functional organization of the transcriptome in human brain. Nat. Neurosci. 11, 1271–1282 [DOI] [PMC free article] [PubMed] [Google Scholar]
- Overstreet Wadiche L., Bromberg D. A., Bensen A. L., Westbrook G. L. (2005). GABAergic signaling to newborn neurons in dentate gyrus. J. Neurophysiol. 94, 4528–4532 [DOI] [PubMed] [Google Scholar]
- Palmer T. D., Willhoite A. R., Gage F. H. (2000). Vascular niche for adult hippocampal neurogenesis. J. Comp. Neurol. 425, 479–494 [DOI] [PubMed] [Google Scholar]
- Riquelme P. A., Drapeau E., Doetsch F. (2008). Brain micro-ecologies: neural stem cell niches in the adult mammalian brain. Philos. Trans. R. Soc. B 363, 123–137 [DOI] [PMC free article] [PubMed] [Google Scholar]
- Roybon L., Hjalt T., Stott S., Guillemot F., Li J.-Y., Brundin P. (2009). Neurogenin2 directs granule neuroblast production and amplification while NeuroD1 specifies neuronal fate during hippocampal neurogenesis. PLoS ONE 4, e4779 [DOI] [PMC free article] [PubMed] [Google Scholar]
- Seki T., Arai Y. (1999). Temporal and spacial relationships between PSA-NCAM-expressing, newly generated granule cells, and radial glia-like cells in the adult dentate gyrus. J. Comp. Neurol. 410, 503–513 [DOI] [PubMed] [Google Scholar]
- Seri B., García-Verdugo J. M., McEwen B. S., Alvarez-Buylla A. (2001). Astrocytes give rise to new neurons in the adult mammalian hippocampus. J. Neurosci. 21, 7153–7160 [DOI] [PMC free article] [PubMed] [Google Scholar]
- Shim S., Kwan K. Y., Li M., Lefebvre V., Sestan N. (2012). Cis-regulatory control of corticospinal system development and evolution. Nature 486, 74–79 [DOI] [PMC free article] [PubMed] [Google Scholar]
- Sock E., Rettig S. D., Enderich J., Bösl M. R., Tamm E. R., Wegner M. (2004). Gene targeting reveals a widespread role for the high-mobility-group transcription factor Sox11 in tissue remodeling. Mol. Cell. Biol. 24, 6635–6644 [DOI] [PMC free article] [PubMed] [Google Scholar]
- Sugino K., Hempel C. M., Miller M. N., Hattox A. M., Shapiro P., Wu C., Huang Z. J., Nelson S. B. (2006). Molecular taxonomy of major neuronal classes in the adult mouse forebrain. Nat. Neurosci. 9, 99–107 [DOI] [PubMed] [Google Scholar]
- Tanaka M., Kadokawa Y., Hamada Y., Marunouchi T. (1999). Notch2 expression negatively correlates with glial differentiation in the postnatal mouse brain. J. Neurobiol. 41, 524–539 [PubMed] [Google Scholar]
- Temple S. (2001). The development of neural stem cells. Nature 414, 112–117 [DOI] [PubMed] [Google Scholar]
- van Praag H., Kempermann G., Gage F. H. (1999). Running increases cell proliferation and neurogenesis in the adult mouse dentate gyrus. Nat. Neurosci. 2, 266–270 [DOI] [PubMed] [Google Scholar]
- Zhang B., Horvath S. (2005). A general framework for weighted gene co-expression network analysis. Stat. Appl. Genet. Mol. Biol. 4, e17 [DOI] [PubMed] [Google Scholar]
- Zhao C., Deng W., Gage F. H. (2008). Mechanisms and functional implications of adult neurogenesis. Cell 132, 645–660 [DOI] [PubMed] [Google Scholar]
Associated Data
This section collects any data citations, data availability statements, or supplementary materials included in this article.