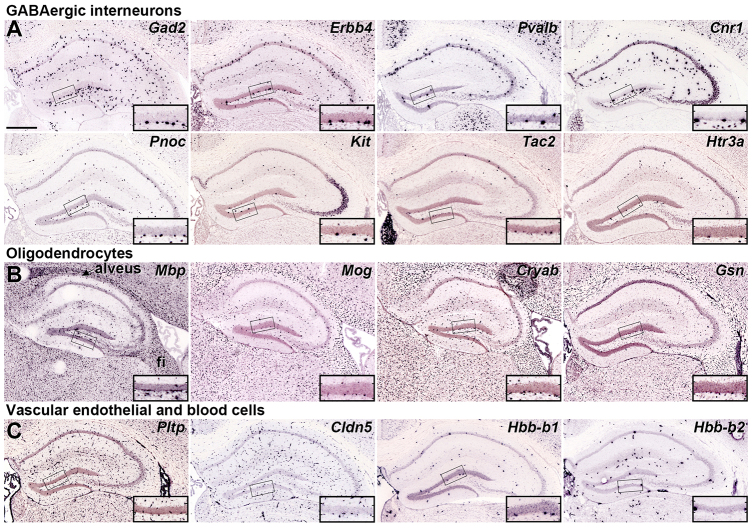
Fig. 2.
Genes labeling interneurons, oligodendrocytes and vascular cells in the adult SGZ. (A-C) ISH demonstrating enriched cellular expression in the SGZ compared with the overlying GCL selectively in GABAergic interneurons (A), oligodendrocytes (B) and vascular cells (C) in coronal (A,C) or sagittal (B) sections through the P56 mouse hippocampus. Inset panels show high magnification views of the GCL and SGZ corresponding to boxed regions in low magnification images. High magnification images are oriented with SGZ positioned below the GCL regardless of which blade of the dentate gyrus is represented. Scale bar: 500 μm.

