Abstract
HIV-induced immune activation leads to expansion of a subset of human CD8+ T cells expressing HLA-DR antigens. Expansion of CD8+HLA-DR+ T cells can be also observed in non-HIV settings including several autoimmune diseases and aging. Although these cells are felt to represent “immune exhaustion” and/or to be anergic, their precise role in host defense has remained unclear. Here, we report that this subset of cells exhibits a restricted repertoire, shows evidence of multiple rounds of division, but lacks markers of recent TCR-engagement. Detailed cell cycle analysis revealed that compared with their CD8+HLA-DR-counterpart, the CD8+HLA-DR+ T-cell pool contained an increased fraction of cells in S-phase with elevated levels of the G2/M regulators: cyclin A2, CDC25C, Cdc2 (CDK1), indicating that these cells are not truly anergic but rather experiencing proliferation in vivo. Together, these data support a hypothesis that antigen stimulation leads to the initial expansion of a CD8+ pool of cells in vivo that undergo further expansion independent of ongoing TCR-engagement. No qualitative differences were noted between CD8+HLA-DR+ cells from HIV+ and HIV− donors, indicating that the generation of CD8+HLA-DR+ T cells is a part of normal immune regulation that is exaggerated in the setting of HIV-1 infection.
Keywords: Immune activation, HIV, activated CD8+ T cells, HLA-DR, cell cycle
Introduction
The immune systems of patients with HIV-1 infection are characterized by a decrease in size of the CD4+ T-cell pool; an increase in size of the CD8+ T-cell pool; and a global state of immune activation, leading to an impaired ability to mount antigen-specific immune responses [1-3]. The clinical consequences of HIV-associated immune activation extend beyond host defenses. It has become apparent that HIV-1 infection is not only a risk factor for opportunistic infection and neoplasms but also cardiovascular, hepatic and renal diseases [4-6]. The importance of immune activation in HIV infection has been reinforced by the strong association betweens baseline levels of IL-6, D-dimer, soluble CD14, and all-cause mortality [7, 8].
An increase in the number and fraction of CD8+ T cells is a prominent feature of HIV-infected individuals [3, 9]. These activated CD8+ T cells express HLA-DR and CD38 antigens on their surface and exhibit increased turnover in vivo [10, 11]. The importance of activation of this cell pool is reflected in observation that the level of CD8 T cell activation, as determined by HLA-DR and CD38 expression, is a single better correlate of the risk of the onset of AIDS and death than either CD4 cell count or plasma viral load [12, 13].
Expansions of CD8+ T cells positive for HLA-DR expression occur in other disease settings and in healthy individuals. They can be observed in the blood of individuals with certain types of autoimmune diseases including systemic lupus erythematosus (SLE)[14], mixed connective tissue disease[15], multiple sclerosis [16], psoriasis [17], rheumatoid arthritis [18] or Wegener’s granulomatosis [19]. They also increase as part of the normal aging process [20]. Their occurrence and pattern of persistence indicate that at least some of the expanded CD8+HLADR+ T cells may be a part of normal immunoregulation.
A number of studies have demonstrated that CD8+ T cells obtained from patients with HIV-1 infection are more prone to apoptosis [21, 22] and less responsive to anti-CD3 stimulation than CD8+ T cells from uninfected individuals when stimulated in vitro [23, 24]. The mechanism(s) underlying these observations have been difficult to dissect. In the present study, we have sought to more carefully study these cells from the perspective of cell cycle regulation and in so doing derive a better understanding of their possible role in health and disease.
Results
Ex vivo CD8+HLA-DR+ T cells do not express activation markers associated with recent TCR stimulation
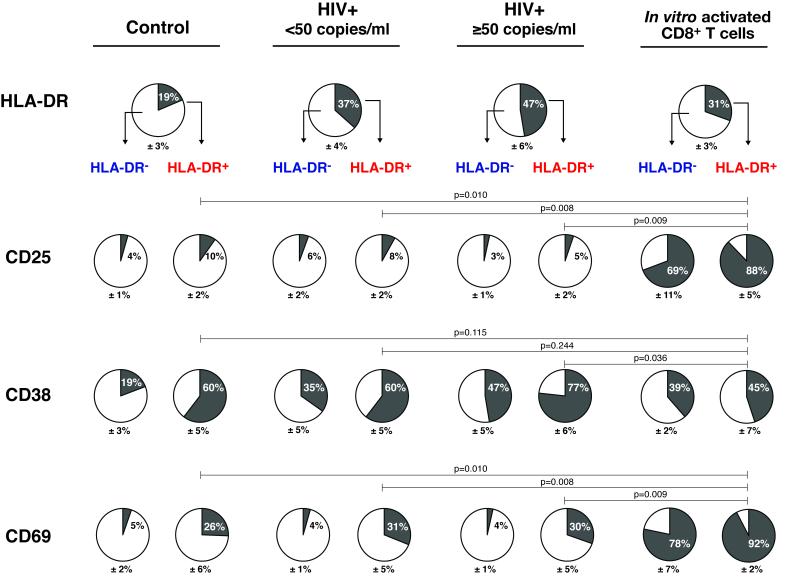
It has been known for some time that a subset of peripheral blood CD8+ T cells from patients with HIV-1 infection exhibit increased expression of the activation markers: HLA-DR and CD38 [10, 11]. The activation marker profile of these CD8+HLA-DR+ cells is quite distinct from that seen following activation of CD8+ T cells via the TCR complex (modeled by “In vitro activated CD8+ T cells” in Fig.1). Approximately, 90% of the CD8+HLA-DR+ T cells activated in vitro were positive for CD25 24 hours following stimulation with anti-CD3+CD28. In contrast, only a small fraction of peripheral blood CD8+HLA-DR+ T cells expressed CD25 (10% in control; 8% in HIV+ <50; and 5% in HIV+ ≥50) A similar dichotomy was noted for CD8+HLA-DR− T cells. While CD8+HLA-DR+ cells without concomitant expression of CD25 and CD69 are seen in the peripheral blood of both control individuals and patients with HIV-1 infection, this population is overrepresented in the pool of CD8+ T cells in patients with HIV-1 infection (39% of CD8+ T cells had the HLADR+CD25− phenotype in HIV-infected individuals vs. 17% in controls) (Fig.1).
Figure 1. Analysis of activation markers on CD8+ T cells from HIV-infected patients reveals no evidence of recent T cell receptor engagement.
PBMCs isolated from control (n=14), HIV+ <50 copies/ml (n=17) and HIV+ ≥50 copies/ml (n=9) individuals were analyzed by 4-color flow cytometry for cell surface expression of HLA-DR, CD25, CD38 and CD69 activation markers. Percentages of HLA-DR expressing cells were calculated on CD3+CD8+ T cells in the lymphocyte gate. Percentages of CD25, CD38 and CD69 expression were calculated separately for CD8+HLA-DR− and CD8+HLA-DR+ T cell subsets. HLADR depleted CD8+ T cells from healthy control donors that were stimulated with anti-CD3+CD28 for 24 hours in vitro (n=3) were used as a model for antigen-activated CD8+ T cells. The proportions of cells expressing HLA-DR, CD25, CD38 or CD69 are indicated by the dark gray regions of the pie charts. Mean + SEM values are shown. A nonparametric Mann-Whitney test was performed for comparison of the frequencies of cells expressing the activation markers between different groups. Representative plots of cell surface expression of CD25, CD38 and CD69 on CD8+HLA-DR− and CD8+HLA-DR+ T cells are shown in Supporting Information Fig.7. Data are representative of control (n=14), HIV+ <50 copies/ml (n=17) and HIV+ ≥50 copies/ml (n=9) individuals.
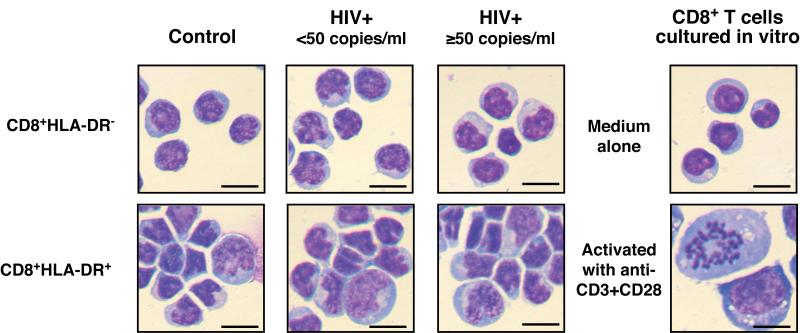
To directly visualize these cell subpopulations, freshly-isolated CD8+HLA-DR-and CD8+HLA-DR+ were stained with Wright-Giemsa stain. While the majority of CD8+HLA-DR+ cells were similar in size to the CD8+HLA-DR− cells, the CD8+HLA-DR+ cells also contained a portion of cells that were larger in size and exhibited more irregular shapes than the CD8+HLA-DR− cells (Fig.2). Chromosome condensation, a characteristic feature in mitotic cells, was easily detectable in CD8+ T cells that were stimulated in vitro with anti-CD3+CD28 for 2 days at a frequency of an approximately 20 in 100, and in freshly-isolated CD8+HLA-DR+ cells at a frequency of an approximately one in 100. Neither chromosome condensations nor enlargement of cell size was ever detected in freshly-isolated CD8+HLA-DR− cells. The shape and the size of the cells from the HIV-infected individuals (both HIV+ <50 and HIV+ ≥50 groups) were very similar to those from the healthy control subjects.
Figure 2. Wright-Giemsa staining of CD8+HLA-DR− and CD8+HLA-DR+ T cells.
Purified CD8+HLA-DR− and CD8+HLA-DR+ T cells were freshly isolated from PBMCs. Wright-Giemsa staining pictures of CD8+HLA-DR− T cells cultured in vitro in medium alone or with anti-CD3+CD28 for 2 days are also shown. Bar = 10 μm. Data are representative of 3 individuals for each group.
CD8+HLA-DR+ T cell pool contains more cycling cells than CD8+HLA-DR− T cell pool
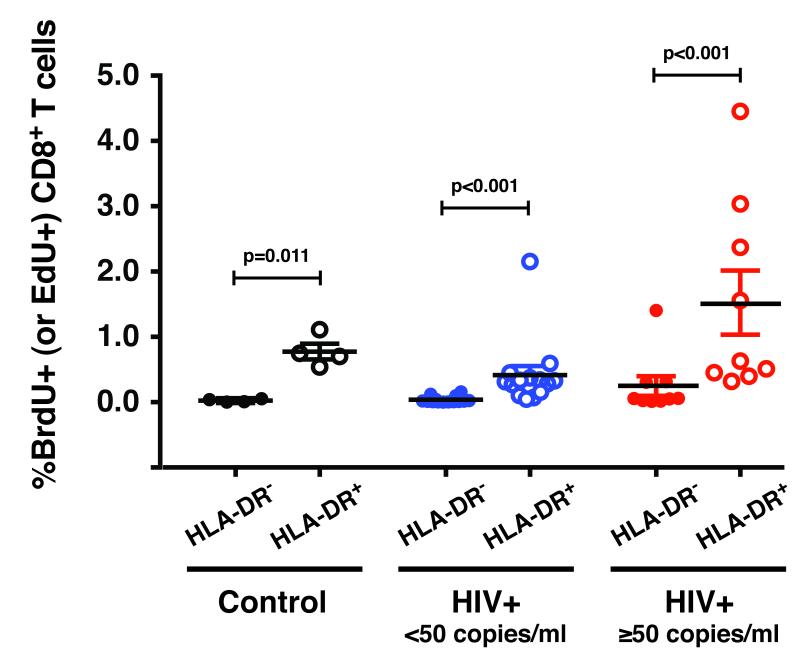
The fraction of cells in the S-phase of the cell cycle was addressed by measuring spontaneous ex vivo incorporation of the DNA precursor BrdU (or EdU) (Fig.3). PBMCs from control, HIV+ <50 and HIV+ ≥50 individuals were pulse-labeled with BrdU (or EdU) for 4 hours, and BrdU (or EdU) incorporation was measured by flow cytometry. The CD8+HLA-DR+ pool of cells consistently had higher levels of BrdU (or EdU) incorporation than CD8+HLA-DR− cells. This was true for cells from healthy controls as well as HIV-infected individuals. Consistent with previous findings [25, 26], the percentages of cycling CD8+HLA-DR+ cells were higher in HIV+ ≥50 than in HIV+ <50 patients (p=0.003).
Figure 3. The CD8+HLA-DR+ pool of cells incorporates higher levels of BrdU (or EdU) than CD8+HLA-DR− cells.
Ex vivo BrdU (or EdU) labeling of PBMCs was performed. The percentages of the CD8+HLA-DR− and CD8+HLA-DR+ T cells that were positive for BrdU (or EdU) were determined. Bars indicate median and inter-quartile range (IQR). Statistical significance was determined by the Mann-Whitey test. The P values represent differences in the fraction of cells in the S-phase of the cell cycle between CD8+HLA-DR− and CD8+HLA-DR+ subsets. The results were obtained from control (n=4), HIV+ <50 (n=14) and HIV+ ≥50 (n=9) individuals.
CD8+HLA-DR+ T cells are antigen-experienced and have undergone extensive proliferation in vivo
The CD8+HLA-DR− population is comprised of a mixture of naive and memory cells. In control individuals, the CD8+HLA-DR− pool of cells is enriched for naive cells (naive: average 59%, range 37-76%, n=4; memory: average 32%, range 23-41%, n=4)(Supporting Information Fig.1) while the CD8+HLA-DR+ pool of cells is predominantly memory cells (average 78%, range 70-88%, n=4). To eliminate the bias derived from different proportions of naive and memory T cells in the CD8+HLA-DR− cells, we analyzed CD8+HLA-DR− naive and CD8+HLA-DR-memory cells separately and compared them to the CD8+HLA-DR+ cells. The naive and memory fractions of CD8+HLA-DR− pool were obtained by FACS sorting on the basis of CD45RO and CD27. The CD8+HLA-DR−CD45RO−CD27+ and CD8+HLA-DR−CD45RO+CD27+ subsets are hereafter referred to as CD8+HLA-DR− naive and CD8+HLA-DR− memory cells, respectively. The gating strategy used to obtain these 3 subsets is shown in Supporting Information Fig.2.
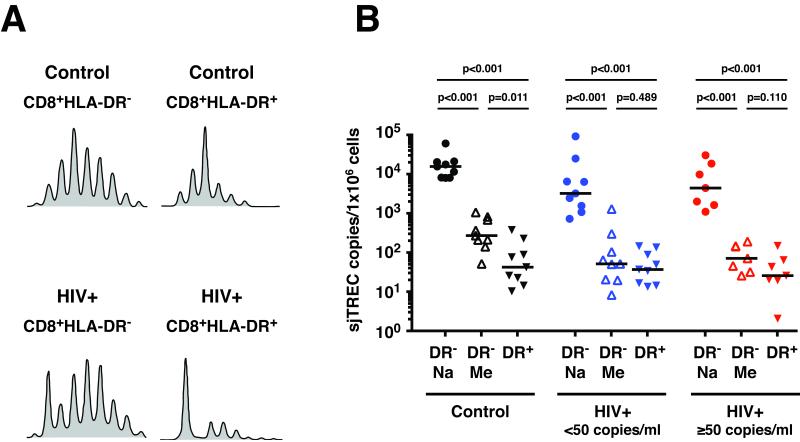
To look for evidence of prior antigen-driven clonal expansion, studies of the TCR repertoire were performed (Fig.4A). The TCR repertoire of the CD8+HLA-DR+ cells of both control and HIV-infected individuals contained oligoclonal expansions. The replicative histories of these peripheral blood CD8+ T cell subsets were characterized by comparing the TREC contents of the CD8+HLA DR+ cells to that of the CD8+HLA-DR− naive and CD8+HLA-DR− memory subsets (Fig.4B). The TREC content of the CD8+HLA-DR+ cells was approximately 2-log lower than that of the CD8+HLA-DR− naive cells (41 versus 15,264 sjTREC copies/106 cells for control; 36 versus 3,139 sjTREC copies/106 cells for HIV+ <50; and 25 versus 4,288 sjTREC copies/106 cells for HIV+ ≥50), indicating that the CD8+HLA-DR+ cells had previously undergone multiple rounds (approximately 9 divisions) of clonal expansion in vivo. Overall, there was no statistical difference in the TREC levels between the CD8+HLA-DR− memory and CD8+HLA-DR+ subsets from either HIV+ <50 or HIV+ ≥50. The CD8+HLA-DR+ cells from the control subjects had slightly lower TREC levels than the CD8+HLADR− memory cells (41 versus 262 sjTREC copies/106 cells, p=0.011).
Figure 4. TCR repertoire and TREC content of CD8+HLA-DR− naive, CD8+HLA-DR− memory and CD8+HLA-DR+ cells.
(A) The TCR repertoire patterns (Vβ11) are shown. Due to insufficient RNA from each individual sample, the TCR repertoire analysis was performed only for CD8+HLA-DR− and CD8+HLA-DR+ cells. The spectratype profiles shown in (A) are representative sets from control (n=6) and HIV-infected (n=10) individuals. (B) The number of sjTREC/1×106 cells was determined for FACS-sorted CD8+HLA-DR− naive, CD8+HLA-DR− memory and CD8+HLA-DR+ T cell subsets. Solid bars indicate median values. The level of statistical significance was determined by the Mann-Whitey test. DR− and DR+ stand for HLA-DR negative and HLA-DR positive cells respectively. Na and Me stand for naive and memory cells respectively. The results were obtained from control (n=9), HIV+ <50 (n=9) and HIV+ ≥50 (n=7) individuals.
Peripheral pool of CD8+HLA-DR+ is enriched for cells actively involved in cell cycle progression
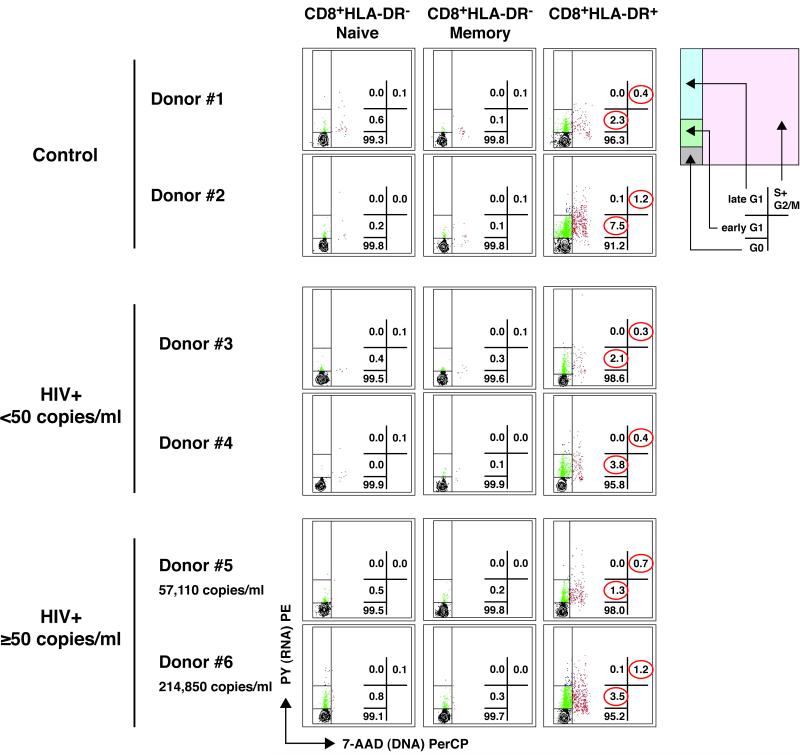
Although activated cells might be more likely to undergo proliferation, it has been reported that CD8+HLA-DR+ T cells are at an arrested phase of cell cycle and unable to divide [22-24]. In order to determine the cell cycle position of CD8+HLA-DR− naive, CD8+HLA-DR− memory and CD8+HLA-DR+ cells and test the accuracy of those statements, simultaneous staining with 7-AAD (DNA) and pyronin Y (RNA) was performed (Fig.5). For studies depicted in Figures 5 and 6, magnetic bead-separation, instead of FACS-sorting, was used to obtain populations of CD8+HLA-DR− naive, CD8+HLA-DR− memory and CD8+HLA-DR+ cells. This approach was necessary due to the fact that FACS-sorted cells are bound with fluorescent-conjugated antibodies that interfere with the detection of the DNA− and RNA-binding fluorescent dyes (7-AAD and pyronin Y, respectively). The strategy used to purify CD8+HLA-DR− naive, CD8+HLA-DR-memory and CD8+HLA-DR+ subsets by magnetic beads and the purity of those populations are depicted in Supporting Information Fig.3. Freshly isolated CD8+HLA-DR− naive cells exhibited a cell cycle profile typical of that seen in quiescent cells with the majority of cells in G0 (average: 99.4% in control, n=5; 99.8% in HIV+ <50, n=6; and 99.6% in HIV+ ≥50, n=8) and <0.1% of cells in S+G2/M of the cell cycle. The CD8+HLA-DR− memory cells were virtually identical to the CD8+HLA-DR− naive cells. Although the majority of CD8+HLA-DR+ cells were also found in G0 (average: 94.5% in control; 97.9% in HIV+ <50; and 95.8% in HIV+ ≥50), these cells also contained a substantial fraction of cells in early G1 (average: 4.6% in control; 1.8% in HIV+ <50; and 3.1% in HIV+ ≥50) and in S+G2/M (average: 0.9% in control; 0.3% in HIV+ <50; and 0.9% in HIV+ ≥50). Overall, there were no discernible differences in the cell cycle profiles of CD8+HLA-DR− naive, CD8+HLA-DR− memory and CD8+HLA-DR+ cells when comparing the control, HIV+ <50 and HIV+ ≥50 groups. Of note, if anything the ratio of G1:S was lower in the CD8+HLA-DR+ cells from the HIV+ ≥50 group (median: 3.0, range: 1.8-5.3) than in the other two populations of subjects (Control group, median: 5.8, range: 3.0-7.8; and HIV+ <50 group, median: 5.5, range: 2.5-9.5). Therefore, it is unlikely that cell cycle arrest was induced at this stage of the cell cycle in the CD8+HLA-DR+ cells as a consequence of HIV-1 infection.
Figure 5. The peripheral pool of CD8+HLA-DR+ cells contains more cycling cells than that of CD8+HLA-DR− naive and memory cells.
Cell cycle analysis was performed by flow cytometry using simultaneous staining with 7-AAD (DNA) and pyronin Y (PY, RNA). Definitions of G0, early G1, late G1, and S+G2/M phases of the cell cycle are described in the Materials and methods and the diagram on the right helps identify positions of G0, early G1, late G1 and S+G2/M of the cell cycle. The values in the plots indicate the percentages of cells in the regions corresponding to G0, early G1, late G1 and S+G2/M. Representative patterns from 2 different donors are shown for control (n=5), HIV+ <50 (n=6), and HIV+ ≥ 50 (n=8) groups.
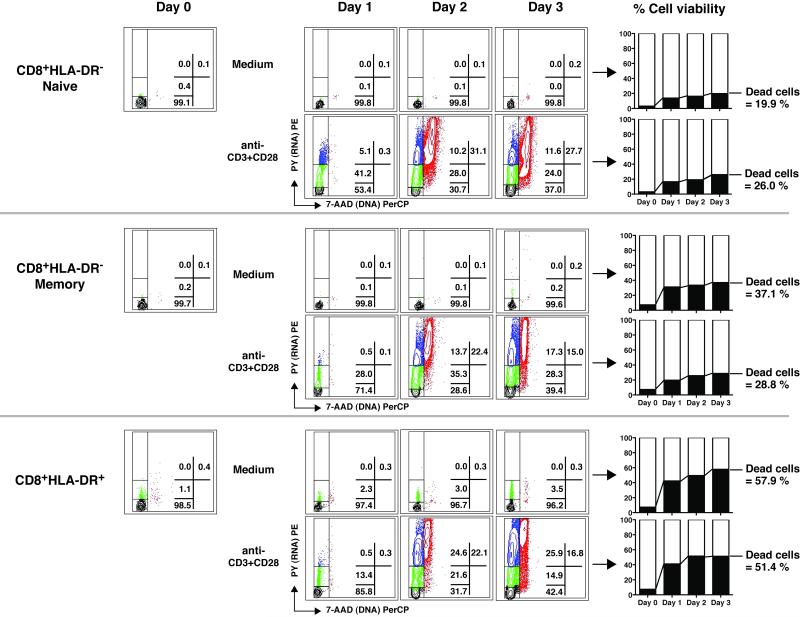
Figure 6. The proliferative capacity and death rates of CD8+HLA-DR− naive, CD8+HLA-DR− memory and CD8+HLA-DR+ cells.
DNA and RNA content were determined for cells freshly isolated by microbeads (Day 0) and for cells harvested following 1-3 days of culture with medium alone or in the presence of anti-CD3+CD28. The regions corresponding to G0, early G1, late G1 and S+G2/M are the same as those in Figure 5. The percentages of dead cells were determined by flow cytometry with Live/Dead cell staining dye. Plots shown are from an HIV-infected individual with HIV-RNA <50 copies/ml representative of 3 such individuals. Gating strategy used to analyze the cell cycle status is shown in Supporting Information Fig.8.
CD8+HLA-DR+ and CD8+HLA-DR− memory cells exhibit similar in vitro proliferative capacity
When freshly isolated CD8+HLA-DR− naive cells were activated by anti-CD3+CD28 in vitro, they responded with approximately 50% of cells entering early and late G1 phases of the cell cycle within 24 hours (Fig.6). At day 2 of stimulation, over 30% of the cells had divided. CD8+HLA-DR− memory and CD8+HLA-DR+ cells also entered cell cycle following stimulation with anti-CD3+CD28 stimulation, however, to a lesser extent than that seen with the CD8+HLA-DR− naive cells. There was little, if any, difference between the CD8+HLA-DR− memory and the CD8+HLA-DR+ cells to stimulation with anti-CD3+CD28. Among the three cell subsets examined, the CD8+HLA-DR+ pool suffered the highest rates of cell death (both spontaneous and activation-induced) in vitro. By the end of a 3-day culture period, more than half of the CD8+HLA-DR+ cells had died (58% in medium alone; 51% in anti-CD3+CD28 stimulation); compared to approximately 25% for the CD8+HLA-DR− naïve (20% in medium alone; 26% following anti-CD3+CD28); and 30% for the CD8+HLA-DR-memory (37% in medium alone; 29% following stimulation). Similar data were generated in two control subjects (data not shown).
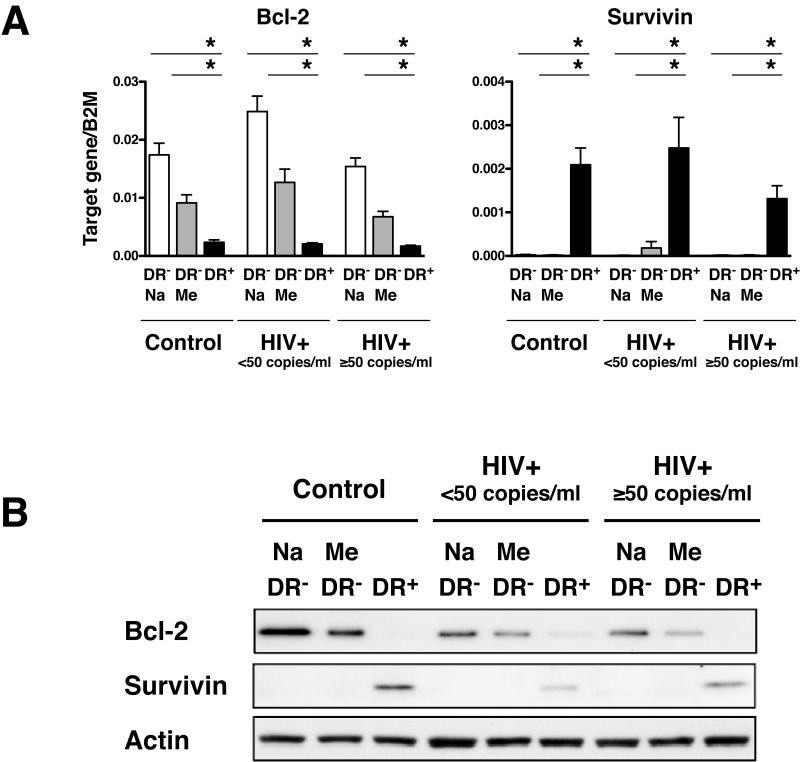
It has been known that in humans, CD45RO+ memory T cells express significantly less Bcl-2 than CD45RO− naive T cells [27]. It has also been reported that low Bcl-2 expression in T cells significantly correlates with higher rates of apoptosis in vitro [27]. Thus, it seemed plausible that pre-existing apoptotic conditions might exist for the CD8+HLA-DR+ cells in vivo that might make them more susceptible to cell death in vitro. To examine this possibility we looked at the expression levels of the anti-apoptotic Bcl-2 and Survivin and the proapoptotic Bax, Bid and Bim in CD8+HLA-DR− naive/memory cells and CD8+HLADR+ cells (Fig.7, Supporting Information Fig.4). As expected, the CD8+HLA-DR+ cells expressed significantly less Bcl-2 than either the CD8+HLA-DR− naive or CD8+HLA-DR− memory cells. An unexpected finding, however, was that Survivin was highly expressed in CD8+HLA-DR+ cells compared to either CD8+HLA-DR-naive or CD8+HLA-DR− memory cells (Fig.7). There were no differences in the levels of expression of the pro-apoptotic genes: Bax, Bid and Bim among the three cell subsets (Supporting Information Fig.4). The levels and patterns of Bcl-2 and Surivivin expression were similar among the cells from healthy control and HIV-infected (both HIV+ <50 and HIV+ ≥50) subjects.
Figure 7. Expression of genes associated with cell survival in CD8+HLA-DR-naive, CD8+HLA-DR− memory and CD8+HLA-DR+ cells.
(A) Expression levels of Bcl-2 and Survivin in FACS-sorted CD8+HLA-DR− naive, CD8+HLA-DR-memory and CD8+HLA-DR+ cells. Mean + SEM values were calculated using cells from control (n=11), HIV+ <50 (n=9), and HIV+ ≥50 (n=7) individuals. The level of statistical significance was determined by the Mann-Whitey test. *P<0.001. (B) Levels of Bcl-2 and Survivin proteins as determined by western blot. Actin was used as a loading control. Results are representative of 3 independent experiments.
Taken together, these results indicate that lower levels of Bcl-2 may explain the higher rates of cell death seen in CD8+HLA-DR+ cells during the in vitro culture. This, however, does not necessarily mean these cells are also prone to death in vivo and, in fact, the higher levels of Survivin in these cells suggest that they may in fact have a survival advantage in vivo that may at least in part explain their increased numbers in states of chronic stimulation such as HIV-1 infection.
CD8+HLA-DR+ cells express higher levels of positive cell cycle regulators than CD8+HLA-DR− cells
To gain more insight into the mechanism(s) governing the activation of CD8+HLA-DR+ cells, the expression of 29 genes involved in cell cycle control was examined in FACS-sorted CD8+HLA-DR− naive, CD8+HLA-DR− memory and CD8+HLA-DR+ cells freshly isolated from PBMCs of healthy control, HIV+ <50 or HIV+ ≥50 individuals using quantitative RT-PCR (Fig.8 and Supporting Information Fig.5). A schematic diagram of the genes examined in the present study is shown in Supporting Information Fig.6.
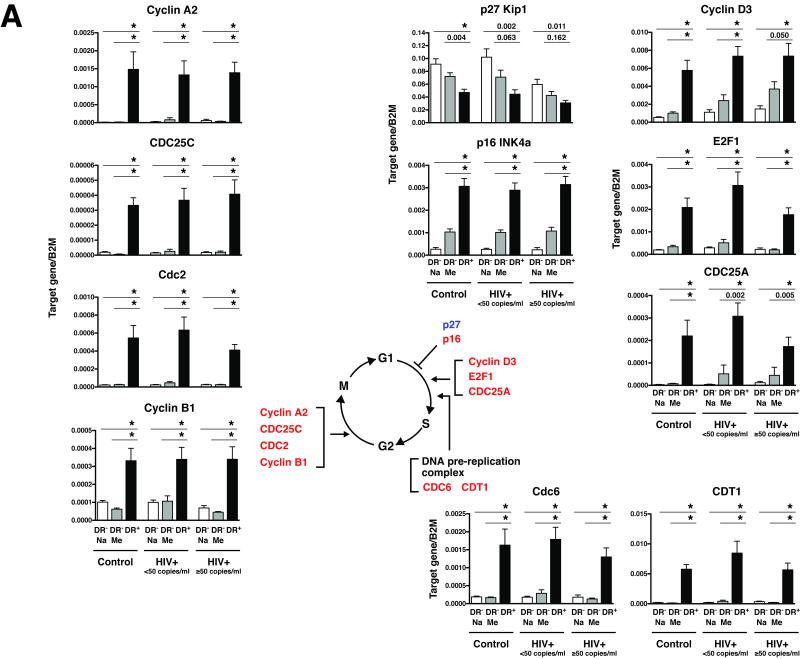
Figure 8. The CD8+HLA-DR+ pool of cells is enriched for cells actively involved in cell cycle progression compared with CD8+HLA-DR− naive and memory cells.
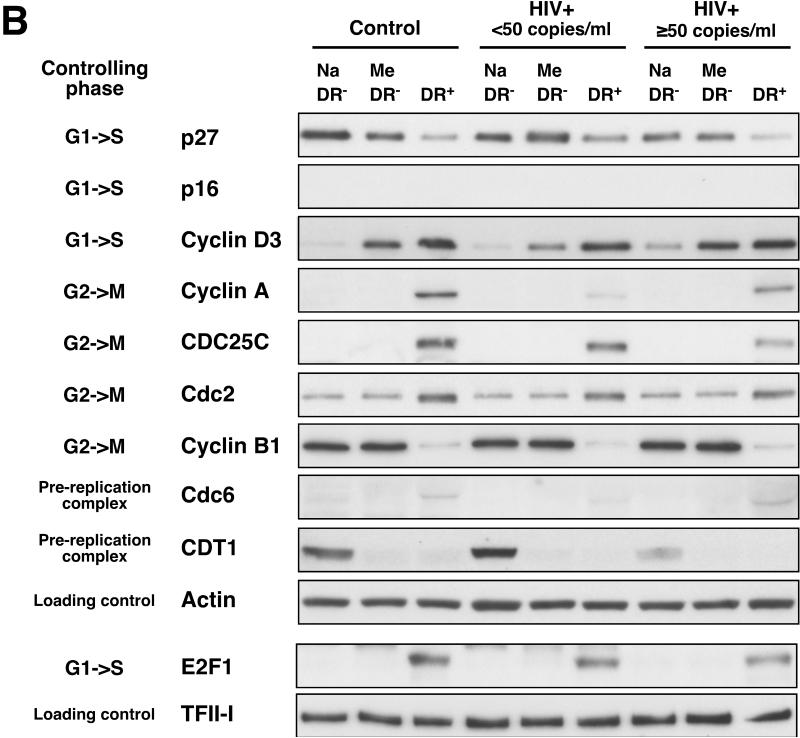
(A) Expression levels of 11 genes involved in cell cycle control were examined in FACS-sorted CD8+HLA-DR− naive, CD8+HLA-DR− memory and CD8+HLA-DR+ cells. The mRNA expression levels were normalized to the value of beta-2 microglobullin (B2M) expression. Mean + SEM values were calculated using cells from control (n=9), HIV+ <50 (n=10), and HIV+ ≥50 (n=9) individuals. Statistical significance was determined by the Mann-Whitey test. *P<0.001. Genes that were found to be upregulated in CD8+HLA-DR+ cells compared with CD8+HLA-DR− naive and CD8+HLA-DR− memory cells are shown in red and those found to be downregulated are in blue. (B) Protein levels of the genes depicted in (A) as determined by western blot. Cell lysates from FACS-sorted CD8+HLA-DR− naive, CD8+HLA-DR− memory and CD8+HLA-DR+ cells were used. In order to achieve adequate levels of proteins, cell lysates cells from 3-4 individuals were pooled (approximately 1 million cells from each individual). Representative patterns from 3 separate experiments are shown. Actin and TFII-I were used as loading controls for whole cell lysate and nuclear fraction, respectively. Images presented are from a 1-minute film exposure.
Overall, levels and patterns of expression of cell cycle regulatory genes in CD8+HLA-DR+ cells were similar among the cells derived from healthy control and HIV-infected individuals (both HIV+ <50 and HIV+ ≥50)(Fig. 8 and Supporting Information Fig.5). Marked differences between the CD8+HLA-DR-naive/memory subsets and the CD8+HLA-DR+ cells were seen in the sets of genes associated with: (1) G1-to-S progression: Cyclin D3, E2F1 and CDC25A; and (2) G2-to-M progression: Cyclin A2, CDC25C, Cdc2 (CDK1) and Cyclin B. Consistent with the upregulation of genes involved in the onset of mitosis, there was also upregulation of two genes involved in formation of the DNA replication preinitiation complex, Cdc6 and CDT1 [28], in CD8+HLA-DR+ cells compared to the other two subsets. Members of a family of cyclin-dependent kinase inhibitors play key roles in the cell cycle control of the G1-to-S phase transition by inhibiting the activities of G1 cyclins/cyclin-dependent kinases (Supporting Information Fig.6) [29]. Approximately 2-fold decreases in p27 Kip1 gene expression were seen in CD8+HLA-DR+ cells, compared to CD8+HLA-DR− naive/memory cells; Conversely, the expression of p16 INK4a gene was up-regulated approximately 3-13 fold in CD8+HLA-DR+ cells.
To confirm the RT-PCR results of cell cycle gene expression at the protein level, immunoblot analyses of whole-cell lysates and nuclear extracts from FACS-sorted CD8+HLA-DR− naive, CD8+HLA-DR− memory and CD8+HLA-DR+ were performed (Fig.8B). In general, the patterns of protein expression mirrored those of gene expression with the exceptions of cyclin B1 and CDT1. In the instance of cyclin B1, despite approximately 3-8 fold increases in cyclin B1 mRNA levels, there was a marked reduction in cyclin B1 protein levels in CD8+HLA-DR+ cells compared to the other two subsets. This likely reflects differences in the rate of degradation of the cyclin B1 protein between the CD8+HLA-DR− naive and CD8+HLA-DR+ cells. Similarly, the levels of CDT1 protein expression did not mirror those of CDT1 mRNA expression. This discordance was seen in CD8+HLA-DR+ cells as well as CD8+HLA-DR− naive and memory cells. Despite the elevated levels of p16 mRNA expression in CD8+HLA-DR+ cells (Fig.8A), very little p16 protein was expressed in these cells (Fig.8B). Expression of p16 protein in the CD8+HLA-DR+ subset was not detected following a 1-min film exposure (Fig.8B) and was only faintly detectable by an approximately 20-min film exposure (data not shown). This result suggests that p16 plays very little, if any, role in the cell cycle regulation of CD8+ T cells. Similarly, we were not able to quantify expression of the CDC25A protein by western blot due to the presence of non-specific hazy bands around the area where the target protein band was expected.
Taken together, these results demonstrate that the peripheral pool of CD8+HLADR+ cells is enriched for cells actively involved in cell cycle progression as opposed to being enriched for cells on the verge of death. Furthermore, they showed CD8+HLA-DR+ T cells are qualitatively indistinguishable between HIV-positive and HIV-negative individuals.
Discussion
The present study has precisely described the characteristics of a population of peripheral blood T cells defined by a surface phenotype of CD8+HLA-DR+CD25−CD69−. These cells are present in increased numbers in patients with HIV infection and have been implicated as a reflection of alterations in immunoregulation as a consequence of HIV. These cells appear to be the result of product of past, as opposed to recent, TCR-engagement and have undergone multiple rounds of division in vivo compared to their HLA-DR− counterparts. Despite no evidence of recent T cell receptor engagement, as reflected by a lack of CD25 expression, these CD8+HLA-DR+ cells exhibited higher levels of spontaneous ex vivo BrdU incorporation; elevated levels of cell cycle regulators involved in G1-to-S progression of the cell cycle (cyclin D3, E2F1 and CDC25A); elevated levels of cell cycle regulators involved in G2-to-M progression of the cell cycle (cyclin A2, CDC25C, Cdc2 (CDK1) and cyclin B1); and increased expression of genes involved in the DNA replication preinitiation complex (Cdc6 and CDT1) when compared to the populations of CD8+HLA-DR− naive or CD8+HLA-DR− memory cells. Thus, we conclude that CD8+HLA-DR+ T cells, while present in higher number in patients with HIV-1 infection, are qualitatively indistinguishable between HIV-positive and HIV-negative individuals.
It has been reported that CD8+ T cells from HIV-1 infected individuals are at an arrested phase of cell cycle and unable to divide [22-24]. Increased expression of G1 cyclin-dependent kinase inhibitors: p16, p21 or p27 are responsible for cell cycle arrest at G1 [29]. In the present study we have examined the levels of p16, p21 and p27 among the CD8+HLA-DR− naive, CD8+HLA-DR− memory and CD8+HLA-DR+ subsets. Our findings of: (1) lower levels of p27 protein; (2) slightly higher but almost undetectable levels of p16 protein; and (3) no detectable amount of p21 protein (data not shown) in CD8+HLA-DR+ cells, lead to a conclusion that there is no sign of G1 arrest in the CD8+HLA-DR+ pool of cells. In addition, CD8+ T cells of HIV-1 infected individuals have been reported to express higher levels of cyclin B1 protein than CD8+ T cells from healthy controls [30]. In our analysis, we did not observe any differences in the levels of cyclin B1 protein expression between subsets of CD8+ T cells from control and HIV-infected individuals. The reason for the discrepancy is unclear.
Cell cycle arrest and apoptosis are two closely related cell processes. Thus, we also conducted a series of experiments examining the levels of apoptosis-related genes and proteins in CD8+ T cell subsets. Through this analyses, we found that while CD8+HLA-DR+ cells expressed lower amounts of Bcl-2 protein, compared to CD8+HLA-DR− naive and CD8+HLA-DR− memory cells, they expressed higher levels of the anti-apoptotic protein Survivin. The lower levels of Bcl-2 likely explain the higher rates of cell death observed when CD8+HLA-DR+ cells were cultured in vitro. The higher levels of Survivin are consistent with a cell population in the G2/M phase of the cell cycle [31]. An inverse relationship, as demonstrated here, between the levels of Bcl-2 and Survivin expression has been reported [32]. Thus, it seems reasonable to conclude that the decreased amounts of Bcl-2 in association with increased levels of Survivin in the CD8+HLA-DR+ cells are a reflection of a dynamic population enriched for mitotic cells rather than a reflection of a senescent population of cells existing in a pre-apoptotic state.
The underlying mechanism(s) leading to the expansion of CD8+HLA-DR+ T cells in HIV-infected patients are likely related to the long-term persistence of antigen in a setting of ongoing inflammation/immune activation with an ongoing immune response that is ineffective in total antigen elimination. The CD8+HLA-DR+ cells in this regard are not a dysfunctional group of cells preventing the elimination of HIV-1 but instead doing their best to control it. The persistence of this active immunologic state is associated with a series of downstream consequences secondary to persistent inflammation and coagulation as reflected in elevated plasma levels of inflammatory cytokines and markers of coagulation and increases in all-cause mortality in those patients with the highest levels of these markers. As the next wave of therapeutic studies in HIV-1 infection aim to eliminate the residual reservoirs of virus, one can predict that success in this area will be accompanied by decreases in the pool of CD8+HLA-DR+ cells.
Methods
Study subjects
The characteristics of the study participants: control (healthy volunteers), aviremic and viremic HIV-infected individuals are shown in Table 1. All HIV-infected patients were enrolled in National Institute of Allergy and Infectious Diseases Institutional Review Board-approved or Washington Hospital Center-approved HIV-1 clinical research protocols. HIV-1 negative controls were recruited through the NIH Blood Bank.
Table 1.
Characteristics of study participants
| Control HIV− |
Aviremic HIV+ <50 copies/ml |
Viremic HIV+ ≥50 copies/ml |
|
|---|---|---|---|
| n=15 | n=19 | n=16 | |
| Age | 51 (33-60) | 45 (32-55) | 42 (31-48) |
| CD4+ T cells (per μl) |
n.d. | 525 (462-638) |
380 (131-606) |
| CD8+ T cells (per μl) |
n.d. | 831 (502-1127) |
853 (647-1431) |
| Plasma HIV-RNA (copies per ml) |
n.a. | <50 | 19,614 (15,047- 131,465) |
Median values with IQR in parentheses.
n.d.: Not determined.
n.a.: Not applicable. CD4+ and CD8+ T cell counts for healthy donors at the NIH blood bank are 542 (388-825) and 272 (187-437), respectively (during 2008-2009).
Isolation of peripheral blood mononuclear cells (PBMC) and separation of CD8+ T cell subsets
PBMCs were separated by Ficoll-Hypaque centrifugation of leukopheresis packs or 60-100 ml of heparinized blood obtained from study subjects. Purified populations of CD8+HLA-DR− naive, CD8+HLA-DR− memory and CD8+HLA-DR+ cells were obtained by means of FACS-sorting with the BD FACSAria II SORP (BD Biosciences) cell sorter as described in Supporting Information Fig.2. Sort purity was usually >99% for CD8+HLA-DR− naive; in excess of 90% for CD8+HLADR− memory; and >80% for CD8+HLA-DR+. In some experiments in which cells needed to be stained with DNA− and RNA-binding fluorescent dyes (7-AAD and pyronin Y: PY, respectively), magnetic microbead-purified cells were used in lieu of FACS-sorted cells. In these instances, purified populations of CD8+HLA-DR-naive, CD8+HLA-DR− memory and CD8+HLA-DR+ cells were obtained from PBMCs by magnetic microbeads as shown in Supporting Information Fig.3. The magnetic microbeads used in this study were purchased from Miltenyi and included: CD8+ T cell isolation Kit (for negative selection of CD8+ T cells, #130-094-156); anti-HLA-DR MicroBeads (#130-046-101); CD45RO MicroBeads (#130-046-001); and CD27 MicroBeads (#130-051-601). The purities of the separated CD8+HLA-DR− naive, CD8+HLA-DR− memory and CD8+HLA-DR+ subsets were typically in excess of 80%, 70% and 80%, respectively. In some experiments, purified CD8+HLA-DR− naive, CD8+HLA-DR− memory and CD8+HLA-DR+ cells were cultured in complete medium consisting of RPMI supplemented with 10% human AB serum (Gemini Bio-Products), 10mM HEPES, and gentamicin (5 μg/ml) at a cell density of 2×10⁶ cells/ml for up to 3 days with/without Dynabeads Human T-Activator CD3/CD28 (Invitrogen) at a bead-to-cell ratio of 1:1).
Flow cytometry
The monoclonal antibodies used were: CD3 FITC, allophycocyanin (APC), APCCy7 (SK7) or Pacific Blue (UCHT1); CD8 peridinin-chlorophyll-protein complex (PerCP)-Cy5.5 or APC-H7 (SK1); CD45RO PE, PE-Cy7 or APC (UCHL1); CD27 FITC (M-T271); HLA-DR PerCP-Cy5.5 (L243); CD25 PE (M-T271); and CD38 PE (HB7); CD69 PE (FN50). HLA-DR PE and APC (LN3) were obtained from eBioscience. The remaining antibodies were obtained from BD Biosciences. The samples for flow cytometric analyses were collected on the BD Canto flow cytometer (BD Biosciences) using FACSDiva software (version 6.1.2). Data were subsequently analyzed using the FlowJo software (version 8.4.1; Tree Star Inc.).
Cytospins and Wright-Giemsa staining
Samples from purified CD8+HLA-DR− and CD8+HLA-DR+ cells were spun onto glass slides using a cytospin apparatus (Cytospin 2; Thermo Shandon) and stained with the Wright-Giemasa stain pack (Fisher Scientific) using the Hematek automated stainer (Siemens). Microphotographics of Wright-Giemsa stained slides were captured at 100× magnification using a BX50 microscope (Olympus) equipped with a ProgRes C5 camera (Jenoptik Laser Optic Systeme) and using the ProgRes Capture Pro software v.2.5. (Jenoptik Laser Optic Systeme).
Cell cycle analysis by simultaneous 7-AAD (DNA)/PY (RNA) staining
Simultaneous DNA/RNA quantification analysis was employed to quantify the fractions of cells in G0, G1, S, and G2+M phases of cell cycle, as previously described [33] with minor modifications. Briefly, 1×10⁶ purified CD8+HLA-DR-naive, CD8+HLA-DR− memory or CD8+HLA-DR+ cells were suspended in 500 μl of nucleic acid staining solution [(NASS) pH 4.8; 0.1M phosphate-citrate buffer, 5mM Disodium EDTA, 0.15M NaCl, 0.5% BSA and 0.02% saponin] containing 10 μg/ml of 7-amino-actinomycin D (7-AAD) and incubated for 20 min at room temperature. After washing the cells with 1xPBS, they were resuspended in 500 μl of NASS containing 10 μg/ml of Actinomycin D and incubated for 5 min at 4 °C. Then, cells were then treated with pyronin Y (PY) for RNA staining by the addition of 5 μl of a 1:10 dilution of the 1 mg/ml PY stock solution for an additional 10 min at 4 °C. All procedures were protected from light. Simultaneous orange (PY, peak emission at 580 nm, FL-2) and red (7-AAD, peak emission at 650 nm, FL-3) fluorescence emissions were recorded with a BD FACS Canto II flow cytometer. The gate was set to remove cell aggregates and doublets using dot plots of the pulse width vs. the area of the 7-AAD (FL-3) signal. In addition, a live cell/dead cell discriminating dye (LIVE/DEAD Fixable Far Red Dead Cell Stain Kit, Invitrogen) was used to discriminate between live and dead cells by flow cytometry. Only live cells (negative for the Live/Dead dye staining) were used for the analyses. The fraction of cells in G0, early G1, late G1, and S+G2/M were determined according to the definitions by Darzynkieeicz et al [34]. According to those definitions, the G0 phase of the cell cycle is defined as a stage when the cells have a 2N DNA content and the lowest RNA amount. Cells in early G1 (often referred as the G1a) phase are defined as cells containing higher levels of RNA than the cells in the G0 phase but less than the cells in the S phase. The late G1 (G1b) phase is defined as the stage when RNA levels are equivalent to those seen in the early S phase prior to DNA synthesis (DNA content still at 2N). Cells in the S-phase are defined as cells having a DNA content greater than 2N but less than 4N and cells in the G2/M phase are defined as having a 4N DNA content.
TREC and TCR-repertoire analysis
Quantification of T-cell receptor excision circles (TREC) was performed by real-time quantitative PCR with an ABI9700 HT system as previously described elsewhere [35]. TCR-repertoire analysis was performed as previously described [36]. TCR-repertoire peak patterns were visualized and analyzed on the ABI PRISM 3130×l Genetic Analyzer (Applied Biosystems, Foster City, CA).
Ex vivo BrdU or EdU labeling
Ex vivo labeling of proliferating CD8+ T cells was carried out by incubating freshly isolated PBMCs with BrdU for 4 hour at 37 °C as previously described [37] or with EdU (Click-iT EdU Flow Cytometry Assay Kit, Invitrogen), according to manufacturer’s protocol. Briefly, 20×106 PBMCs were incubated in 5 ml of complete medium consisting of RPMI supplemented with human AB serum (Cambrex Corp.), 10mM HEPES, and gentamicin (5 μg/ml) at a cell density of 4×10⁶ cells/ml with 10 μM EdU (Component A) for 4 hours at 37 °C. Cells were fixed (Component D: Click-iT fixative) and permeabilized with Saponin-based Permeabilization/Wash buffer (Component E). Cells were then resuspended in 500 μl of Click-iT reaction cocktail (Components G, H, I) and incubated for 30 min in the dark at room temperature. After washing with the Saponin-based Permeabilization/Wash buffer, cells were stained with anti-EdU (Alexa-Fluor 488 azide, Invitrogen) for 15 min in the dark at room temperature. Cell surface staining of the BrdU-labeled cells was then performed using anti-CD3 (APC), CD8 (PerCP-Cy5.5), HLA-DR (PE) antibodies.
RT-PCR analyses
Total RNA was extracted using the RNeasy Mini Kit (QIAGEN). Synthesis of cDNA and pre-amplification (10 cycles) of cDNA products were conducted with the TaqMan PreAmp Master Mix (Applied Biosystems) according to the manufacturer’s protocol. Real-time PCR was performed using the 7900HT Fast Real-Time PCR System (Applied Biosystems). TaqMan primer/probe sets used in the study are listed in Supporting Information Table 1.
Western blotting
Whole cell lysates were prepared with RIPA lysis buffer containing 50mM Tris-HCl pH7.5, 150mM NaCl, 1% Nonidet P-40, 0.1% SDS, 0.5% Sodium Deoxycholate supplemented with protease inhibitor and phosphatase inhibitor cocktails (Pierce) before use. The nuclear fractions were isolated by using NEPER Nuclear and Cytoplasmic Extraction Reagents (Pierce). Ten micrograms of protein were loaded per lane, separated on 4-12% NuPAGE Novex Bis-Tris Gel (Invitrogen), and transferred to a nitrocellulose membrane. The detection of target proteins was performed with the use of the alkaline phosphatase-based WesternBreeze Chemiluminescent kit (Invitrogen). Antibodies used in the western blot are listed in Supporting Information Table 2. After detection of the target proteins, the membranes were stripped and reprobed with mouse anti-beta-Actin antibody (ab8226; Abcam) or anti-TFII-I antibody (4562; Cell Signaling) to assess loading equivalency.
Statistical analysis
Statistical analyses were performed with Prism software (version 5.0d, GraphPad Software, Inc.). Significant differences were determined when comparing two groups by using the two-tailed unpaired nonparametric Mann-Whitney test.
Supplementary Material
Acknowledgements
The authors would like to thank all study participants. We also would like to thank Jeanette Higgins, Valerie Hill and Virginia Simpson for assistance with the Wright-Giemsa staining, Cathy Watkins and Cathi Yeager for assistance on the flow cytometry analyses, Dr. Douglas Kuhns and Dara Riva for assistance on the photomicrographs, and Dr. Hong Kiang for assistance on cytospins. This work was funded through the intramural research program of the National Institute of Allergy and Infectious Diseases of the National Institutes of Health (Bethesda, Maryland) and in part with federal funds from the National Cancer Institute, National Institutes of Health, under Contract No. HHSN261200800001E. The content of this publication does not necessarily reflect the views or policies of the Department of Health and Human Services, nor does mention of trade names, commercial products, or organizations imply endorsement by the U.S. Government.
Footnotes
Conflict-of-interest disclosure: The authors declare no financial or commercial conflict interest.
References
- 1.Grossman Z, Meier-Schellersheim M, Paul WE, Picker LJ. Pathogenesis of HIV infection: what the virus spares is as important as what it destroys. Nat. Med. 2006;12:289–295. doi: 10.1038/nm1380. [DOI] [PubMed] [Google Scholar]
- 2.Lane HC, Masur H, Gelmann EP, Longo DL, Steis RG, Chused T, Whalen G, et al. Correlation between immunologic function and clinical subpopulations of patients with the acquired immune deficiency syndrome. Am. J. Med. 1985;78:417–422. doi: 10.1016/0002-9343(85)90332-8. [DOI] [PubMed] [Google Scholar]
- 3.Phillips AN, Sabin CA, Elford J, Bofill M, Lee CA, Janossy G. CD8 lymphocyte counts and serum immunoglobulin A levels early in HIV infection as predictors of CD4 lymphocyte depletion during 8 years of follow-up. AIDS. 1993;7:975–980. doi: 10.1097/00002030-199307000-00011. [DOI] [PubMed] [Google Scholar]
- 4.Phillips AN, Neaton J, Lundgren JD. The role of HIV in serious diseases other than AIDS. AIDS. 2008;22:2409–2418. doi: 10.1097/QAD.0b013e3283174636. [DOI] [PMC free article] [PubMed] [Google Scholar]
- 5.Monforte A, Abrams D, Pradier C, Weber R, Reiss P, Bonnet F, Kirk O, et al. HIV-induced immunodeficiency and mortality from AIDS-defining and non-AIDS-defining malignancies. AIDS. 2008;22:2143–2153. doi: 10.1097/QAD.0b013e3283112b77. [DOI] [PMC free article] [PubMed] [Google Scholar]
- 6.Weber R, Sabin CA, Friis-Moller N, Reiss P, El-Sadr WM, Kirk O, Dabis F, et al. Liver-related deaths in persons infected with the human immunodeficiency virus: the D:A:D study. Arch. Intern. Med. 2006;166:1632–1641. doi: 10.1001/archinte.166.15.1632. [DOI] [PubMed] [Google Scholar]
- 7.Kuller LH, Tracy R, Belloso W, De Wit S, Drummond F, Lane HC, Ledergerber B, et al. Inflammatory and coagulation biomarkers and mortality in patients with HIV infection. PLoS Med. 2008;5:e203. doi: 10.1371/journal.pmed.0050203. [DOI] [PMC free article] [PubMed] [Google Scholar]
- 8.Sandler NG, Wand H, Roque A, Law M, Nason MC, Nixon DE, Pedersen C, et al. Plasma levels of soluble CD14 independently predict mortality in HIV infection. J. Infect. Dis. 2011;203:780–790. doi: 10.1093/infdis/jiq118. [DOI] [PMC free article] [PubMed] [Google Scholar]
- 9.Giorgi JV, Detels R. T-cell subset alterations in HIV-infected homosexual men: NIAID Multicenter AIDS cohort study. Clin. Immunol. Immunopathol. 1989;52:10–18. doi: 10.1016/0090-1229(89)90188-8. [DOI] [PubMed] [Google Scholar]
- 10.Kestens L, Vanham G, Gigase P, Young G, Hannet I, Vanlangendonck F, Hulstaert F, Bach BA. Expression of activation antigens, HLA-DR and CD38, on CD8 lymphocytes during HIV-1 infection. AIDS. 1992;6:793–797. doi: 10.1097/00002030-199208000-00004. [DOI] [PubMed] [Google Scholar]
- 11.Giorgi JV, Liu Z, Hultin LE, Cumberland WG, Hennessey K, Detels R. Elevated levels of CD38+ CD8+ T cells in HIV infection add to the prognostic value of low CD4+ T cell levels: results of 6 years of follow-up. The Los Angeles Center, Multicenter AIDS Cohort Study. J. Acquir. Immune. Defic. Syndr. 1993;6:904–912. [PubMed] [Google Scholar]
- 12.Giorgi JV, Hultin LE, McKeating JA, Johnson TD, Owens B, Jacobson LP, Shih R, et al. Shorter survival in advanced human immunodeficiency virus type 1 infection is more closely associated with T lymphocyte activation than with plasma virus burden or virus chemokine coreceptor usage. J. Infect. Dis. 1999;179:859–870. doi: 10.1086/314660. [DOI] [PubMed] [Google Scholar]
- 13.Hazenberg MD, Otto SA, van Benthem BH, Roos MT, Coutinho RA, Lange JM, Hamann D, Prins M, Miedema F. Persistent immune activation in HIV-1 infection is associated with progression to AIDS. AIDS. 2003;17:1881–1888. doi: 10.1097/00002030-200309050-00006. [DOI] [PubMed] [Google Scholar]
- 14.Hara T, Hisano S, Mizuno Y, Hatae K, Kurokawa M, Ueda K, Sakaguchi T, et al. Systemic lupus erythematosus of childhood onset: correlation between T cells expressing early and late activation antigens and disease activity. Eur. J. Pediatr. 1989;148:626–629. doi: 10.1007/BF00441516. [DOI] [PubMed] [Google Scholar]
- 15.Ishihara K, Yoshimura M, Nakao H, Kanakura Y, Kanayama Y, Matsuzawa Y. T cell abnormalities in mixed connective tissue disease complicated with Klinefelter’s syndrome. Intern. Med. 1994;33:714–717. doi: 10.2169/internalmedicine.33.714. [DOI] [PubMed] [Google Scholar]
- 16.Scolozzi R, Boccafogli A, Tola MR, Vicentini L, Camerani A, Degani D, Granieri E, et al. T-cell phenotypic profiles in the cerebrospinal fluid and peripheral blood of multiple sclerosis patients. J. Neurol. Sci. 1992;108:93–98. doi: 10.1016/0022-510x(92)90193-o. [DOI] [PubMed] [Google Scholar]
- 17.Yoshiike T, Aikawa Y, Wongwaisayawan H, Ogawa H. HLADR antigen expression on peripheral T cell subsets in pityriasis rosea and herpes zoster. Dermatologica. 1991;182:160–163. doi: 10.1159/000247769. [DOI] [PubMed] [Google Scholar]
- 18.Tomita T, Kashiwagi N, Shimaoka Y, Ikawa T, Tanabe M, Nakagawa S, Kawamura S, et al. Phenotypic characteristics of bone marrow cells in patients with rheumatoid arthritis. J. Rheumatol. 1994;21:1608–1614. [PubMed] [Google Scholar]
- 19.Ikeda M, Watanabe Y, Kitahara S, Inouye T. Distinctive increases in HLA-DR+ and CD8+57+ lymphocyte subsets in Wegener’s granulomatosis. Int. Arch. Allergy. Immunol. 1993;102:205–208. doi: 10.1159/000236574. [DOI] [PubMed] [Google Scholar]
- 20.Rea IM, McNerlan SE, Alexander HD. CD69, CD25, and HLA-DR activation antigen expression on CD3+ lymphocytes and relationship to serum TNF-alpha, IFN-gamma, and sIL-2R levels in aging. Ex.p Gerontol. 1999;34:79–93. doi: 10.1016/s0531-5565(98)00058-8. [DOI] [PubMed] [Google Scholar]
- 21.Meyaard L, Otto SA, Jonker RR, Mijnster MJ, Keet RP, Miedema F. Programmed death of T cells in HIV-1 infection. Science. 1992;257:217–219. doi: 10.1126/science.1352911. [DOI] [PubMed] [Google Scholar]
- 22.Gougeon ML, Garcia S, Heeney J, Tschopp R, Lecoeur H, Guetard D, Rame V, et al. Programmed cell death in AIDS-related HIV and SIV infections. AIDS Res. Hum. Retroviruses. 1993;9:553–563. doi: 10.1089/aid.1993.9.553. [DOI] [PubMed] [Google Scholar]
- 23.Lewis DE, Tang DS, Adu-Oppong A, Schober W, Rodgers JR. Anergy and apoptosis in CD8+ T cells from HIV-infected persons. J. Immunol. 1994;153:412–420. [PubMed] [Google Scholar]
- 24.Mahalingam M, Pozniak A, McManus TJ, Vergani D, Peakman M. Cell cycling in HIV infection: analysis of in vivo activated lymphocytes. Clin. Exp. Immunol. 1995;102:481–486. doi: 10.1111/j.1365-2249.1995.tb03841.x. [DOI] [PMC free article] [PubMed] [Google Scholar]
- 25.Catalfamo M, Di Mascio M, Hu Z, Srinivasula S, Thaker V, Adelsberger J, Rupert A, et al. HIV infection-associated immune activation occurs by two distinct pathways that differentially affect CD4 and CD8 T cells. Proc. Natl. Acad. Sci. U S A. 2008;105:19851–19856. doi: 10.1073/pnas.0810032105. [DOI] [PMC free article] [PubMed] [Google Scholar]
- 26.Sieg SF, Rodriguez B, Asaad R, Jiang W, Bazdar DA, Lederman MM. Peripheral S-phase T cells in HIV disease have a central memory phenotype and rarely have evidence of recent T cell receptor engagement. J. Infect. Dis. 2005;192:62–70. doi: 10.1086/430620. [DOI] [PubMed] [Google Scholar]
- 27.Akbar AN, Borthwick N, Salmon M, Gombert W, Bofill M, Shamsadeen N, Pilling D, et al. The significance of low bcl-2 expression by CD45RO T cells in normal individuals and patients with acute viral infections. The role of apoptosis in T cell memory. J. Exp. Med. 1993;178:427–438. doi: 10.1084/jem.178.2.427. [DOI] [PMC free article] [PubMed] [Google Scholar]
- 28.Blow JJ, Dutta A. Preventing re-replication of chromosomal DNA. Nat. Rev. Mol. Cell Biol. 2005;6:476–486. doi: 10.1038/nrm1663. [DOI] [PMC free article] [PubMed] [Google Scholar]
- 29.Sherr CJ, Roberts JM. CDK inhibitors: positive and negative regulators of G1-phase progression. Genes Dev. 1999;13:1501–1512. doi: 10.1101/gad.13.12.1501. [DOI] [PubMed] [Google Scholar]
- 30.Piedimonte G, Corsi D, Paiardini M, Cannavo G, Ientile R, Picerno I, Montroni M, et al. Unscheduled cyclin B expression and p34 cdc2 activation in T lymphocytes from HIV-infected patients. AIDS. 1999;13:1159–1164. doi: 10.1097/00002030-199907090-00003. [DOI] [PubMed] [Google Scholar]
- 31.Li F, Ambrosini G, Chu EY, Plescia J, Tognin S, Marchisio PC, Altieri DC. Control of apoptosis and mitotic spindle checkpoint by survivin. Nature. 1998;396:580–584. doi: 10.1038/25141. [DOI] [PubMed] [Google Scholar]
- 32.Konno R, Yamakawa H, Utsunomiya H, Ito K, Sato S, Yajima A. Expression of survivin and Bcl-2 in the normal human endometrium. Mol. Hum. Reprod. 2000;6:529–534. doi: 10.1093/molehr/6.6.529. [DOI] [PubMed] [Google Scholar]
- 33.Toba K, Winton EF, Koike T, Shibata A. Simultaneous three-color analysis of the surface phenotype and DNA-RNA quantitation using 7-amino-actinomycin D and pyronin Y. J. Immunol. Methods. 1995;182:193–207. doi: 10.1016/0022-1759(95)00050-k. [DOI] [PubMed] [Google Scholar]
- 34.Darzynkiewicz Z, Traganos F, Melamed MR. New cell cycle compartments identified by multiparameter flow cytometry. Cytometry. 1980;1:98–108. doi: 10.1002/cyto.990010203. [DOI] [PubMed] [Google Scholar]
- 35.McFarland RD, Douek DC, Koup RA, Picker LJ. Identification of a human recent thymic emigrant phenotype. Proc. Natl. Acad. Sci. U S A. 2000;97:4215–4220. doi: 10.1073/pnas.070061597. [DOI] [PMC free article] [PubMed] [Google Scholar]
- 36.Connors M, Kovacs JA, Krevat S, Gea-Banacloche JC, Sneller MC, Flanigan M, Metcalf JA, et al. HIV infection induces changes in CD4+ T-cell phenotype and depletions within the CD4+ T-cell repertoire that are not immediately restored by antiviral or immune-based therapies. Nat. Med. 1997;3:533–540. doi: 10.1038/nm0597-533. [DOI] [PubMed] [Google Scholar]
- 37.Lempicki RA, Kovacs JA, Baseler MW, Adelsberger JW, Dewar RL, Natarajan V, Bosche MC, et al. Impact of HIV-1 infection and highly active antiretroviral therapy on the kinetics of CD4+ and CD8+ T cell turnover in HIV-infected patients. Proc. Natl. Acad. Sci. U S A. 2000;97:13778–13783. doi: 10.1073/pnas.250472097. [DOI] [PMC free article] [PubMed] [Google Scholar]
Associated Data
This section collects any data citations, data availability statements, or supplementary materials included in this article.


