

Abstract
Background
This study investigated the possible association between common and potentially functional polymorphisms of antioxidant enzymes and metabolic abnormalities in patients with schizophrenia.
Methods
The possible associations of the glutathione S-transferase (GST) M1 null and GSTT1 null genotypes, and the superoxide dismutase 2 (SOD2) Val16Ala polymorphism with the risks of being overweight and having metabolic syndrome were examined using a logistic regression analysis in 154 schizophrenic Japanese patients and 203 controls.
Results
Among smokers with schizophrenia, the risks of being overweight and having decreased high-density lipoprotein cholesterol were significantly higher in those with the GSTM1 null genotype than in those with the present genotype (odds ratio 3.20 and 3.15, P=0.03 and P=0.04, respectively), while among nonsmokers with schizophrenia, the risk of an abnormal waist circumference was lower in those with the GSTM1 null genotype (odds ratio 0.34, P=0.04). The risk of a decreased high-density lipoprotein cholesterol level was significantly higher in patients with the combined GSTM1 null and GSTT1 present genotypes than in those with the present genotypes of both genes (odds ratio 3.60, P<0.01). The SOD2 Val16Ala polymorphism was not associated with risk of metabolic abnormalities in either group.
Conclusion
The present study suggests that the GSTM1 null genotype, in combination with smoking status or GSTT1 genotype, might be associated with the metabolic abnormalities in patients with schizophrenia.
Keywords: schizophrenia, metabolic syndrome, oxidative stress, glutathione S-transferase, superoxide dismutase 2, polymorphism
Introduction
People with schizophrenia tend to have a shorter life expectancy than the general population, not only due to their high suicide rate, but also due to cardiovascular events.1,2 People with schizophrenia are more likely to have metabolic abnormalities, including obesity, glucose intolerance, hypertension, dyslipidemia, and metabolic syndrome than the general population.2,3 These cardiometabolic risk factors are attributable to atypical antipsychotic-related weight gain and an unhealthy lifestyle, including dietary abnormalities, sedentary behavior, and a high prevalence of smoking.1,2,4–7
Among the risk factors for metabolic syndrome in patients with schizophrenia, antipsychotic treatment and a longer duration of disease course are associated with a higher risk of developing metabolic syndrome;8–12 however, drug-naïve individuals with first-episode psychosis are also reported to have metabolic abnormalities.13 Therefore, innate factors, such as genetic predisposition, may play a role in determining the risk of metabolic dysregulation in patients with schizophrenia, and many researchers have made an attempt to identify these genetic risk factors.14 Consequently, there is growing evidence that genetic factors are, at least in part, responsible for the metabolic abnormalities in patients with schizophrenia.14 To identify these genetic factors, previous studies have been focused on target genes implicated in the antipsychotic action of drugs and weight regulation,14 but identification of numerous novel susceptibility genes is now ongoing, and can provide a better understanding of these conditions.
The major components of metabolic syndrome are generally agreed to include central obesity, hypertension, dyslipidemia, and glucose intolerance or insulin resistance. Commonly used definitions for metabolic syndrome include the National Cholesterol Education Program Adult Treatment Panel (NCEP ATP III) metabolic syndrome definition15 and the adapted NCEP ATP III (ATP III-A) definition.16 Because the small physique of Asians makes it difficult to use the same waist circumference criteria for those of European descent,17 modified criteria for waist circumference have been proposed for Asians in the ATP III-A definition.18 To be diagnosed with metabolic syndrome according to the ATP III-A definition for Asians, individuals should meet or receive treatment for at least three of the following five criteria: an abnormal waist circumference (males ≥90 cm, females ≥80 cm), elevated blood pressure (≥130/85 mmHg), a decreased high-density lipoprotein level (HDL; males <40 mg/dL, females <50 mg/dL), an elevated triglyceride level (≥150 mg/dL), and an elevated fasting glucose level (≥100 mg/dL).18
Recently, there has been increasing interest in the role of free radicals and oxidative stress in the pathogenesis of obesity and metabolic syndrome in the general population.19–21 Oxidative damage and inflammation are present at the onset of obesity.20 The harmful effects of free radicals, primarily reactive oxygen species, and/or reactive nitrogen species, have been implicated in the physiopathology of obesity, hypertension, endothelial dysfunction, and metabolic syndrome, suggesting that oxidative stress is a mechanism underlying the dysfunctional metabolism observed in obese subjects.19–21 For example, smoking and obesity are associated with low HDL cholesterol levels,22 and oxidative stress modifies specific amino acids in apolipoprotein A-I, a major component of HDL, resulting in a decrease in large HDL particles, such as HDL2.23
The glutathione S-transferase (GST) supergene family consists of phase 2 detoxifying enzymes and plays a crucial role in antioxidant defense mechanisms by detoxifying electrophilic xenobiotics and inactivating a variety of endogenous byproducts of oxidative stress.24–26 The most extensively studied GST polymorphisms occur in two isozymes found in the cytosol, ie, mu (GSTM1) and theta (GSTT1).24,26 The human GSTM1 gene contains eight exons located at 1p13.3, and the most common polymorphism in GSTM1 is a deletion of the whole gene (“null” genotype) that results in a lack of functional activity of the enzyme.24,26 The human GSTT1 gene contains four exons located at 22q11.2, and a homozygous deletion in GSTT1 (“null” genotype) has also been reported.24,26 These two common deletion polymorphisms of GSTM1 and GSTT1 are reported to be associated with an increased susceptibility to certain oxidative stress-related diseases.24,26–30 Meanwhile, superoxide dismutase 2 (SOD2, also known as manganese superoxide dismutase) converts superoxide to hydrogen peroxide and molecular oxygen in the mitochondrial matrix, representing the first line of cellular defense against oxidative stress.31 The SOD2 gene contains five exons and spans almost 20 kb located at 6p25. The T to C nucleotide polymorphism (rs4880, Val16Ala) has been identified in exon 2 of the human SOD2 gene, and the Ala variant is more efficiently imported into the mitochondria than the Val variant.32 Several studies have revealed that this SOD2 polymorphism is associated with cardiovascular and metabolic diseases in the general population.28,29,33
An increase in systemic oxidative stress in patients with schizophrenia has been reported, which may be due to the pathophysiology of schizophrenia, the sequelae of the therapeutic drugs used to treat schizophrenia, and/or the high prevalence of smoking among such individuals.34–36 Therefore, it is possible that the influence of the GST and SOD2 polymorphisms on development of metabolic abnormalities is more pronounced in patients with schizophrenia, especially under high oxidative stress conditions (eg, smokers). However, only one group has investigated the association between GST polymorphisms and olanzapine-induced weight gain,37 and there are presently no data regarding the effects of GST polymorphisms in association with other patient characteristics on the development of metabolic abnormalities in patients with schizophrenia. Meanwhile, no study has been published regarding the relationship between SOD2 polymorphisms and metabolic abnormalities in patients with schizophrenia.
The present study investigated the possible associations between the most common and potentially functional polymorphisms in three antioxidant enzyme genes, ie, GSTM1, GSTT1, and SOD2, and the risks of being overweight and having metabolic syndrome in Japanese patients with schizophrenia in comparison with the general population, while also paying careful attention to associations with other patient characteristics.
Materials and methods
Subjects
A cross-sectional, case-control analysis was conducted in 154 Japanese patients with schizophrenia and 203 Japanese controls. The patients with schizophrenia were recruited from the participants of a previous study.38 All patients were diagnosed with schizophrenia based on Diagnostic and Statistical Manual of Mental Disorders Fourth Edition Text Revision (DSM-IV-TR) criteria, and had been treated with antipsychotic medication for at least 3 months at Hirosaki University Hospital in Japan prior to enrollment in the study. The diagnoses of the patients were recorded from their medical charts. Exclusion criteria included psychosis due to general medical conditions, substance-related psychosis, and mood disorders with psychotic features. Age-matched and sex-matched controls were recruited from participants in a 2-day health screening program conducted at the Japanese Red Cross Kumamoto Hospital Health Care Center. This study was approved by the institutional review boards of the Faculty of Life Sciences, Kumamoto University, the Hirosaki University School of Medicine, and the Japanese Red Cross Kumamoto Hospital Health Care Center. Informed consent, including a statement regarding the privacy policy, was obtained in writing from each volunteer before entry into the study.
Clinical assessments
The height and weight of the subjects were measured, and the body mass index (BMI) was calculated. Overweight was diagnosed as a BMI ≥25 kg/m2. Presence of the metabolic syndrome was assessed based on the definitions proposed by the NCEP ATP III for Asians.18 The waist circumference was measured at the umbilical level in a standing position, to the nearest 0.1 cm, by a technician in the morning. Trained technicians measured blood pressure using a standard mercury sphygmomanometer on the right arm of seated participants after a 5-minute rest. HDL cholesterol and triglyceride levels were measured using standard enzymatic methods with kits (MetaboLead HDL-C and Determiner L TG II, respectively) from Kyowa Medex Co, Ltd (Tokyo, Japan) with an automated analyzer (Labospect 008; Hitachi Ltd, Tokyo, Japan). Fasting blood glucose levels were also measured using a glucose oxidase-immobilized enzyme membrane-hydrogen peroxide electrode method with glucose analyzers (GA-1170 and GA-1171; Arkray, Inc, Kyoto, Japan). Information on the subjects’ demographics (age, sex, smoking status) and medical history were obtained from their medical records and by face-to-face interviews with medical staff members using a structured questionnaire.
Genotyping
Genomic DNA was extracted from whole blood using a DNA purification kit (Qiagen, Flexi Gene DNA kit; Hilden, Germany). Null genotypes of GSTM1 and GSTT1 were determined using polymerase chain reaction (PCR) amplification based on the presence or absence of a PCR amplification product according to the method of Watanabe et al,39 with minor modifications. Briefly, null genotyping of GSTT1 and GSTM1 was determined using agarose electrophoresis. The GSTM1 and GSTT1 genes were amplified via PCR in the same reaction mixture described herein containing specific primer sets for GSTM1 and GSTT1. The primer sequences for GSTM1 were 5′-GAACTCCCTGAAAAGCTAAAGC-3′ (forward primer) and 5′-GTTGGGCTCAAATATACG-GTGG-3′ (reverse primer), while those for GSTT1 were 5′-TTCCTTACTGGTCCTCACATCTC-3′ (forward primer) and 5′-TCACCGGATCATGGCCAGCA-3′ (reverse primer), and those for β-globin as an internal control were 5′-CAACT-TCATCCACGTTCACC-3′ (forward primer) and 5′-GAA-GAGCCAAGGACAGGTAC-3′ (reverse primer). The PCR analysis was performed using 30 cycles of 30 seconds at 94°C (degeneration), 30 seconds at 60°C (annealing), and 30 seconds at 72°C (elongation). The amplified DNA fragments were electrophoresed in 3% agarose gel, stained with ethidium bromide, and visualized under ultraviolet illumination. When the PCR products exhibited 0.23-kb or 0.46-kb bands, they were designated as wild-type GSTM1 or GSTT1 genes, respectively, and when no amplified bands were observed, they were designated as the null genotype (Figure 1). SOD2 c.47T>C (Val16Ala, rs4880) was genotyped by real-time PCR with 5′-nuclease allele discrimination assays (Step One Plus Real-Time PCR system version 2.1; Applied Biosystems, Tokyo, Japan). Genotyping for rs4880 was done using commercially available assays (assay ID: C_8709053_10). The reagents were purchased from Applied Biosystems, and genotyping was performed according to the manufacturer’s protocol. To ensure genotyping quality, we included DNA samples as internal controls, hidden samples of a known genotype, and negative controls (water). Regarding GSTM1 and GSTT1, the genotypes were classified as follows: subjects with homozygous deleted alleles (ie, the “null” genotype) and others (ie, the “present” genotype). Regarding SOD2 c.47T>C (Val16Ala), the genotypes were classified into three groups: homozygous for the SOD2 T allele (ie, the Val/Val genotype), heterozygous for the T and C alleles (ie, the Val/Ala genotype), and homozygous for the C allele (ie, the Ala/Ala genotype).
Figure 1.
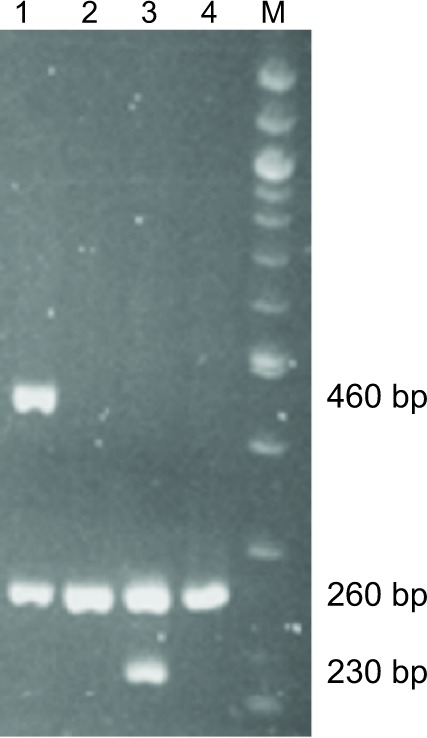
Genotyping of GSTM1 and GSTT1 using polymerase chain reaction. M, 100 bp DNA marker. Lane 1: GSTT1 present (460 bp) genotype and β-globin (260 bp). Lane 2: GSTT1 null genotype and β-globin (260 bp). Lane 3: GSTM1 present genotype (230 bp) and β-globin as an internal control (260 bp). Lane 4: GSTM1 null genotype and β-globin (260 bp). Present: subjects with homozygous or heterozygous wild-type allele(s). Null: subjects with homozygous deleted alleles.
Statistical analysis
The data are presented as the mean ± standard deviation or number (%) of subjects. All continuous variables were analyzed using the Student’s t-test. Categorical variables were compared by Fisher’s exact test. The strength of the association between each genotype and the risk of being overweight, and that of having metabolic syndrome and abnormalities for each component of the metabolic syndrome was measured as odds ratios (ORs) with 95% confidence intervals (CIs) in patients with schizophrenia and the age-matched and sex-matched controls. The ORs were calculated via a logistic regression analysis that included all of the genotypes, patient categorical factors (ie, sex, smoking status, treatment with or without atypical antipsychotics, or inpatient/outpatient status), interactions between genotypes, and those between the genotype and each patient’s factors as fixed effects, and age as a random effect. The use of atypical antipsychotics with a particular propensity to induce weight gain, ie, clozapine, olanzapine, risperidone, quetiapine, or perospirone, was included as a fixed effect. A value of P<0.05 was considered to be statistically significant. These statistical analyses were performed using the Statistical Package for the Social Sciences (SPSS) software package for Windows (version 17.0; IBM Japan Ltd, Tokyo, Japan). The statistical power of the associations between the genotypes and the risk of metabolic abnormalities was also calculated at a significance (alpha) level of 0.05 (two-tailed) and the adequate effect size (eg, an OR of 2.0 or 3.0) based on the sample size of this study and the observed frequencies of the genotypes and metabolic abnormalities using the SPSS Sample Power software program (version 3.0; IBM Japan Ltd).
Results
Study population
The demographic and clinical characteristics of the study population are shown in Table 1. The mean (± standard deviation) age was 50.2±15.3 years and 52.4±9.0 years (P=0.124), and the number (%) of females was 74 (48.1%) and 86 (42.4%) in the patients with schizophrenia and controls, respectively (P=0.334). Patients with schizophrenia had significantly greater body weight and a higher BMI than controls (P=0.011 and P<0.0001, respectively). A total of 72 (46.8%) and 49 (24.1%) patients with schizophrenia and controls, respectively, were overweight (P<0.0001). The prevalence of metabolic syndrome was 34 (22.1%) and 15 (7.4%) in patients with schizophrenia and controls, respectively (P<0.0001). Waist circumference, systolic/diastolic blood pressure, and triglyceride levels were all significantly higher in patients with schizophrenia than in controls (P=0.003, P<0.0001, and P=0.029, respectively), whereas HDL cholesterol was lower in patients with schizophrenia (P<0.0001). Fasting glucose levels tended to be higher in patients with schizophrenia, although the difference did not reach statistical significance (P=0.070). The number of smokers was significantly greater in patients with schizophrenia than in controls (P<0.0001). A total of 112 (72.7%) patients with schizophrenia were receiving atypical antipsychotics. Among them, 64, 32, 20, nine, and four were being treated with risperidone, olanzapine, quetiapine, perospirone, and aripiprazole, respectively. None of the patients was being treated with clozapine. Seventy patients were being treated with typical antipsychotics, including haloperidol (n=29), levomepromazine (n=25), chlorpromazine (n=19), sulpiride (n=6), and bromperidol (n=5). The patients had all been treated with either a single agent or a combination of these atypical and/or typical antipsychotic agents for at least 3 months prior to the analysis.
Table 1.
Demographic and clinical characteristics of study subjects
| Schizophrenia patients (n=154) | Controls (n=203) | P | |
|---|---|---|---|
| Age (years) | 50.2±15.3 | 52.4±9.0 | 0.124 |
| Male | 80 (51.9%) | 117 (57.6%) | 0.334 |
| Height (cm) | 161.7±8.4 | 162.9±8.9 | 0.205 |
| Weight (kg) | 65.1±13.6 | 61.7±10.9 | 0.011 |
| BMI (kg/m2) | 24.8±4.1 | 23.2±3.2 | <0.0001 |
| Overweight | 72 (46.8%) | 49 (24.1%) | <0.0001 |
| Metabolic syndrome | 34 (22.1%) | 15 (7.4%) | <0.0001 |
| Waist circumference (cm) | 86.2±11.9 | 82.8±8.1 | 0.003 |
| Systolic blood pressure (mmHg) | 125.9±16.5 | 117.2±16.2 | <0.0001 |
| Diastolic blood pressure (mmHg) | 76.8±12.0 | 72.9±11.0 | 0.001 |
| High-density lipoprotein (mg/dL) | 52.1±14.6 | 65.6±17.2 | <0.0001 |
| Triglycerides (mg/dL) | 149.0±138.7 | 121.0±88.1 | 0.029 |
| Fasting glucose (mg/dL) | 103.0±32.4 | 96.3±20.1 | 0.070 |
| Smoker | 78 (50.6%) | 43 (21.2%) | <0.0001 |
| Outpatient | 93 (60.4%) | – | – |
| Treatment with AAP(s) | 112 (72.7%) | – | – |
Note: Data expressed as the mean ± standard deviation or number (%).
Abbreviations: AAP(s), atypical antipsychotic(s) except for aripiprazole; BMI, body mass index.
Allele and genotype frequencies in patients with schizophrenia and controls
The numbers (%) of patients with the GSTM1 null genotype were 77 (50.0%) and 99 (48.8%) in the group with schizophrenia and the control group, respectively; those of the GSTT1 null genotype were 68 (44.2%) and 99 (48.8%), respectively. The frequency (%) of the GSTM1/GSTT1 double null genotype was 40 (26.0%) and 45 (22.2%) in patients with schizophrenia and controls, respectively. The allele frequencies of the SOD2 Val16Ala polymorphism were 14.3% and 13.3% in patients with schizophrenia and controls, respectively. The numbers (%) of SOD2 Ala/Ala and Val/Ala genotypes were three (1.9%) and 38 (24.7%), respectively, in patients with schizophrenia, and were four (2.0%) and 46 (22.3%), respectively, in controls. The observed SOD2 genotype frequencies were consistent with the Hardy-Weinberg equilibrium (P>0.05). The genotype frequencies of GSTM1, GSTT1, GSTM1/GSTT1, and SOD2 in the patients with schizophrenia did not differ from those observed in the controls (P=0.831, P=0.394, P=0.164, and P=0.714, respectively) and were comparable with the frequencies observed in the general Japanese population.40,41 Since the frequency of the SOD2 Ala/Ala genotype was too small in both groups, we combined the Ala/Ala and Ala/Val genotypes in the subsequent analyses. The mean age was significantly higher in subjects with the GSTM1 null genotype than in those with the present genotype among the patients with schizophrenia (Supplementary Table 1); whereas the patient age and number of females did not differ according to GSTT1, SOD2, and GSTM1/GSTT1 genotypes (Supplementary Tables 2–5).
Association between genotypes and incidence of metabolic abnormalities in schizophrenic patients
None of the GSTM1, GSTT1, and SOD2 genotypes alone was associated with risk of overweight, metabolic syndrome, or abnormalities in each component of the metabolic syndrome in patients with schizophrenia (Table 2). Since significant interactive effects of the GSTM1 genotype and smoking status on the risks for being overweight and having an abnormal waist circumference (P=0.034 and P=0.018, respectively) were observed, we assessed the effects of GSTM1 genotype on the risks of being overweight, having metabolic syndrome, and having abnormalities in each component of the metabolic syndrome separately in smokers and nonsmokers (Table 3). Among the smokers, the incidences of being overweight and having decreased HDL cholesterol levels were significantly higher in those with the GSTM1 null genotype than in those with the present genotype. Conversely, the incidence of having an abnormal waist circumference was significantly lower in nonsmokers with the GSTM1 null genotype.
Table 2.
Associations between genotypes and risk of metabolic abnormalities in patients with schizophrenia and age/sex-matched controls
| Parameter | Genotype | Schizophrenia (n= 154)
|
Controls (n=203)
|
||||||
|---|---|---|---|---|---|---|---|---|---|
| Frequency (%)a | Pb | OR (95% CI)c | Pc | Frequency (%)a | Pb | OR (95% CI)c | Pc | ||
| Overweight | GSTM1 | ||||||||
| Present | 34 (44.2%) | 0.628 | 1 | 26 (25.0%) | 0.870 | 1 | |||
| Null | 38 (49.4%) | 9.427 (0.763–116.452) | 0.080 | 23 (23.2%) | 0.887 (0.461–1.706) | 0.719 | |||
| GSTT1 | |||||||||
| Present | 40 (46.5%) | 1.000 | 1 | 24 (23.1%) | 0.745 | 1 | |||
| Null | 32 (47.1%) | 0.209 (0.016–2.727) | 0.232 | 25 (25.3%) | 1.135 (0.588–2.189) | 0.706 | |||
| SOD2 Vall6Ala | |||||||||
| Ala/Ala or Ala/Val | 17 (41.5%) | 0.469 | 1 | 15 (30.0%) | 0.261 | 1 | |||
| Val/Val | 55 (48.7%) | 2.215 (0.137–35.922) | 0.576 | 34 (22.2%) | 0.677 (0.329–1.396) | 0.291 | |||
| MetS | GSTM1 | ||||||||
| Present | 16 (20.8%) | 0.846 | 1 | 9 (8.7%) | 0.595 | 1 | |||
| Null | 18 (23.4%) | 1.539 (0.071–33.414) | 0.784 | 6 (6.1%) | 0.720 (0.237–2.186) | 0.562 | |||
| GSTT1 | |||||||||
| Present | 17 (19.8%) | 0.442 | 1 | 5 (4.8%) | 0.184 | 1 | |||
| Null | 17 (25.0%) | 2.496 (0.112–55.817) | 0.564 | 10 (10.1%) | 1.795 (0.572–5.630) | 0.316 | |||
| SOD2 Vall6Ala | |||||||||
| Ala/Ala or Ala/Val | 10 (24.4%) | 0.666 | 1 | 4 (8.0%) | 0.765 | 1 | |||
| Val/Val | 24 (21.2%) | 2.372 (0.069–81.138) | 0.632 | 11 (7.2%) | 0.909 (0.264–3.126) | 0.879 | |||
| Abnormal waist circumference | GSTM1 | ||||||||
| Present | 44 (57.1%) | 0.746 | 1 | 29 (27.9%) | 0.447 | 1 | |||
| Null | 41 (53.2%) | 7.889 (0.717–86.793) | 0.091 | 33 (33.3%) | 1.445 (0.761–2.742) | 0.261 | |||
| GSTT1 | |||||||||
| Present | 46 (53.5%) | 0.744 | 1 | 29 (27.9%) | 0.447 | 1 | |||
| Null | 39 (57.4%) | 0.814 (0.083–7.965) | 0.860 | 33 (33.3%) | 1.181 (0.621–2.247) | 0.613 | |||
| SOD2 Vall6Ala | |||||||||
| Ala/Ala or Ala/Val | 20 (48.8%) | 0.363 | 1 | 16 (32.0%) | 0.860 | 1 | |||
| Val/Val | 65 (57.5%) | 2.216 (0.224–21.960) | 0.497 | 46 (30.1%) | 0.900 (0.431–1.880) | 0.778 | |||
| Elevated blood pressure | GSTM1 | ||||||||
| Present | 29 (37.7%) | 0.414 | 1 | 31 (29.8%) | 0.879 | 1 | |||
| Null | 35 (45.5%) | 8.366 (0.758–92.350) | 0.083 | 31 (31.3%) | 1.073 (0.583–1.975) | 0.821 | |||
| GSTT1 | |||||||||
| Present | 33 (38.4%) | 0.412 | 1 | 36 (34.6%) | 0.224 | 1 | |||
| Null | 31 (45.6%) | 1.962 (0.183–21.046) | 0.578 | 26 (26.3%) | 0.627 (0.338–1.165) | 0.140 | |||
| SOD2 Vall6Ala | |||||||||
| Ala/Ala or Ala/Val | 22 (53.7%) | 0.095 | 1 | 15 (30.0%) | 1.000 | 1 | |||
| Val/Val | 42 (37.2%) | 0.569 (0.044–7.420) | 0.667 | 47 (30.7%) | 1.033 (0.508–2.102) | 0.928 | |||
| Decreased HDL cholesterol | GSTM1 | ||||||||
| Present | 22 (28.6%) | 0.233 | 1 | 4 (3.8%) | 0.530 | 1 | |||
| Null | 30 (39.0%) | 11.428 (0.874–149.423) | 0.063 | 6 (6.1%) | 1.685 (0.446–6.367) | 0.441 | |||
| GSTT1 | |||||||||
| Present | 32 (37.2%) | 0.391 | 1 | 5 (4.8%) | 1.000 | 1 | |||
| Null | 20 (29.4%) | 1.392 (0.119–16.261) | 0.792 | 5 (5.1%) | 1.115 (0.299–4.158) | 0.872 | |||
| SOD2 Vall6Ala | |||||||||
| Ala/Ala or Ala/Val | 11 (26.8%) | 0.337 | 1 | 1 (2.0%) | 0.456 | 1 | |||
| Val/Val | 41 (36.3%) | 5.936 (0.453–77.715) | 0.175 | 9 (5.9%) | 2.848 (0.346–23.430) | 0.330 | |||
| Elevated triglycerides | GSTM1 | ||||||||
| Present | 25 (32.5%) | 0.862 | 1 | 25 (24.0%) | 1.000 | 1 | |||
| Null | 23 (29.9%) | 1.181 (0.084–16.568) | 0.902 | 23 (23.2%) | 0.948 (0.488–1.843) | 0.875 | |||
| GSTT1 | |||||||||
| Present | 25 (29.1%) | 0.600 | 1 | 22 (21.2%) | 0.413 | 1 | |||
| Null | 23 (33.8%) | 4.903 (0.381–63.157) | 0.223 | 26 (26.3%) | 1.458 (0.745–2.853) | 0.271 | |||
| SOD2 Vall6Ala | |||||||||
| Ala/Ala or Ala/Val | 12 (29.3%) | 0.845 | 1 | 11 (22.0%) | 0.849 | 1 | |||
| Val/Val | 36 (31.9%) | 0.949 (0.059–15.254) | 0.971 | 37 (24.2%) | 1.080 (0.496–2.354) | 0.846 | |||
| Elevated fasting glucose | GSTM1 | ||||||||
| Present | 27 (35.1%) | 0.739 | 1 | 26 (25.0%) | 0.873 | 1 | |||
| Null | 30 (39.0%) | 3.590 (0.276–46.722) | 0.329 | 26 (26.3%) | 1.093 (0.550–2.172) | 0.799 | |||
| GSTT1 | |||||||||
| Present | 33 (38.4%) | 0.739 | 1 | 24 (23.1%) | 0.424 | 1 | |||
| Null | 24 (35.3%) | 5.007 (0.421–59.492) | 0.202 | 28 (28.3%) | 1.513 (0.754–3.033) | 0.244 | |||
| SOD2 Vall6Ala | |||||||||
| Ala/Ala or Ala/Val | 16 (39.0%) | 0.851 | 1 | 11 (22.0%) | 0.578 | 1 | |||
| Val/Val | 41 (36.3%) | 1.285 (0.088–18.657) | 0.854 | 41 (26.8%) | 1.224 (0.544–2.752) | 0.625 | |||
Notes:
Frequency and percentage indicate those of the metabolic abnormalities for each genotype
Fisher’s exact test
OR (95% CI) and P-values were calculated by logistic regression analysis that included all genotypes, patient-related categorical factors (ie, sex, smoking status, treatment with or without atypical antipsychotics, or inpatient/outpatient status), interactions between genotypes, interactions between genotypes and patient-related factors as fixed effects, and age was included as a random effect.
Abbreviations: CI, confidence interval; GST, glutathione S-transferase; HDL, high-density lipoprotein; MetS, metabolic syndrome; SOD2, superoxide dismutase 2; OR, odds ratio.
Table 3.
Association between GSTM1 genotype and risk of metabolic abnormalities in smokers and nonsmokers among patients with schizophrenia
| Parameter | GSTM1 genotype | Smokers (n=78)
|
Nonsmokers (n=76)
|
||||||
|---|---|---|---|---|---|---|---|---|---|
| Frequency (%)a | Pb | OR (95% CI)c | Pc | Frequency (%)a | Pb | OR (95% CI)c | Pc | ||
| Overweight | Present | 14 (33.3%) | 0.169 | 1 | 20 (57.1%) | 0.498 | 1 | ||
| Null | 18 (50.0%) | 3.202 (1.081–9.480) | 0.036 | 20 (48.8%) | 0.610 (0.225–1.652) | 0.331 | |||
| MetS | Present | 11 (26.2%) | 0.619 | 1 | 5 (14.3%) | 1.000 | 1 | ||
| Null | 12 (33.3%) | 1.629 (0.550–4.828) | 0.378 | 6 (14.6%) | 0.797 (0.180–3.534) | 0.765 | |||
| Abnormal waist circumference | Present | 21 (50.0%) | 0.367 | 1 | 23 (65.7%) | 0.109 | 1 | ||
| Null | 22 (61.1%) | 2.014 (0.750–5.412) | 0.165 | 19 (46.3%) | 0.336 (0.1 17–0.968) | 0.043 | |||
| Elevated blood pressure | Present | 16 (38.1%) | 0.493 | 1 | 13 (37.1%) | 0.642 | 1 | ||
| Null | 17 (47.2%) | 1.630 (0.579–4.590) | 0.355 | 18 (43.9%) | 1.182 (0.428–3.263) | 0.747 | |||
| Decreased HDL cholesterol | Present | 11 (26.2%) | 0.062 | 1 | 11 (31.4%) | 1.000 | 1 | ||
| Null | 17 (47.2%) | 3.151 (1.062–9.350) | 0.039 | 13 (31.7%) | 0.852 (0.278–2.609) | 0.779 | |||
| Elevated triglycerides | Present | 15 (35.7%) | 0.810 | 1 | 10 (28.6%) | 1.000 | 1 | ||
| Null | 11 (30.6%) | 1.003 (0.331–3.036) | 0.996 | 12 (29.3%) | 1.144 (0.392–3.342) | 0.806 | |||
| Elevated fasting glucose | Present | 11 (26.2%) | 0.159 | 1 | 16 (45.7%) | 0.486 | 1 | ||
| Null | 15 (41.7%) | 1.956 (0.612–6.253) | 0.258 | 15 (36.6%) | 0.684 (0.248–1.883) | 0.462 | |||
Notes:
Frequency and percentage indicate those of the metabolic abnormalities for each genotype
Fisher’s exact test
OR (95% CI) and P-values were calculated by logistic regression analysis that included the GSTMI, GSTTI, and SOD2 genotypes, patient-related categorical factors (ie, sex, treatment with or without atypical antipsychotics, or inpatient/outpatient status) as fixed effects, and age as a random effect.
Abbreviations: CI, confidence interval; GST, glutathione S-transferase; HDL, high-density lipoprotein; MetS, metabolic syndrome; OR, odds ratio.
Given that an interactive effect of the GSTM1 and GSTT1 genotypes on the risk of having decreased HDL cholesterol was also observed (P=0.020), the relationships between the risk of metabolic abnormalities and the combinations of GSTM1 and GSTT1 genotypes were also analyzed (Table 4). The risk of having a decreased HDL cholesterol level was significantly higher in patients with the GSTM1 null/GSTT1 present genotypes, but not in those with the GSTM1 present/GSTT1 null genotypes or GSTM1 null/GSTT1 null genotypes, compared with those with the GSTM1 present/GSTT1 present genotype. No other interactions between genotypes or between genotype and other patient-related factors (age, sex, smoking status, treatment with or without atypical antipsychotics, inpatient/outpatient status) were observed in the patients with schizophrenia.
Table 4.
Frequency distribution of combinations of GSTM1 and GSTT1 genotypes in schizophrenic subjects with metabolic abnormalities
| Parameter | GSTM1 genotype | GSTT1 genotype | Frequency (%)a | Pb | OR (95% CI)c | Pc |
|---|---|---|---|---|---|---|
| Overweight | Present | Present | 20 (40.8%) | 0.660 | 1 | |
| Null | Present | 20 (54.1%) | 2.032 (0.824–5.012) | 0.124 | ||
| Present | Null | 14 (50.0%) | 1.789 (0.656–4.876) | 0.256 | ||
| Null | Null | 18 (45.0%) | 1.475 (0.600–3.626) | 0.398 | ||
| MetS | Present | Present | 7 (14.3%) | 0.252 | 1 | |
| Null | Present | 10 (27.0%) | 2.297 (0.751–7.028) | 0.145 | ||
| Present | Null | 9 (32.1%) | 2.778 (0.843–9.147) | 0.093 | ||
| Null | Null | 8 (20.0%) | 1.830 (0.568–5.898) | 0.311 | ||
| Abnormal waist circumference | Present | Present | 25 (51.0%) | 0.449 | 1 | |
| Null | Present | 21 (56.8%) | 1.225 (0.512–2.929) | 0.649 | ||
| Present | Null | 19 (67.9%) | 1.997 (0.730–5.464) | 0.178 | ||
| Null | Null | 20 (50.0%) | 1.024 (0.432–2.429) | 0.957 | ||
| Elevated blood pressure | Present | Present | 18 (36.7%) | 0.651 | 1 | |
| Null | Present | 15 (40.5%) | 1.290 (0.517–3.221) | 0.586 | ||
| Present | Null | 11 (39.3%) | 1.252 (0.449–3.496) | 0.668 | ||
| Null | Null | 20 (50.0%) | 1.825 (0.735–4.533) | 0.195 | ||
| Decreased HDL cholesterol | Present | Present | 12 (24.5%) | 0.021 | 1 | |
| Null | Present | 20 (54.1%) | 3.599 (1.409–9.193) | 0.007 | ||
| Present | Null | 10 (37.5%) | 1.535 (0.533–4.419) | 0.427 | ||
| Null | Null | 10 (25.0%) | 0.919 (0.337–2.505) | 0.869 | ||
| Elevated triglycerides | Present | Present | 12 (24.5%) | 0.180 | 1 | |
| Null | Present | 13 (35.1%) | 1.882 (0.702–5.043) | 0.209 | ||
| Present | Null | 13 (46.4%) | 2.813 (0.972–8.140) | 0.057 | ||
| Null | Null | 10 (25.0%) | 1.425 (0.507–4.004) | 0.501 | ||
| Elevated fasting glucose | Present | Present | 17 (34.7%) | 0.845 | 1 | |
| Null | Present | 16 (43.2%) | 1.482 (0.580–3.783) | 0.411 | ||
| Present | Null | 10 (35.7%) | 1.399 (0.479–4.088) | 0.540 | ||
| Null | Null | 14 (35.0%) | 1.036 (0.399–2.688) | 0.942 |
Notes:
Frequency and percentage indicate those of the metabolic abnormalities for each genotype
Fisher’s exact test
OR (95% CI) and P-values were calculated by logistic regression analysis that included combinations of the GSTM1 and GSTT1 genotypes, SOD2 genotypes, patient-related categorical factors (ie, sex, treatment with or without atypical antipsychotics, or inpatient/outpatient status) as fixed effects, and age as a random effect.
Abbreviations: CI, confidence interval; GST, glutathione S-transferase; HDL, high density lipoprotein; MetS, metabolic syndrome; OR, odds ratio; SOD2, superoxide dismutase 2.
When the magnitude of the effect size (ie, the OR value) was fixed at 2.0 and 3.0 in the 154 patients with schizophrenia, the statistical power of the associations between genotype and risk of metabolic abnormalities was 32%–56% and 56%–90%, respectively, based on the observed frequencies of the genotypes and metabolic abnormalities. Because we speculated that the influence of GST and SOD2 polymorphisms on metabolic abnormalities would be more pronounced in patients under high oxidative stress conditions than in the remaining subjects, we also calculated the statistical power with a larger effect size (ie, an OR of 3.0 and 4.0) in the smokers with schizophrenia. When the OR was fixed at 3.0 and 4.0 in the 78 smokers with schizophrenia, the statistical power of the associations between genotype and risk of metabolic abnormalities was 55%–66% and 72%–82%, respectively. The respective percentages are shown in Supplementary Table 6.
Association between genotype and incidence of metabolic abnormalities in age/sex-matched controls
None of the GSTM1, GSTT1, or SOD2 genotypes examined was individually associated with the incidence of overweight, metabolic syndrome, or abnormalities in each component of the metabolic syndrome in controls (Table 2). To compare the results in patients with schizophrenia, we assessed the effects of GSTM1 genotype on the risks of being overweight, having a large waist circumference, and on the HDL cholesterol levels separately in smokers and nonsmokers, and also examined the effects of combinations of the GSTM1 and GSTT1 genotypes on the risk of decreased HDL cholesterol. The GSTM1 null genotype was not associated with the incidence of overweight, an abnormal waist circumference, or a decreased HDL cholesterol level among smokers and nonsmokers (Table 5). The risk of a decreased HDL cholesterol level was not significantly different in subjects with the GSTM1 null/GSTT1 present, GSTM1 present/GSTT1 null, and GSTM1 null/GSTT1 null genotypes compared with those with the GSTM1 present/GSTT1 present genotype (Table 5).
Table 5.
Association of GSTM1 genotype with risk of metabolic abnormalities in smokers and nonsmokers and association of combinations of GSTM1 and GSTT1 genotypes among age/sex-matched controls
| Subjects | Parameter | Genotype | Frequency (%)a | Pb | OR (95% CI)c | Pc |
|---|---|---|---|---|---|---|
| Smokers (n=43) | Overweight | GSTM1 present | 5 (23.8%) | 0.457 | 1 | |
| GSTM1 null | 3 (13.6%) | 0.566 (0.106–3.036) | 0.507 | |||
| Abnormal waist circumference | GSTM1 present | 5 (23.8%) | 1.000 | 1 | ||
| GSTM1 null | 5 (22.7%) | 1.568 (0.275–8.941) | 0.613 | |||
| Decreased HDL cholesterol | GSTM1 present | 1 (4.8%) | 0.607 | 1 | ||
| GSTM1 null | 3 (13.6%) | 2.782 (0.228–33.873) | 0.422 | |||
| Nonsmokers (n=160) | Overweight | GSTM1 present | 21 (25.3%) | 1.000 | 1 | |
| GSTM1 null | 20 (26.0%) | 1.010 (0.490–2.081) | 0.979 | |||
| Abnormal waist circumference | GSTM1 present | 24 (28.9%) | 0.399 | 1 | ||
| GSTM1 null | 28 (36.4%) | 1.540 (0.755–3.140) | 0.235 | |||
| Decreased HDL cholesterol | GSTM1 present | 3 (3.6%) | 1.000 | 1 | ||
| GSTM1 null | 3 (3.9%) | 1.147 (0.220–5.981) | 0.871 | |||
| All (n=203) | Decreased HDL cholesterol | GSTM1 present/GSTT1 present | 2 (4.0%) | 0.919 | 1 | |
| GSTM1 null/GSTT1 present | 3 (5.6%) | 1.230 (0.190–7.962) | 0.828 | |||
| GSTM1 present/GSTT1 null | 2 (3.7%) | 0.773 (0.100–5.968) | 0.805 | |||
| GSTM1 null/GSTT1 null | 3 (6.7%) | 1.763 (0.273–11.379) | 0.551 |
Notes:
Frequency and percentage indicate those of the metabolic abnormalities for each genotype
Fisher’s exact test
OR (95% CI) and P-values were calculated by logistic regression analysis that included the GSTM1 and GSTT1 genotypes (or combinations of the GSTM1 and GSTT1 genotypes), SOD2 genotypes, and sex as fixed effects, and age as a random effect.
Abbreviations: CI, confidence interval; GST, glutathione S-transferase; HDL, high-density lipoprotein; OR, odds ratio; SOD2, superoxide dismutase 2.
Discussion
The present study showed that none of the GSTM1, GSTT1, and SOD2 genotypes examined were independent risk factors for metabolic abnormalities in patients with schizophrenia. On the other hand, when the possible associations between genotype and risk of metabolic abnormalities were analyzed, while also paying careful attention to the associations with other patient characteristics, the present study demonstrated the possible impact of the GSTM1 null genotype on metabolic abnormalities in patients with schizophrenia.
In this study, we found that the risks of being overweight and having a decreased HDL cholesterol level were significantly higher in subjects with the GSTM1 null genotype than in those with the present genotype among smokers with schizophrenia (Table 3). The findings of the present study are in line with another recent study showing that the GSTM1 null genotype was associated with a tendency toward a higher BMI and decreased HDL cholesterol in patients who underwent coronary angiography.42 Additionally, the interactive effects of current smoking and GSTM1 null genotype on development of type 2 diabetes, nonalcoholic fatty liver disease, and several cancers have been reported in the general population.27,30,43,44 The findings of the present study also suggest that the GSTM1 null genotype, in combination with current smoking, could be associated with the risks of being overweight and having decreased HDL cholesterol in patients with schizophrenia.
In this study, we found that the risk of an abnormal waist circumference was lower in nonsmoking schizophrenic subjects with the GSTM1 null genotype (Table 3). The GSTM1 null genotype is reported to be one of the potential risk factors for various smoking-related diseases.27–30,43 In this study, among smokers with schizophrenia, the risks of being overweight and having a decreased HDL cholesterol level were significantly higher in subjects with the GSTM1 null genotype (Table 3). It is thus possible that some nonsmoking patients harboring the high-risk GSTM1 null genotype might have stopped smoking or made other lifestyle modifications, which may have led to the lower risk of abdominal obesity. In fact, the frequency of the GSTM1 null genotype tended to be higher in nonsmokers than in smokers with schizophrenia (53.9% versus 46.2%; see Supplementary Table 7). However, because we could not obtain information about these lifestyle-related factors, including past smoking status, from the patients in the present study, the association between the GSTM1 null genotype and the lower risk of an abnormal waist circumference in nonsmokers with schizophrenia needs to be confirmed in a longitudinal study incorporating a collection of detailed lifestyle information.
The present study shows that the risk of decreased HDL cholesterol was significantly higher in subjects with the GSTM1 null/GSTT1 present genotypes, but not in those with the GSTM1 present/GSTT1 null and GSTM1 null/GSTT1 null genotypes, compared with the GSTM1 present/GSTT1 present genotypes (Table 4). These findings suggest that the GSTM1 null, rather than the GSTT1 null, genotype might be associated with the risk of having decreased HDL cholesterol levels in patients with schizophrenia. The GSTT1 null genotype, especially in combination with the GSTM1 null genotype, has been reported to be associated with the risk of cardiovascular or metabolic disease in the general population.27–29,44 The frequency of nonsmoking tended to be higher in subjects with the GSTM1 null/GSTT1 null genotypes (57.5%) compared with those having the other combinations (32.1%–53.1%) in the present study (see Supplementary Table 4), which might be related to the lack of an association between the GSTM1/GSTT1 double null genotypes and the metabolic abnormalities observed in this study. Nevertheless, larger studies are required to elucidate the influence of the GSTT1 null genotype and/or combination with the GSTM1 null genotype on the risk of metabolic abnormalities in patients with schizophrenia.
A previous study of 78 Korean patients with schizophrenia demonstrated that there were no differences in the null genotype distribution of GSTM1 and GSTT1 between subjects with a body weight gain ≥7% compared with subjects with a body weight gain <7% after long-term olanzapine treatment.37 However, the level of lipid peroxidation appears to be significantly higher after treatment with typical antipsychotics,45 and a significant increase in lipid peroxidation was observed after long-term treatment with clozapine, ziprasidone, and risperidone, but not with olanzapine, in the rat brain.46 The patients in the present study were treated with olanzapine, as well as with other atypical and typical antipsychotics, and/or combinations of these agents, whereas patients were excluded if they took antipsychotics other than olanzapine in the Korean study.37 Therefore, we speculate that levels of systemic reactive oxygen species might have been higher in the patients included in the present study than in those in the Korean study, resulting in the significant effects of the GSTM1 null genotype on the metabolic abnormalities in patients with schizophrenia observed in the present study.
SOD2 also plays crucial roles in antioxidant defense mechanisms.31 The Val16Ala polymorphism has been linked to cardiovascular disease and to type 2 diabetes and its complications in the general population, but studies so far have yielded conflicting results.28,29,33 In the present study, we did not find any significant associations between the SOD2 genotype and the risks of being overweight and having metabolic syndrome in patients with schizophrenia or controls. Although further study is required to elucidate this relationship in a larger number of subjects, it is possible that the SOD2 Val16Ala polymorphism as a risk factor by itself is not strong enough to demonstrate a significant association with metabolic abnormalities in patients with schizophrenia.
This investigation has some potential limitations. First, the power of the samples in the analyses ranging from 32% to 90% (Supplementary Table 6) and the small number of subjects were major limitations. Therefore, the present study may not have had enough power to clarify whether GSTM1, GSTT1, and SOD2 polymorphisms are independent risk factors for metabolic abnormalities in patients with schizophrenia, and a type 1 error cannot be excluded. Specifically, when effect size (ie, OR) is fixed at 2.0 with a statistical power of 0.80, a sample size of 322–540 patients would be needed to determine the effects of the SOD2 genotype before any definitive conclusions can be drawn. Further, the prevalence of overweight and metabolic syndrome was low in the controls (Table 1), which might have contributed to our results showing that none of the polymorphisms was associated with metabolic abnormalities in the controls. Second, this was a cross-sectional study that had only one assessment for metabolic abnormalities, and several potential covariates associated with overweight and metabolic syndrome could not be included, such as dietary habits, physical activity levels, past smoking status, duration of illness, and treatment and schizophrenic symptoms. Therefore, as in any study examining genotype-phenotype relationships, replication of the current findings is required.
Conclusion
The results of the present study suggest that the GSTM1 null genotype, in combination with smoking status or GSTT1 genotype, may be associated with the risk of metabolic abnormalities in Japanese patients with schizophrenia. Although these results need to be confirmed in further investigations with larger samples, our findings provide new insight for continued work in this area.
Supplementary tables
Table S1.
Demographic and clinical characteristics according to GSTM1 genotype in patients with schizophrenia and controls
| Schizophrenia (n=154)
|
Controls (n=203)
|
|||||
|---|---|---|---|---|---|---|
| GSTM1 present genotype | GSTM1 null genotype | Pa | GSTM1 present genotype | GSTM1 null genotype | Pa | |
| Numberb | 77 (50.0%) | 77 (50.0%) | – | 104 (51.2%) | 99 (48.8%) | – |
| Age (years) | 47.5±14.8 | 52.9±15.4 | 0.027 | 52.6±9.2 | 52.1±8.8 | 0.701 |
| Malec | 41 (53.2%) | 39 (50.6%) | 0.872 | 58 (55.8%) | 59 (59.6%) | 0.670 |
| Smokerc | 42 (54.5%) | 36 (46.8%) | 0.420 | 22 (22.2%) | 21 (20.2%) | 0.735 |
| Height (cm) | 161.8±8.4 | 161.5±8.5 | 0.844 | 162.4±9.5 | 163.4±8.3 | 0.436 |
| Weight (kg) | 66.1±13.9 | 64.1±13.3 | 0.360 | 60.6±11.6 | 62.9±10.0 | 0.127 |
| BMI (kg/m2) | 25.1±4.2 | 24.4±4.0 | 0.297 | 22.9±3.3 | 23.5±3.1 | 0.136 |
| Overweightc | 34 (44.2%) | 38 (49.4%) | 0.628 | 26 (25.0%) | 23 (23.2%) | 0.870 |
| Metabolic syndromec | 16 (20.8%) | 18 (23.4%) | 0.846 | 9 (8.7%) | 6 (6.1%) | 0.595 |
| Waist circumference (cm) | 87.3±12.4 | 84.9±11.3 | 0.203 | 82.2±8.3 | 83.5±7.8 | 0.260 |
| Systolic blood pressure (mmHg) | 123.0±14.5 | 128.8±17.9 | 0.027 | 116.6±16.8 | 117.7±15.7 | 0.642 |
| Diastolic blood pressure (mmHg) | 75.9±10.4 | 77.7±13.4 | 0.345 | 71.4±11.1 | 74.4±10.8 | 0.056 |
| High-density lipoprotein (mg/dL) | 53.9±15.1 | 50.3±13.9 | 0.122 | 65.2±16.4 | 65.9±18.2 | 0.768 |
| Triglycerides (mg/dL) | 151.4±119.1 | 146.5±156.6 | 0.828 | 122.1±104.1 | 119.8±68.1 | 0.851 |
| Fasting blood glucose (mg/dL) | 102.9±36.7 | 103.1±27.6 | 0.974 | 95.2±18.8 | 97.4±21.5 | 0.437 |
| Outpatientsc | 50 (64.9%) | 43 (55.8%) | 0.323 | – | – | – |
| Treatment with AAP(s)c | 54 (70.1%) | 58 (75.3%) | 0.588 | – | – | – |
Notes: Data expressed as the mean ± standard deviation
P-values were determined by Student’s t-test or Fisher’s exact test
values in parentheses indicate percentages in patients with schizophrenia and controls, respectively
values in parentheses indicate percentages among the subjects with each genotype.
Abbreviations: AAP(s), atypical antipsychotics except for aripiprazole; BMI, body mass index; GST, glutathione S-transferase.
Table S2.
Demographic and clinical characteristics according to GSTT1 genotype in patients with schizophrenia and controls
| Schizophrenia (n=154)
|
Controls (n=203)
|
|||||
|---|---|---|---|---|---|---|
| GSTT1 present genotype | GSTT1 null genotype | Pa | GSTT1 present genotype | GSTT1 null genotype | Pa | |
| Numberb | 86 (55.8%) | 68 (44.2%) | – | 104 (51.2%) | 99 (48.8%) | – |
| Age (years) | 50.1±15.0 | 50.4±15.7 | 0.904 | 51.6±9.4 | 53.1±8.5 | 0.233 |
| Malec | 46 (53.5%) | 34 (50.0%) | 0.746 | 64 (61.5%) | 53 (53.5%) | 0.259 |
| Smokerc | 42 (48.8%) | 36 (52.9%) | 0.630 | 26 (25.0%) | 17 (17.2%) | 0.229 |
| Height (cm) | 160.6±8.1 | 163.0±8.6 | 0.080 | 163.9±8.0 | 161.8±9.7 | 0.087 |
| Weight (kg) | 64.2±12.8 | 66.3±14.5 | 0.324 | 62.6±10.3 | 60.8±11.4 | 0.235 |
| BMI (kg/m2) | 24.8±4.1 | 24.8±4.0 | 0.969 | 23.2±2.9 | 23.1±3.4 | 0.852 |
| Overweightc | 40 (46.5%) | 32 (47.1%) | 1.000 | 24 (23.1%) | 25 (25.3%) | 0.745 |
| Metabolic syndromec | 17 (19.8%) | 17 (25.0%) | 0.442 | 5 (4.8%) | 10 (10.1%) | 0.184 |
| Waist circumference (cm) | 85.6±12.1 | 86.8±11.8 | 0.529 | 83.1±7.6 | 82.6±8.6 | 0.648 |
| Systolic blood pressure (mmHg) | 125.0±16.9 | 127.1±16.0 | 0.447 | 117.5±16.5 | 116.8±16.0 | 0.775 |
| Diastolic blood pressure (mmHg) | 75.6±10.9 | 78.3±13.2 | 0.157 | 73.3±11.3 | 72.4±10.7 | 0.531 |
| High-density lipoprotein (mg/dL) | 53.1±16.1 | 50.9±12.5 | 0.335 | 64.1±16.7 | 67.1±17.7 | 0.215 |
| Triglycerides (mg/dL) | 134.8±93.9 | 166.9±179.3 | 0.184 | 125.0±101.6 | 116.8±71.6 | 0.508 |
| Fasting blood glucose (mg/dL) | 101.3±23.1 | 105.2±41.3 | 0.467 | 95.7±17.7 | 96.9±22.4 | 0.662 |
| Outpatientsc | 55 (64.0%) | 38 (55.9%) | 0.324 | – | – | – |
| Treatment with AAP(s)c | 61 (70.9%) | 51 (45.5%) | 0.591 | – | – | – |
Notes: Data expressed as the mean ± standard deviation
P-values were determined by Student’s t-test or Fisher’s exact test
values in parentheses indicate percentages in patients with schizophrenia and controls, respectively
values in parentheses indicate the percentages among the subjects with each genotype.
Abbreviations: AAP(s), atypical antipsychotics except for aripiprazole; BMI, body mass index; GST, glutathione S-transferase.
Table S3.
Demographic and clinical characteristics according to SOD2 genotype in patients with schizophrenia and controls
| Schizophrenia (n=154)
|
Controls (n=203)
|
|||||
|---|---|---|---|---|---|---|
| Val/Val | Ala/Val, Ala/Ala | Pa | Val/Val | Ala/Val, Ala/Ala | Pa | |
| Numberb | 113 (73.4%) | 41 (26.6%) | – | 153 (75.4%) | 50 (24.6%) | – |
| Age (years) | 49.5±15.2 | 52.2±15.6 | 0.334 | 52.4±9.0 | 52.3±8.8 | 0.993 |
| Malec | 59 (52.2%) | 21 (51.2%) | 1.000 | 88 (57.5%) | 29 (58.0%) | 1.000 |
| Smokerc | 57 (50.4%) | 21 (51.2%) | 1.000 | 34 (22.2%) | 9 (18.0%) | 0.690 |
| Height (cm) | 162.0±8.4 | 160.8±8.5 | 0.417 | 163.0±9.2 | 162.4±8.2 | 0.688 |
| Weight (kg) | 65.7±13.4 | 63.6±14.1 | 0.406 | 61.9± 11.1 | 61.2±10.3 | 0.711 |
| BMI (kg/m2) | 24.9±4.1 | 24.4±4.0 | 0.526 | 23.2±3.1 | 23.2±3.4 | 0.996 |
| Overweightc | 55 (48.7%) | 17 (41.5%) | 0.469 | 34 (22.2%) | 15 (30.0%) | 0.261 |
| Metabolic syndromec | 24 (21.2%) | 10 (24.4%) | 0.666 | 11 (7.2%) | 4 (8.0%) | 0.765 |
| Waist circumference (cm) | 86.7±11.6 | 84.8± 12.9 | 0.391 | 82.8±8.0 | 83.1 ±8.5 | 0.827 |
| Systolic blood pressure (mmHg) | 124.6± 15.5 | 129.5±18.7 | 0.142 | 117.3±15.7 | 116.8±17.8 | 0.856 |
| Diastolic blood pressure (mmHg) | 76.5±11.4 | 77.7± 13.5 | 0.573 | 72.9± 11.1 | 72.6± 10.9 | 0.858 |
| High-density lipoprotein (mg/dL) | 51.3±14.0 | 54.4± 16.2 | 0.231 | 65.0±17.4 | 67.1 ±16.7 | 0.460 |
| Triglycerides (mg/dL) | 150.7± 148.4 | 144.3±108.7 | 0.802 | 119.8±72.3 | 124.7± 125.8 | 0.732 |
| Fasting blood glucose (mg/dL) | 102.6±31.2 | 104.2±35.7 | 0.780 | 96.9±21.0 | 94.4±17.2 | 0.447 |
| Outpatientsc | 69 (61.1%) | 24 (58.5%) | 0.853 | – | – | – |
| Treatment with AAP(s)c | 84 (74.3%) | 28 (68.3%) | 0.540 | – | – | – |
Notes: Data expressed as the mean ± standard deviation;
P-values were determined by student’s t-test or Fisher’s exact test;
values in parentheses indicate percentages in patients with schizophrenia and controls, respectively;
values in parentheses indicate the percentages among the subjects with each genotype.
Abbreviations: AAP(s), atypical antipsychotics except for aripiprazole; BMi, body mass index; SOD2, superoxide dismutase.
Table S4.
Demographic and clinical characteristics according to the combination of GSTM1 and GSTT1 genotypes in the overall population of patients with schizophrenia
| GSTM1 and GSTT1 genotypes | M1 present/T1 present | M1 null/T1 present | M1 present/T1 null | M1 null/T1 null | Pa |
|---|---|---|---|---|---|
| Numberb | 49 (31.8%) | 37 (24.0%) | 28 (18.2%) | 40 (26.0%) | – |
| Age (years) | 49.2±15.1 | 51.3±15.1 | 44.6±13.9 | 54.4±15.7 | 0.064 |
| Malec | 28 (57.1%) | 18 (48.6%) | 13 (46.4%) | 21 (52.5%) | 0.802 |
| Smokersc | 23 (46.9%) | 19 (51.4%) | 19 (67.9%) | 17 (42.5%) | 0.203 |
| Height (cm) | 161.1±7.8 | 160.0±8.6 | 163.1±9.4 | 163.0±8.2 | 0.332 |
| Weight (kg) | 64.4±13.1 | 63.9±12.7 | 69.2±15.0 | 64.4±14.0 | 0.381 |
| BMI (kg/m2) | 24.7±4.1 | 24.9±4.3 | 25.8±4.2 | 24.0±3.7 | 0.338 |
| Overweightc | 20 (40.8%) | 20 (54.1%) | 14 (50.0%) | 18 (45.0%) | 0.660 |
| Metabolic syndromec | 7 (14.3%) | 10 (27.0%) | 9 (32.1%) | 8 (20.0%) | 0.252 |
| Waist circumference (cm) | 85.5±12.3 | 85.8±12.0 | 90.7±12.2 | 84.1±10.8 | 0.142 |
| Systolic blood pressure (mmHg) | 123.2±16.3 | 127.4±17.7 | 122.6±11.1 | 130.2±18.2 | 0.144 |
| Diastolic blood pressure (mmHg) | 74.8±10.3 | 76.6±11.6 | 77.8±10.4 | 78.8±14.9 | 0.463 |
| High-density lipoprotein (mg/dL) | 56.0±15.8 | 49.2±15.8 | 50.2±13.5 | 51.3±12.0 | 0.132 |
| Triglycerides (mg/dL) | 128.8±75.7 | 142.8±114.3 | 191.0±165.0 | 150.0±188.9 | 0.299 |
| Fasting glucose (mg/dL) | 99.4±23.7 | 103.9±22.4 | 109.1±52.3 | 102.4±31.9 | 0.652 |
| Outpatientsc | 31 (63.3%) | 24 (64.9%) | 19 (67.9%) | 19 (47.5%) | 0.284 |
| Treatment with AAP(s)c | 36 (73.5%) | 25 (67.6%) | 18 (64.3%) | 33 (82.5%) | 0.308 |
Notes: Data expressed as the mean ± standard deviation
P-values were determined by analysis of variance or Fisher’s exact test
values in parentheses indicate percentages in GSTM1 present/T1 present, M1 null/T1 present, M1 present/T1 null, M1 null/T1 null genotypes, respectively
values in parentheses indicate percentages among the subjects with each genotype.
Abbreviations: AAP(s), atypical antipsychotics except for aripiprazole; BMI, body mass index; GST, glutathione S-transferase.
Table S5.
Demographic and clinical characteristics according to the combination of GSTM1 and GSTT1 genotypes in the overall population of controls
| GSTM1 and GSTT1 genotypes | M1 present/T1 present | M1 null/T1 present | M1 present/T1 null | M1 null/T1 null | Pa |
|---|---|---|---|---|---|
| Numberb | 50 (24.6%) | 54 (26.6%) | 54 (26.6%) | 45 (22.2%) | – |
| Age (years) | 51.8±9.2 | 51.4±9.6 | 53.3±9.2 | 52.9±7.6 | 0.679 |
| Malec | 30 (60.0%) | 34 (63.0%) | 28 (51.9%) | 25 (55.6%) | 0.676 |
| Smokerc | 12 (24.0%) | 14 (25.9%) | 9 (16.7%) | 8 (17.8%) | 0.618 |
| Height (cm) | 163.4±8.1 | 164.4±8.0 | 161.4±10.6 | 162.2±8.7 | 0.333 |
| Weight (kg) | 62.4±10.1 | 62.8±10.6 | 58.9±12.7 | 63.0±9.4 | 0.177 |
| BMI (kg/m2) | 23.3±3.1 | 23.2±2.8 | 22.4±3.4 | 24.0±3.3 | 0.123 |
| Overweightc | 13 (26.0%) | 11 (20.4%) | 13 (24.1%) | 12 (26.7%) | 0.872 |
| Metabolic syndromec | 3 (6.0%) | 2 (3.7%) | 6 (11.1%) | 4 (8.9%) | 0.487 |
| Waist circumference (cm) | 84.1±7.5 | 82.2±7.6 | 80.5±8.7 | 85.1±7.9 | 0.023 |
| Systolic blood pressure (mmHg) | 118.9±17.4 | 116.2±15.7 | 114.6±16.1 | 119.6±15.6 | 0.371 |
| Diastolic blood pressure (mmHg) | 73.2±11.6 | 73.5±11.2 | 69.8±10.4 | 75.4±10.4 | 0.075 |
| High-density lipoprotein (mg/dL) | 63.0±16.8 | 65.1±16.7 | 67.3±15.8 | 66.9±20.0 | 0.583 |
| Triglycerides (mg/dL) | 134.9±129.4 | 115.8±66.4 | 110.3±72.5 | 124.6±70.4 | 0.515 |
| Fasting glucose (mg/dL) | 93.9±8.6 | 97.4±23.2 | 96.5±24.7 | 97.5±19.6 | 0.790 |
Notes: Data expressed as the mean ± standard deviation.
P-values were determined by analysis of variance or Fisher’s exact test
values in parentheses indicate percentages in GSTM1 present/T1 present, M1 null/T1 present, M1 present/T1 null, and M1 null/T1 null genotypes, respectively
values in parentheses indicate the percentages among subjects with each genotype.
Abbreviations: BMI, body mass index; GST, glutathione S-transferase.
Table S6.
Statistical power of associations between the genotypes and risk of metabolic abnormalities in patients with schizophrenia and smokers with schizophrenia at a significance (alpha) level of 0.05 (two-tailed) and adequate effect sizes (ie, odds ratios 2.0, 3.0, and 4.0) based on the sample size of the study and observed frequencies of the genotypes and metabolic abnormalities
| All patients with schizophrenia (n=154)
|
Smokers with schizophrenia (n=78)
|
|||||||
|---|---|---|---|---|---|---|---|---|
|
GSTM1 null genotype
|
GSTT1 null genotype
|
SOD2 Val/Val genotype
|
GSTM1 null genotype
|
|||||
| OR 2.0 | OR 3.0 | OR 2.0 | OR 3.0 | OR 2.0 | OR 3.0 | OR 3.0 | OR 4.0 | |
| Overweight | 56% | 90% | 55% | 90% | 46% | 83% | 63% | 81% |
| MetS | 43% | 75% | 41% | 75% | 32% | 56% | 55% | 72% |
| Abnormal waist circumference | 56% | 90% | 55% | 90% | 49% | 85% | 66% | 82% |
| Elevated blood pressure | 55% | 89% | 55% | 89% | 45% | 79% | 63% | 81% |
| Decreased HDL cholesterol | 52% | 87% | 51% | 87% | 40% | 73% | 62% | 78% |
| Elevated triglycerides | 50% | 85% | 49% | 85% | 39% | 70% | 57% | 76% |
| Elevated fasting glucose | 53% | 88% | 53% | 88% | 42% | 76% | 59% | 76% |
Notes: Frequencies of GSTM1 null, GSTT1 null, and SOD2 Val/Val genotypes were fixed as 50.0%, 44.2%, and 73.4%, respectively, and those of overweight, MetS, abnormal waist circumference, elevated blood pressure, decreased HDL cholesterol, elevated triglycerides, and elevated fasting glucose were fixed as 47%, 22%, 55%, 41%, 34%, 31%, and 37%, respectively.
Abbreviations: MetS, metabolic syndrome; HDL, high density lipoprotein; GST, glutathione S-transferase; SOD2, superoxide dismutase 2; OR, odds ratio.
Table S7.
Demographic and clinical characteristics according to the GSTM1 genotypes in smokers and nonsmokers among patients with schizophrenia
| Smokers (n=78)
|
Nonsmokers (n=76)
|
|||||
|---|---|---|---|---|---|---|
| GSTM1 present genotype | GSTM1 null genotype | Pa | GSTM1 present genotype | GSTM1 null genotype | Pa | |
| Numberb | 42 (53.8%) | 36 (46.2%) | – | 35 (46.1%) | 41 (53.9%) | – |
| Age (years) | 45.5±13.8 | 52.7±15.3 | 0.033 | 49.9±15.7 | 53.2±15.7 | 0.371 |
| Malec | 29 (69.0%) | 27 (75.0%) | 0.620 | 12 (34.3%) | 12 (29.3%) | 0.805 |
| Height (cm) | 163.9±8.4 | 164.1±8.75 | 0.893 | 159.3±7.9 | 159.3±7.6 | 0.969 |
| Weight (kg) | 66.8±15.5 | 67.7±13.8 | 0.796 | 65.3±11.8 | 61.0±12.1 | 0.121 |
| BMI (kg/m2) | 24.7±4.3 | 25.0±3.86 | 0.751 | 25.7±4.0 | 24.0±4.1 | 0.071 |
| Overweightc | 14 (33.3%) | 18 (50.0%) | 0.169 | 20 (57.1%) | 20 (48.8%) | 0.498 |
| Metabolic syndromec | 11 (26.2%) | 12 (33.3%) | 0.619 | 5 (14.3%) | 6 (14.6%) | 1.000 |
| Waist circumference (cm) | 87.1±13.6 | 87.1±11.1 | 0.985 | 87.7±11.0 | 83.0±11.3 | 0.076 |
| Systolic blood pressure (mmHg) | 122.3±13.5 | 127.3±15.7 | 0.132 | 123.8±15.8 | 130.2±19.8 | 0.131 |
| Diastolic blood pressure (mmHg) | 75.6±11.2 | 77.0±11.4 | 0.582 | 76.3±9.4 | 78.4±15.0 | 0.481 |
| High-density lipoprotein (mg/dL) | 53.5±15.8 | 45.8±13.6 | 0.026 | 54.5±14.6 | 54.2±13.1 | 0.931 |
| Triglycerides (mg/dL) | 156.7±105.6 | 172.2±205.0 | 0.670 | 145.1±134.9 | 124.0±93.2 | 0.426 |
| Fasting blood glucose (mg/dL) | 97.2±21.6 | 106.3±34.9 | 0.164 | 109.8±48.6 | 100.3±19.0 | 0.252 |
| Outpatientsc | 29 (69.0%) | 23 (63.9%) | 0.640 | 21 (60.0%) | 20 (48.8%) | 0.363 |
| Treatment with AAP(s)c | 30 (71.4%) | 31 (86.1%) | 0.170 | 24 (68.6%) | 27 (65.9%) | 1.000 |
Notes: Data expressed as the mean ± standard deviation
P-values were determined by Student’s t-test or Fisher’s exact test
values in parentheses indicate the percentages in smokers and nonsmokers, respectively
values in parentheses indicate the percentages among the subjects with each genotype.
Abbreviations: AAP(s), atypical antipsychotics except for aripiprazole; BMI, body mass index; GST, glutathione S-transferase.
Acknowledgments
The authors wish to thank all of the study participants. This work was supported by grants from the Japan Research Foundation for Clinical Pharmacology, the Research Group for Schizophrenia, and KAKENHI (23510348, 24590652, 25860117), and in part by a grant from the Smoking Research Foundation. The authors thank Yoshiyuki Tsuda and Motoki Imamura for their help with the DNA extraction and genotyping polymorphisms.
Footnotes
Disclosure
The authors report no conflicts of interest in this work.
References
- 1.Laursen TM, Munk-Olsen T, Vestergaard M. Life expectancy and cardiovascular mortality in persons with schizophrenia. Curr Opin Psychiatry. 2012;25:83–88. doi: 10.1097/YCO.0b013e32835035ca. [DOI] [PubMed] [Google Scholar]
- 2.Srihari VH, Phutane VH, Ozkan B, et al. Cardiovascular mortality in schizophrenia: defining a critical period for prevention. Schizophr Res. 2013;146:64–68. doi: 10.1016/j.schres.2013.01.014. [DOI] [PMC free article] [PubMed] [Google Scholar]
- 3.Suttajit S, Pilakanta S. Prevalence of metabolic syndrome and its association with depression in patients with schizophrenia. Neuropsychiatr Dis Treat. 2013;9:941–946. doi: 10.2147/NDT.S47450. [DOI] [PMC free article] [PubMed] [Google Scholar]
- 4.Vancampfort D, Probst M, Scheewe T, et al. Relationships between physical fitness, physical activity, smoking and metabolic and mental health parameters in people with schizophrenia. Psychiatry Res. 2013;207:25–32. doi: 10.1016/j.psychres.2012.09.026. [DOI] [PubMed] [Google Scholar]
- 5.De Hert M, Detraux J, van Winkel R, Yu W, Correll CU. Metabolic and cardiovascular adverse effects associated with antipsychotic drugs. Nat Rev Endocrinol. 2012;8:114–126. doi: 10.1038/nrendo.2011.156. [DOI] [PubMed] [Google Scholar]
- 6.de Araujo AN, de Sena EP, de Oliveira IR, Juruena MF. Antipsychotic agents: efficacy and safety in schizophrenia. Drug Healthc Patient Saf. 2012;4:173–180. doi: 10.2147/DHPS.S37429. [DOI] [PMC free article] [PubMed] [Google Scholar]
- 7.Boden R, Edman G, Reutfors J, Ostenson CG, Osby U. A comparison of cardiovascular risk factors for ten antipsychotic drugs in clinical practice. Neuropsychiatr Dis Treat. 2013;9:371–377. doi: 10.2147/NDT.S40554. [DOI] [PMC free article] [PubMed] [Google Scholar]
- 8.Newcomer JW. Metabolic considerations in the use of antipsychotic medications: a review of recent evidence. J Clin Psychiatry. 2007;68(Suppl 1):S20–S27. [PubMed] [Google Scholar]
- 9.Schorr SG, Slooff CJ, Bruggeman R, Taxis K. The incidence of metabolic syndrome and its reversal in a cohort of schizophrenic patients followed for one year. J Psychiatr Res. 2009;43:1106–1111. doi: 10.1016/j.jpsychires.2009.03.002. [DOI] [PubMed] [Google Scholar]
- 10.De Hert M, van Winkel R, Van Eyck D, et al. Prevalence of diabetes, metabolic syndrome and metabolic abnormalities in schizophrenia over the course of the illness: a cross-sectional study. Clin Pract Epidemiol Ment Health. 2006;2:14. doi: 10.1186/1745-0179-2-14. [DOI] [PMC free article] [PubMed] [Google Scholar]
- 11.Ryan MC, Collins P, Thakore JH. Impaired fasting glucose tolerance in first-episode, drug-naive patients with schizophrenia. Am J Psychiatry. 2003;160:284–289. doi: 10.1176/appi.ajp.160.2.284. [DOI] [PubMed] [Google Scholar]
- 12.Spelman LM, Walsh PI, Sharif N, Collins P, Thakore JH. Impaired glucose tolerance in first-episode drug-naive patients with schizophrenia. Diabet Med. 2007;24:481–485. doi: 10.1111/j.1464-5491.2007.02092.x. [DOI] [PubMed] [Google Scholar]
- 13.Verma SK, Subramaniam M, Liew A, Poon LY. Metabolic risk factors in drug-naive patients with first-episode psychosis. J Clin Psychiatry. 2009;70:997–1000. doi: 10.4088/JCP.08m04508. [DOI] [PubMed] [Google Scholar]
- 14.Lett TA, Wallace TJ, Chowdhury NI, Tiwari AK, Kennedy JL, Muller DJ. Pharmacogenetics of antipsychotic-induced weight gain: review and clinical implications. Mol Psychiatry. 2012;17:242–266. doi: 10.1038/mp.2011.109. [DOI] [PubMed] [Google Scholar]
- 15.Expert Panel on Detection E Treatment of High Blood Cholesterol in A. Executive Summary of the Third Report of the National Cholesterol Education Program (NCEP) Expert Panel on Detection, Evaluation, and Treatment of High Blood Cholesterol in Adults (Adult Treatment Panel III) JAMA. 2001;285:2486–2497. doi: 10.1001/jama.285.19.2486. [DOI] [PubMed] [Google Scholar]
- 16.Grundy SM, Cleeman JI, Daniels SR, et al. Diagnosis and management of the metabolic syndrome: an American Heart Association/National Heart, Lung, and Blood Institute Scientific Statement. Circulation. 2005;112:2735–2752. doi: 10.1161/CIRCULATIONAHA.105.169404. [DOI] [PubMed] [Google Scholar]
- 17.Lear SA, Toma M, Birmingham CL, Frohlich JJ. Modification of the relationship between simple anthropometric indices and risk factors by ethnic background. Metabolism. 2003;52:1295–1301. doi: 10.1016/s0026-0495(03)00196-3. [DOI] [PubMed] [Google Scholar]
- 18.Tan CE, Ma S, Wai D, Chew SK, Tai ES. Can we apply the National Cholesterol Education Program Adult Treatment Panel definition of the metabolic syndrome to Asians? Diabetes Care. 2004;27:1182–1186. doi: 10.2337/diacare.27.5.1182. [DOI] [PubMed] [Google Scholar]
- 19.Ruskovska T, Bernlohr DA. Oxidative stress and protein carbonylation in adipose tissue – implications for insulin resistance and diabetes mellitus. J Proteomics. 2013 Apr 11; doi: 10.1016/j.jprot.2013.04.002. [Epub ahead of print.] [DOI] [PMC free article] [PubMed] [Google Scholar]
- 20.Codoner-Franch P, Valls-Belles V, Arilla-Codoner A, Alonso-Iglesias E. Oxidant mechanisms in childhood obesity: the link between inflammation and oxidative stress. Transl Res. 2011;158:369–384. doi: 10.1016/j.trsl.2011.08.004. [DOI] [PubMed] [Google Scholar]
- 21.Montero D, Walther G, Perez-Martin A, Roche E, Vinet A. Endothelial dysfunction, inflammation, and oxidative stress in obese children and adolescents: markers and effect of lifestyle intervention. Obes Rev. 2012;13:441–455. doi: 10.1111/j.1467-789X.2011.00956.x. [DOI] [PubMed] [Google Scholar]
- 22.Barter P. HDL-C: role as a risk modifier. Atheroscler Suppl. 2011;12:267–270. doi: 10.1016/S1567-5688(11)70885-6. [DOI] [PubMed] [Google Scholar]
- 23.Kontush A, Chapman MJ. Functionally defective high-density lipoprotein: a new therapeutic target at the crossroads of dyslipidemia, inflammation, and atherosclerosis. Pharmacol Rev. 2006;58:342–374. doi: 10.1124/pr.58.3.1. [DOI] [PubMed] [Google Scholar]
- 24.Ginsberg G, Smolenski S, Hattis D, Guyton KZ, Johns DO, Sonawane B. Genetic polymorphism in glutathione transferases (GST): population distribution of GSTM1, T1, and P1 conjugating activity. J Toxicol Environ Health B Crit Rev. 2009;12:389–439. doi: 10.1080/10937400903158375. [DOI] [PubMed] [Google Scholar]
- 25.Hayes JD, Flanagan JU, Jowsey IR. Glutathione transferases. Annu Rev Pharmacol Toxicol. 2005;45:51–88. doi: 10.1146/annurev.pharmtox.45.120403.095857. [DOI] [PubMed] [Google Scholar]
- 26.Ji JD, Lee WJ. Association between the polymorphisms of glutathione S-transferase genes and rheumatoid arthritis: a meta-analysis. Gene. 2013;521:155–159. doi: 10.1016/j.gene.2013.03.023. [DOI] [PubMed] [Google Scholar]
- 27.Hori M, Oniki K, Ueda K, et al. Combined glutathione S-transferase T1 and M1 positive genotypes afford protection against type 2 diabetes in Japanese. Pharmacogenomics. 2007;8:1307–1314. doi: 10.2217/14622416.8.10.1307. [DOI] [PubMed] [Google Scholar]
- 28.Kariz S, Nikolajevic Starcevic J, Petrovic D. Association of manganese superoxide dismutase and glutathione S-transferases genotypes with myocardial infarction in patients with type 2 diabetes mellitus. Diabetes Res Clin Pract. 2012;98:144–150. doi: 10.1016/j.diabres.2012.07.003. [DOI] [PubMed] [Google Scholar]
- 29.Santl Letonja M, Letonja M, Ikolajevic-Starcevic JN, Petrovic D. Association of manganese superoxide dismutase and glutathione S-transferases genotypes with carotid atherosclerosis in patients with diabetes mellitus type 2. Int Angiol. 2012;31:33–41. [PubMed] [Google Scholar]
- 30.Oniki K, Hori M, Saruwatari J, et al. Interactive effects of smoking and glutathione S-transferase polymorphisms on the development of non-alcoholic fatty liver disease. Toxicol Lett. 2013;220:143–149. doi: 10.1016/j.toxlet.2013.04.019. [DOI] [PubMed] [Google Scholar]
- 31.Fukai T, Ushio-Fukai M. Superoxide dismutases: role in redox signaling, vascular function, and diseases. Antioxid Redox Signal. 2011;15:1583–1606. doi: 10.1089/ars.2011.3999. [DOI] [PMC free article] [PubMed] [Google Scholar]
- 32.Sutton A, Imbert A, Igoudjil A, et al. The manganese superoxide dismutase Ala 16 Val dimorphism modulates both mitochondrial import and mRNA stability. Pharmacogenet Genomics. 2005;15:311–319. doi: 10.1097/01213011-200505000-00006. [DOI] [PubMed] [Google Scholar]
- 33.Tian C, Fang S, Du X, Jia C. Association of the C47T polymorphism in SOD2 with diabetes mellitus and diabetic microvascular complications: a meta-analysis. Diabetologia. 2011;54:803–811. doi: 10.1007/s00125-010-2004-5. [DOI] [PubMed] [Google Scholar]
- 34.Bitanihirwe BK, Woo TU. Oxidative stress in schizophrenia: an integrated approach. Neurosci Biobehav Rev. 2011;35:878–893. doi: 10.1016/j.neubiorev.2010.10.008. [DOI] [PMC free article] [PubMed] [Google Scholar]
- 35.Wu JQ, Kosten TR, Zhang XY. Free radicals, antioxidant defense systems, and schizophrenia. Prog Neuropsychopharmacol Biol Psychiatry. 2013;46:200–206. doi: 10.1016/j.pnpbp.2013.02.015. [DOI] [PubMed] [Google Scholar]
- 36.Zhang XY, Yao JK. Oxidative stress and therapeutic implications in psychiatric disorders. Prog Neuropsychopharmacol Biol Psychiatry. 2013;46:197–199. doi: 10.1016/j.pnpbp.2013.03.003. [DOI] [PubMed] [Google Scholar]
- 37.Park YM, Lee HJ, Kang SG, Choi JE, Cho JH, Kim L. Lack of association between glutathione S-transferase-M1, -T1, and -P1 polymorphisms and olanzapine-induced weight gain in Korean schizophrenic patients. Psychiatry Investig. 2010;7:147–152. doi: 10.4306/pi.2010.7.2.147. [DOI] [PMC free article] [PubMed] [Google Scholar]
- 38.Sugawara N, Yasui-Furukori N, Sato Y, et al. Prevalence of metabolic syndrome among patients with schizophrenia in Japan. Schizophr Res. 2010;123:244–250. doi: 10.1016/j.schres.2010.08.030. [DOI] [PubMed] [Google Scholar]
- 39.Watanabe I, Tomita A, Shimizu M, et al. A study to survey susceptible genetic factors responsible for troglitazone-associated hepatotoxicity in Japanese patients with type 2 diabetes mellitus. Clin Pharmacol Ther. 2003;73:435–455. doi: 10.1016/s0009-9236(03)00014-6. [DOI] [PubMed] [Google Scholar]
- 40.Nisa H, Kono S, Yin G, et al. Cigarette smoking, genetic polymorphisms and colorectal cancer risk: the Fukuoka Colorectal Cancer Study. BMC Cancer. 2010;10:274. doi: 10.1186/1471-2407-10-274. [DOI] [PMC free article] [PubMed] [Google Scholar]
- 41.Teranishi M, Uchida Y, Nishio N, et al. Polymorphisms in genes involved in oxidative stress response in patients with sudden sensorineural hearing loss and Meniere’s disease in a Japanese population. DNA Cell Biol. 2012;31:1555–1562. doi: 10.1089/dna.2012.1631. [DOI] [PMC free article] [PubMed] [Google Scholar]
- 42.Maciel SS, Pereira Ada C, Silva GJ, Rodrigues MV, Mill JG, Krieger JE. Association between glutathione S-transferase polymorphisms and triglycerides and HDL-cholesterol. Atherosclerosis. 2009;206:204–208. doi: 10.1016/j.atherosclerosis.2009.02.011. [DOI] [PubMed] [Google Scholar]
- 43.Di Pietro G, Magno LA, Rios-Santos F. Glutathione S-transferases: an overview in cancer research. Expert Opin Drug Metab Toxicol. 2010;6:153–170. doi: 10.1517/17425250903427980. [DOI] [PubMed] [Google Scholar]
- 44.Zhang J, Liu H, Yan H, Huang G, Wang B. Null genotypes of GSTM1 and GSTT1 contribute to increased risk of diabetes mellitus: a metaanalysis. Gene. 2013;518:405–411. doi: 10.1016/j.gene.2012.12.086. [DOI] [PubMed] [Google Scholar]
- 45.Kropp S, Kern V, Lange K, et al. Oxidative stress during treatment with first- and second-generation antipsychotics. J Neuropsychiatry Clin Neurosci. 2005;17:227–231. doi: 10.1176/jnp.17.2.227. [DOI] [PubMed] [Google Scholar]
- 46.Pillai A, Parikh V, Terry AV, Jr, Mahadik SP. Long-term antipsychotic treatments and crossover studies in rats: differential effects of typical and atypical agents on the expression of antioxidant enzymes and membrane lipid peroxidation in rat brain. J Psychiatr Res. 2007;41:372–386. doi: 10.1016/j.jpsychires.2006.01.011. [DOI] [PubMed] [Google Scholar]
Associated Data
This section collects any data citations, data availability statements, or supplementary materials included in this article.
Supplementary Materials
Table S1.
Demographic and clinical characteristics according to GSTM1 genotype in patients with schizophrenia and controls
| Schizophrenia (n=154)
|
Controls (n=203)
|
|||||
|---|---|---|---|---|---|---|
| GSTM1 present genotype | GSTM1 null genotype | Pa | GSTM1 present genotype | GSTM1 null genotype | Pa | |
| Numberb | 77 (50.0%) | 77 (50.0%) | – | 104 (51.2%) | 99 (48.8%) | – |
| Age (years) | 47.5±14.8 | 52.9±15.4 | 0.027 | 52.6±9.2 | 52.1±8.8 | 0.701 |
| Malec | 41 (53.2%) | 39 (50.6%) | 0.872 | 58 (55.8%) | 59 (59.6%) | 0.670 |
| Smokerc | 42 (54.5%) | 36 (46.8%) | 0.420 | 22 (22.2%) | 21 (20.2%) | 0.735 |
| Height (cm) | 161.8±8.4 | 161.5±8.5 | 0.844 | 162.4±9.5 | 163.4±8.3 | 0.436 |
| Weight (kg) | 66.1±13.9 | 64.1±13.3 | 0.360 | 60.6±11.6 | 62.9±10.0 | 0.127 |
| BMI (kg/m2) | 25.1±4.2 | 24.4±4.0 | 0.297 | 22.9±3.3 | 23.5±3.1 | 0.136 |
| Overweightc | 34 (44.2%) | 38 (49.4%) | 0.628 | 26 (25.0%) | 23 (23.2%) | 0.870 |
| Metabolic syndromec | 16 (20.8%) | 18 (23.4%) | 0.846 | 9 (8.7%) | 6 (6.1%) | 0.595 |
| Waist circumference (cm) | 87.3±12.4 | 84.9±11.3 | 0.203 | 82.2±8.3 | 83.5±7.8 | 0.260 |
| Systolic blood pressure (mmHg) | 123.0±14.5 | 128.8±17.9 | 0.027 | 116.6±16.8 | 117.7±15.7 | 0.642 |
| Diastolic blood pressure (mmHg) | 75.9±10.4 | 77.7±13.4 | 0.345 | 71.4±11.1 | 74.4±10.8 | 0.056 |
| High-density lipoprotein (mg/dL) | 53.9±15.1 | 50.3±13.9 | 0.122 | 65.2±16.4 | 65.9±18.2 | 0.768 |
| Triglycerides (mg/dL) | 151.4±119.1 | 146.5±156.6 | 0.828 | 122.1±104.1 | 119.8±68.1 | 0.851 |
| Fasting blood glucose (mg/dL) | 102.9±36.7 | 103.1±27.6 | 0.974 | 95.2±18.8 | 97.4±21.5 | 0.437 |
| Outpatientsc | 50 (64.9%) | 43 (55.8%) | 0.323 | – | – | – |
| Treatment with AAP(s)c | 54 (70.1%) | 58 (75.3%) | 0.588 | – | – | – |
Notes: Data expressed as the mean ± standard deviation
P-values were determined by Student’s t-test or Fisher’s exact test
values in parentheses indicate percentages in patients with schizophrenia and controls, respectively
values in parentheses indicate percentages among the subjects with each genotype.
Abbreviations: AAP(s), atypical antipsychotics except for aripiprazole; BMI, body mass index; GST, glutathione S-transferase.
Table S2.
Demographic and clinical characteristics according to GSTT1 genotype in patients with schizophrenia and controls
| Schizophrenia (n=154)
|
Controls (n=203)
|
|||||
|---|---|---|---|---|---|---|
| GSTT1 present genotype | GSTT1 null genotype | Pa | GSTT1 present genotype | GSTT1 null genotype | Pa | |
| Numberb | 86 (55.8%) | 68 (44.2%) | – | 104 (51.2%) | 99 (48.8%) | – |
| Age (years) | 50.1±15.0 | 50.4±15.7 | 0.904 | 51.6±9.4 | 53.1±8.5 | 0.233 |
| Malec | 46 (53.5%) | 34 (50.0%) | 0.746 | 64 (61.5%) | 53 (53.5%) | 0.259 |
| Smokerc | 42 (48.8%) | 36 (52.9%) | 0.630 | 26 (25.0%) | 17 (17.2%) | 0.229 |
| Height (cm) | 160.6±8.1 | 163.0±8.6 | 0.080 | 163.9±8.0 | 161.8±9.7 | 0.087 |
| Weight (kg) | 64.2±12.8 | 66.3±14.5 | 0.324 | 62.6±10.3 | 60.8±11.4 | 0.235 |
| BMI (kg/m2) | 24.8±4.1 | 24.8±4.0 | 0.969 | 23.2±2.9 | 23.1±3.4 | 0.852 |
| Overweightc | 40 (46.5%) | 32 (47.1%) | 1.000 | 24 (23.1%) | 25 (25.3%) | 0.745 |
| Metabolic syndromec | 17 (19.8%) | 17 (25.0%) | 0.442 | 5 (4.8%) | 10 (10.1%) | 0.184 |
| Waist circumference (cm) | 85.6±12.1 | 86.8±11.8 | 0.529 | 83.1±7.6 | 82.6±8.6 | 0.648 |
| Systolic blood pressure (mmHg) | 125.0±16.9 | 127.1±16.0 | 0.447 | 117.5±16.5 | 116.8±16.0 | 0.775 |
| Diastolic blood pressure (mmHg) | 75.6±10.9 | 78.3±13.2 | 0.157 | 73.3±11.3 | 72.4±10.7 | 0.531 |
| High-density lipoprotein (mg/dL) | 53.1±16.1 | 50.9±12.5 | 0.335 | 64.1±16.7 | 67.1±17.7 | 0.215 |
| Triglycerides (mg/dL) | 134.8±93.9 | 166.9±179.3 | 0.184 | 125.0±101.6 | 116.8±71.6 | 0.508 |
| Fasting blood glucose (mg/dL) | 101.3±23.1 | 105.2±41.3 | 0.467 | 95.7±17.7 | 96.9±22.4 | 0.662 |
| Outpatientsc | 55 (64.0%) | 38 (55.9%) | 0.324 | – | – | – |
| Treatment with AAP(s)c | 61 (70.9%) | 51 (45.5%) | 0.591 | – | – | – |
Notes: Data expressed as the mean ± standard deviation
P-values were determined by Student’s t-test or Fisher’s exact test
values in parentheses indicate percentages in patients with schizophrenia and controls, respectively
values in parentheses indicate the percentages among the subjects with each genotype.
Abbreviations: AAP(s), atypical antipsychotics except for aripiprazole; BMI, body mass index; GST, glutathione S-transferase.
Table S3.
Demographic and clinical characteristics according to SOD2 genotype in patients with schizophrenia and controls
| Schizophrenia (n=154)
|
Controls (n=203)
|
|||||
|---|---|---|---|---|---|---|
| Val/Val | Ala/Val, Ala/Ala | Pa | Val/Val | Ala/Val, Ala/Ala | Pa | |
| Numberb | 113 (73.4%) | 41 (26.6%) | – | 153 (75.4%) | 50 (24.6%) | – |
| Age (years) | 49.5±15.2 | 52.2±15.6 | 0.334 | 52.4±9.0 | 52.3±8.8 | 0.993 |
| Malec | 59 (52.2%) | 21 (51.2%) | 1.000 | 88 (57.5%) | 29 (58.0%) | 1.000 |
| Smokerc | 57 (50.4%) | 21 (51.2%) | 1.000 | 34 (22.2%) | 9 (18.0%) | 0.690 |
| Height (cm) | 162.0±8.4 | 160.8±8.5 | 0.417 | 163.0±9.2 | 162.4±8.2 | 0.688 |
| Weight (kg) | 65.7±13.4 | 63.6±14.1 | 0.406 | 61.9± 11.1 | 61.2±10.3 | 0.711 |
| BMI (kg/m2) | 24.9±4.1 | 24.4±4.0 | 0.526 | 23.2±3.1 | 23.2±3.4 | 0.996 |
| Overweightc | 55 (48.7%) | 17 (41.5%) | 0.469 | 34 (22.2%) | 15 (30.0%) | 0.261 |
| Metabolic syndromec | 24 (21.2%) | 10 (24.4%) | 0.666 | 11 (7.2%) | 4 (8.0%) | 0.765 |
| Waist circumference (cm) | 86.7±11.6 | 84.8± 12.9 | 0.391 | 82.8±8.0 | 83.1 ±8.5 | 0.827 |
| Systolic blood pressure (mmHg) | 124.6± 15.5 | 129.5±18.7 | 0.142 | 117.3±15.7 | 116.8±17.8 | 0.856 |
| Diastolic blood pressure (mmHg) | 76.5±11.4 | 77.7± 13.5 | 0.573 | 72.9± 11.1 | 72.6± 10.9 | 0.858 |
| High-density lipoprotein (mg/dL) | 51.3±14.0 | 54.4± 16.2 | 0.231 | 65.0±17.4 | 67.1 ±16.7 | 0.460 |
| Triglycerides (mg/dL) | 150.7± 148.4 | 144.3±108.7 | 0.802 | 119.8±72.3 | 124.7± 125.8 | 0.732 |
| Fasting blood glucose (mg/dL) | 102.6±31.2 | 104.2±35.7 | 0.780 | 96.9±21.0 | 94.4±17.2 | 0.447 |
| Outpatientsc | 69 (61.1%) | 24 (58.5%) | 0.853 | – | – | – |
| Treatment with AAP(s)c | 84 (74.3%) | 28 (68.3%) | 0.540 | – | – | – |
Notes: Data expressed as the mean ± standard deviation;
P-values were determined by student’s t-test or Fisher’s exact test;
values in parentheses indicate percentages in patients with schizophrenia and controls, respectively;
values in parentheses indicate the percentages among the subjects with each genotype.
Abbreviations: AAP(s), atypical antipsychotics except for aripiprazole; BMi, body mass index; SOD2, superoxide dismutase.
Table S4.
Demographic and clinical characteristics according to the combination of GSTM1 and GSTT1 genotypes in the overall population of patients with schizophrenia
| GSTM1 and GSTT1 genotypes | M1 present/T1 present | M1 null/T1 present | M1 present/T1 null | M1 null/T1 null | Pa |
|---|---|---|---|---|---|
| Numberb | 49 (31.8%) | 37 (24.0%) | 28 (18.2%) | 40 (26.0%) | – |
| Age (years) | 49.2±15.1 | 51.3±15.1 | 44.6±13.9 | 54.4±15.7 | 0.064 |
| Malec | 28 (57.1%) | 18 (48.6%) | 13 (46.4%) | 21 (52.5%) | 0.802 |
| Smokersc | 23 (46.9%) | 19 (51.4%) | 19 (67.9%) | 17 (42.5%) | 0.203 |
| Height (cm) | 161.1±7.8 | 160.0±8.6 | 163.1±9.4 | 163.0±8.2 | 0.332 |
| Weight (kg) | 64.4±13.1 | 63.9±12.7 | 69.2±15.0 | 64.4±14.0 | 0.381 |
| BMI (kg/m2) | 24.7±4.1 | 24.9±4.3 | 25.8±4.2 | 24.0±3.7 | 0.338 |
| Overweightc | 20 (40.8%) | 20 (54.1%) | 14 (50.0%) | 18 (45.0%) | 0.660 |
| Metabolic syndromec | 7 (14.3%) | 10 (27.0%) | 9 (32.1%) | 8 (20.0%) | 0.252 |
| Waist circumference (cm) | 85.5±12.3 | 85.8±12.0 | 90.7±12.2 | 84.1±10.8 | 0.142 |
| Systolic blood pressure (mmHg) | 123.2±16.3 | 127.4±17.7 | 122.6±11.1 | 130.2±18.2 | 0.144 |
| Diastolic blood pressure (mmHg) | 74.8±10.3 | 76.6±11.6 | 77.8±10.4 | 78.8±14.9 | 0.463 |
| High-density lipoprotein (mg/dL) | 56.0±15.8 | 49.2±15.8 | 50.2±13.5 | 51.3±12.0 | 0.132 |
| Triglycerides (mg/dL) | 128.8±75.7 | 142.8±114.3 | 191.0±165.0 | 150.0±188.9 | 0.299 |
| Fasting glucose (mg/dL) | 99.4±23.7 | 103.9±22.4 | 109.1±52.3 | 102.4±31.9 | 0.652 |
| Outpatientsc | 31 (63.3%) | 24 (64.9%) | 19 (67.9%) | 19 (47.5%) | 0.284 |
| Treatment with AAP(s)c | 36 (73.5%) | 25 (67.6%) | 18 (64.3%) | 33 (82.5%) | 0.308 |
Notes: Data expressed as the mean ± standard deviation
P-values were determined by analysis of variance or Fisher’s exact test
values in parentheses indicate percentages in GSTM1 present/T1 present, M1 null/T1 present, M1 present/T1 null, M1 null/T1 null genotypes, respectively
values in parentheses indicate percentages among the subjects with each genotype.
Abbreviations: AAP(s), atypical antipsychotics except for aripiprazole; BMI, body mass index; GST, glutathione S-transferase.
Table S5.
Demographic and clinical characteristics according to the combination of GSTM1 and GSTT1 genotypes in the overall population of controls
| GSTM1 and GSTT1 genotypes | M1 present/T1 present | M1 null/T1 present | M1 present/T1 null | M1 null/T1 null | Pa |
|---|---|---|---|---|---|
| Numberb | 50 (24.6%) | 54 (26.6%) | 54 (26.6%) | 45 (22.2%) | – |
| Age (years) | 51.8±9.2 | 51.4±9.6 | 53.3±9.2 | 52.9±7.6 | 0.679 |
| Malec | 30 (60.0%) | 34 (63.0%) | 28 (51.9%) | 25 (55.6%) | 0.676 |
| Smokerc | 12 (24.0%) | 14 (25.9%) | 9 (16.7%) | 8 (17.8%) | 0.618 |
| Height (cm) | 163.4±8.1 | 164.4±8.0 | 161.4±10.6 | 162.2±8.7 | 0.333 |
| Weight (kg) | 62.4±10.1 | 62.8±10.6 | 58.9±12.7 | 63.0±9.4 | 0.177 |
| BMI (kg/m2) | 23.3±3.1 | 23.2±2.8 | 22.4±3.4 | 24.0±3.3 | 0.123 |
| Overweightc | 13 (26.0%) | 11 (20.4%) | 13 (24.1%) | 12 (26.7%) | 0.872 |
| Metabolic syndromec | 3 (6.0%) | 2 (3.7%) | 6 (11.1%) | 4 (8.9%) | 0.487 |
| Waist circumference (cm) | 84.1±7.5 | 82.2±7.6 | 80.5±8.7 | 85.1±7.9 | 0.023 |
| Systolic blood pressure (mmHg) | 118.9±17.4 | 116.2±15.7 | 114.6±16.1 | 119.6±15.6 | 0.371 |
| Diastolic blood pressure (mmHg) | 73.2±11.6 | 73.5±11.2 | 69.8±10.4 | 75.4±10.4 | 0.075 |
| High-density lipoprotein (mg/dL) | 63.0±16.8 | 65.1±16.7 | 67.3±15.8 | 66.9±20.0 | 0.583 |
| Triglycerides (mg/dL) | 134.9±129.4 | 115.8±66.4 | 110.3±72.5 | 124.6±70.4 | 0.515 |
| Fasting glucose (mg/dL) | 93.9±8.6 | 97.4±23.2 | 96.5±24.7 | 97.5±19.6 | 0.790 |
Notes: Data expressed as the mean ± standard deviation.
P-values were determined by analysis of variance or Fisher’s exact test
values in parentheses indicate percentages in GSTM1 present/T1 present, M1 null/T1 present, M1 present/T1 null, and M1 null/T1 null genotypes, respectively
values in parentheses indicate the percentages among subjects with each genotype.
Abbreviations: BMI, body mass index; GST, glutathione S-transferase.
Table S6.
Statistical power of associations between the genotypes and risk of metabolic abnormalities in patients with schizophrenia and smokers with schizophrenia at a significance (alpha) level of 0.05 (two-tailed) and adequate effect sizes (ie, odds ratios 2.0, 3.0, and 4.0) based on the sample size of the study and observed frequencies of the genotypes and metabolic abnormalities
| All patients with schizophrenia (n=154)
|
Smokers with schizophrenia (n=78)
|
|||||||
|---|---|---|---|---|---|---|---|---|
|
GSTM1 null genotype
|
GSTT1 null genotype
|
SOD2 Val/Val genotype
|
GSTM1 null genotype
|
|||||
| OR 2.0 | OR 3.0 | OR 2.0 | OR 3.0 | OR 2.0 | OR 3.0 | OR 3.0 | OR 4.0 | |
| Overweight | 56% | 90% | 55% | 90% | 46% | 83% | 63% | 81% |
| MetS | 43% | 75% | 41% | 75% | 32% | 56% | 55% | 72% |
| Abnormal waist circumference | 56% | 90% | 55% | 90% | 49% | 85% | 66% | 82% |
| Elevated blood pressure | 55% | 89% | 55% | 89% | 45% | 79% | 63% | 81% |
| Decreased HDL cholesterol | 52% | 87% | 51% | 87% | 40% | 73% | 62% | 78% |
| Elevated triglycerides | 50% | 85% | 49% | 85% | 39% | 70% | 57% | 76% |
| Elevated fasting glucose | 53% | 88% | 53% | 88% | 42% | 76% | 59% | 76% |
Notes: Frequencies of GSTM1 null, GSTT1 null, and SOD2 Val/Val genotypes were fixed as 50.0%, 44.2%, and 73.4%, respectively, and those of overweight, MetS, abnormal waist circumference, elevated blood pressure, decreased HDL cholesterol, elevated triglycerides, and elevated fasting glucose were fixed as 47%, 22%, 55%, 41%, 34%, 31%, and 37%, respectively.
Abbreviations: MetS, metabolic syndrome; HDL, high density lipoprotein; GST, glutathione S-transferase; SOD2, superoxide dismutase 2; OR, odds ratio.
Table S7.
Demographic and clinical characteristics according to the GSTM1 genotypes in smokers and nonsmokers among patients with schizophrenia
| Smokers (n=78)
|
Nonsmokers (n=76)
|
|||||
|---|---|---|---|---|---|---|
| GSTM1 present genotype | GSTM1 null genotype | Pa | GSTM1 present genotype | GSTM1 null genotype | Pa | |
| Numberb | 42 (53.8%) | 36 (46.2%) | – | 35 (46.1%) | 41 (53.9%) | – |
| Age (years) | 45.5±13.8 | 52.7±15.3 | 0.033 | 49.9±15.7 | 53.2±15.7 | 0.371 |
| Malec | 29 (69.0%) | 27 (75.0%) | 0.620 | 12 (34.3%) | 12 (29.3%) | 0.805 |
| Height (cm) | 163.9±8.4 | 164.1±8.75 | 0.893 | 159.3±7.9 | 159.3±7.6 | 0.969 |
| Weight (kg) | 66.8±15.5 | 67.7±13.8 | 0.796 | 65.3±11.8 | 61.0±12.1 | 0.121 |
| BMI (kg/m2) | 24.7±4.3 | 25.0±3.86 | 0.751 | 25.7±4.0 | 24.0±4.1 | 0.071 |
| Overweightc | 14 (33.3%) | 18 (50.0%) | 0.169 | 20 (57.1%) | 20 (48.8%) | 0.498 |
| Metabolic syndromec | 11 (26.2%) | 12 (33.3%) | 0.619 | 5 (14.3%) | 6 (14.6%) | 1.000 |
| Waist circumference (cm) | 87.1±13.6 | 87.1±11.1 | 0.985 | 87.7±11.0 | 83.0±11.3 | 0.076 |
| Systolic blood pressure (mmHg) | 122.3±13.5 | 127.3±15.7 | 0.132 | 123.8±15.8 | 130.2±19.8 | 0.131 |
| Diastolic blood pressure (mmHg) | 75.6±11.2 | 77.0±11.4 | 0.582 | 76.3±9.4 | 78.4±15.0 | 0.481 |
| High-density lipoprotein (mg/dL) | 53.5±15.8 | 45.8±13.6 | 0.026 | 54.5±14.6 | 54.2±13.1 | 0.931 |
| Triglycerides (mg/dL) | 156.7±105.6 | 172.2±205.0 | 0.670 | 145.1±134.9 | 124.0±93.2 | 0.426 |
| Fasting blood glucose (mg/dL) | 97.2±21.6 | 106.3±34.9 | 0.164 | 109.8±48.6 | 100.3±19.0 | 0.252 |
| Outpatientsc | 29 (69.0%) | 23 (63.9%) | 0.640 | 21 (60.0%) | 20 (48.8%) | 0.363 |
| Treatment with AAP(s)c | 30 (71.4%) | 31 (86.1%) | 0.170 | 24 (68.6%) | 27 (65.9%) | 1.000 |
Notes: Data expressed as the mean ± standard deviation
P-values were determined by Student’s t-test or Fisher’s exact test
values in parentheses indicate the percentages in smokers and nonsmokers, respectively
values in parentheses indicate the percentages among the subjects with each genotype.
Abbreviations: AAP(s), atypical antipsychotics except for aripiprazole; BMI, body mass index; GST, glutathione S-transferase.