

Abstract
Skeletal muscle is a very dynamic tissue, thus accurate quantification of skeletal muscle stiffness throughout its functional range is crucial to improve the physical functioning and independence following pathology. Shear wave elastography (SWE) is an ultrasound-based technique that characterizes tissue mechanical properties based on the propagation of remotely induced shear waves. The objective of this study is to validate SWE throughout the functional range of motion of skeletal muscle for three ultrasound transducer orientations. We hypothesized that combining traditional materials testing (MTS) techniques with SWE measurements will show increased stiffness measures with increasing tensile load, and will correlate well with each other for trials in which the transducer is parallel to underlying muscle fibers. To evaluate this hypothesis, we monitored the deformation throughout tensile loading of four porcine brachialis whole-muscle tissue specimens, while simultaneously making SWE measurements of the same specimen. We used regression to examine the correlation between Young's modulus from MTS and shear modulus from SWE for each of the transducer orientations. We applied a generalized linear model to account for repeated testing. Model parameters were estimated via generalized estimating equations. The regression coefficient was 0.1944, with a 95% confidence interval of (0.1463 – 0.2425) for parallel transducer trials. Shear waves did not propagate well for both the 45° and perpendicular transducer orientations. Both parallel SWE and MTS showed increased stiffness with increasing tensile load. This study provides the necessary first step for additional studies that can evaluate the distribution of stiffness throughout muscle.
Keywords: Ultrasonography, passive stiffness, materials testing, elastic moduli, shear wave elastography
1. Introduction
Normal skeletal muscle stiffness results from active tension produced by muscle contraction and passive tension produced largely by connective tissue (Hill, 1938; Huxley, 1957). While the manifestations of deficits in the active component are readily diagnosed and unmistakably detrimental to daily function (NIMSD Consortium, 1996; Fried et al, 2001), analogous alterations in the passive component are less understood. This apparent lack of information should not imply that passive skeletal muscle stiffness does not play a key role in skeletal muscle growth, metabolism, or function – as it is integral for all three (Jaspers et al, 1999; Kjaer, 2004; Tatsumi et al, 2006; Werle, 2008). Numerous in vitro studies have identified the connective tissue network of collagen within the extracellular matrix (ECM) as a key contributor to passive stiffness in a variety of skeletal muscles (Bensamoun et al, 2006; Borg and Caulfield, 1980; S. H. Brown et al, 2012; Rowe et al, 2010). It is becoming increasingly apparent that the ECM is vital for mechanotransduction, as well as muscle growth and adaptation (Jaspers et al., 1999; Kjaer, 2004; Tatsumi et al, 2006; Werle, 2008). Later research indicates that passive stiffness may also play a role in muscle performance and adaptation to exercise (Fouré et al, 2011). Increased collagen content and stiffness are seen in numerous musculoskeletal pathologies, including spasticity (M. Brown et al, 1999; Damiano et al, 2001; Gracies, 2005; Vaz et al., 2006), as well as typical aging (Alnaqeeb et al, 1984; Botelho et al, 1954; Larsson et al, 1979; Tomonaga, 1977). It is clear that muscle stiffness is closely related to joint constraint – increased muscle stiffness is associated with poor range of motion, while reductions in muscle stiffness may predispose to joint subluxation (Johns and Wright, 1962; Vandervoort, 1999). Unfortunately, in vivo passive stiffness measures historically focused primarily on either qualitative measures (Park and Kwon, 2012) or the stiffness of entire joints and muscle groups (Sinkjaer and Magnussen, 1994), thus limiting the advancement of our clinical and scientific understanding. Reliable, noninvasive, quantitative techniques for measuring and monitoring skeletal muscle stiffness are necessary not only to advance our understanding of the mechanism and effects of altered skeletal muscle stiffness but also to improve diagnosis and treatment following injury.
A number of techniques are currently available for monitoring muscle stiffness in vivo. Myotonometry is quick and inexpensive, but tends to be superficial or merely qualitative (Bizzini and Mannion, 2003; Park and Kwon, 2012). Stretch-release techniques elegantly distinguish the stretch reflex stiffness from intrinsic joint stiffness (Sinkjaer et al., 1988), but are unable to quantify the mechanical properties of individual skeletal muscles. Similarly, range of motion measures can quantify resistance to movement, but also evaluates the properties of entire joints and are unable to target individual muscles for assessment (Rabita et al., 2005). Magnetic resonance elastography shows great promise for quantifying the stiffness of whole muscles and muscle groups across a range of ages and contraction levels (Debernard et al, 2011a; 2011b), but is costly and lacks real-time application (Jenkyn et al, 2003). Ultrasound shows great utility in evaluating underlying architecture of more superficial muscles (Rutherford and Jones, 1992), and a variety of techniques have been used to evaluate muscle stiffness (Park and Kwon, 2012), even in concert with magnetic resonance elastography (Debernard et al, 2013), but, until recently, ultrasound has been purely qualitative. As skeletal muscle is a very dynamic tissue, an ideal technique would be capable of real-time measurement to quantify skeletal muscle stiffness throughout its functional range. Such a technique should be sensitive to small changes in stiffness and capable of determining material properties in light of the functionally relevant and often complex skeletal muscle architecture.
Quantitative ultrasound elastography is beginning to emerge as a promising diagnostic tool for evaluating the mechanical properties of skeletal muscle. Unlike earlier qualitative ultrasound elastography techniques, Shear wave elastography (SWE) is an ultrasound-based technique that can characterize tissue mechanical properties based on the propagation of remotely induced shear waves (Bercoff et al, 2004; Chen et al., 2009; Palmeri et al., 2008; Sarvazyan et al, 1998). Shear modulus can be readily calculated from the measured shear wave propagation velocity and tissue density (Yamakoshi et al., 1990). A variety of ultrasound-based elastography techniques have been compared with magnetic resonance elastography, with good agreement in a variety of tissues and phantoms (Bensamoun et al, 2008; Dutt et al, 2000; Oudry et al., 2009). Several investigators have begun to apply similar ultrasound techniques and it is clear that increased skeletal muscle force production is associated with increased stiffness (Gennisson et al, 2005; 2010; Shinohara et al, 2010; Zhao et al, 2009). While these experiments are of great value, up until now no study has compared ultrasound elastography results with traditional materials testing for skeletal muscle. To ensure investigators are obtaining robust and meaningful results, baseline reliability and validity information must be obtained for the application of such novel techniques to anisotropic and inhomogeneous skeletal muscle tissue. Gennisson and colleagues found that shear waves propagate much more readily along beef muscle fibers longitudinally, as compared to perpendicularly or any interval of rotation therein (Gennisson et al, 2003). Later investigations support these initial findings, as parallel transducer orientations obtained the most reliable measures of muscle elasticity (Gennisson et al, 2010). Despite the recent advances applying ultrasound elasticity imaging to skeletal muscle, these techniques are yet to be validated taking into account the mobility and dynamic properties of skeletal muscle. The purpose of this study was to validate SWE throughout the functional range of motion of skeletal muscle. We hypothesized that combining traditional materials testing techniques with SWE measurements will show increased stiffness measures with increasing tensile load, and will correlate well with each other throughout the tensile range when the ultrasound transducer is oriented parallel to the muscle fibers.
2. Methods
Specimen Preparation
We obtained four right brachialis whole-muscle samples immediately post-mortem from 6- to 9-month old female swine. All animal care was in accordance with the Mayo Clinic Institutional Animal Care and Use Committee guidelines. We completed all muscle testing within five hours of sacrifice, so rigor mortis was not expected to play a significant role in the mechanical testing (van Ee et al, 2000). At the time of sacrifice, all animals were euthanized with injections of telazol (2.5 cc, 100 mg/ml), heparin (10 cc, 1000 units/ml), and Fatal Plus (Vortech Pharmaceuticals, Dearborn, MI; 15 cc, pentobarbital sodium: 390 mg/ml, propylene glycol: 0.01 mg/ml, ethyl alcohol: 0.26 mg/ml, benzyl alcohol 0.2 mg/ml). Following dissection and visualization of the intact brachialis, we flexed the forelimb in situ to 90° and fully extended to 180° at the elbow to establish the muscle's initial (L0) and final (L1) lengths, respectively. Both lengths were obtained by measuring from origin, just under the humeral head, to insertion, on the fused radius and ulna. We then harvested the intact brachialis from origin to insertion, preserving and harvesting both bony attachments to facilitate later mechanical testing. In the interest of facilitating material testing and to control for individual variability between swine, we did not retain surrounding soft tissues (adjacent musculature, overlying adipose tissue and skin, etc.) Following harvest, we kept the muscle tissue cool and moist with chilled saline. Prior to testing, both the proximal humeral attachment and distal radioulnar attachment were placed in collars and fixed with bone cement (polymethylmethacrylate).
Materials Testing
We mounted the specimen on a materials testing machine (model 312; MTS, Minneapolis, MN) for simultaneous tensile testing and SWE ultrasound evaluation, as indicated in Figure 1. The collars holding the humeral and radioulnar bone segments were fixed vertically on the actuator using custom-designed attachments, replicating the normal anatomic relationship between the two bones. We used the materials testing system (MTS) to stretch the tissue specimen to its initial length, as previously measured in situ at 90° flexion. We manually measured the thickness and width of the muscle at mid-belly, assuming an ellipse, to estimate cross-sectional area (CSA) in the location where SWE measurements would be taken. The same individual obtained all measurements throughout the study to reduce variability. Each specimen underwent displacement-controlled tensile testing from initial length to final length, at ∼1.15% L0 per second, with simultaneous ultrasound measurements. A load cell (model 3397; Lebow Products, Troy, MI; Accuracy: 0.05%) measured force throughout the testing procedure. We collected all MTS force and displacement data at 20 Hz. The specimen was preconditioned for 6 cycles prior to tensile testing using the same loading protocol. We conducted all testing at room temperature (22° C) and kept the specimen moist with saline and held at L0 between each tensile test, as previously documented for similar studies (Gottsauner-Wolf et al, 1995). A digital output signal sent from the MTS to the Verasonics ultrasound system (Verasonics Inc., Redmond, WA) triggered and synchronized ultrasound SWE measures with MTS data acquisition. The digital output signal began with the start of MTS displacement and immediately triggered the first Verasonics acquisition, which we programmed to automatically acquire additional measures every 1.5 – 2.0 seconds, depending on the loading rate and overall displacement. We obtained ten ultrasound measures at regular, prescribed intervals throughout each continuous tensile test.
Figure 1.
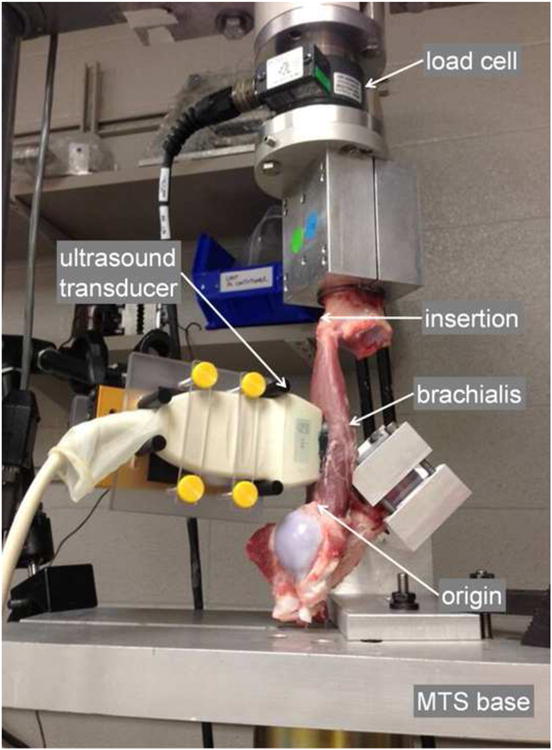
Experimental set-up. Ultrasound transducer aligned with long axis of the brachialis. Bone segments for proximal and distal attachment sites are embedded in bone cement and fixed to the MTS base and load cell, respectively. L0 and L1 measured between arrowheads indicating origin and insertion, with the elbow at 90° and 180°, respectively. Axial tensile testing begins as the MTS base is translated away from the load cell, stretching the brachialis from L0 to L1.
From the collected MTS data, we calculated strain by dividing the displacement data by initial length, and plotted the stress-strain curve, using CSA calculated from the initial measurements. We defined Young's modulus as the slope between ten consecutive MTS data points from the stress-strain curve. Using this approach, Young's modulus was calculated for each of the ten SWE time points.
Shear Wave Elastography
Prior to tensile testing, we fixed a linear-array ultrasound transducer (L7-4, center frequency = 5 MHz, Philips Healthcare, Andover, MA) over the middle third of the muscle specimen. We attached the transducer to a custom-built device that maintained constant, minimal pressure between the ultrasound transducer and the underlying muscle tissue throughout each tensile test. Since all mechanical testing was well-within the submaximal range, we tested multiple transducer orientations for each muscle specimen. By gross inspection and brief B-mode ultrasound examination, we determined that the majority of fibers in the swine brachialis were aligned parallel with the long axis of the muscle. We manipulated the alignment of the transducer with respect to the long axis of the muscle, testing three orientations: ultrasound transducer aligned 1) parallel, 2) at a 45° angle, and 3) perpendicularly, as indicated in Figure 2, along with sample B-mode images to demonstrate underlying muscle structure. We made all ultrasound measures at the midsection of the muscle belly to limit the effects of regional alterations in structure or stiffness. We repeated measures five times for each transducer orientation, for a total of 15 trials with each muscle sample. A focused ultrasound “push” beam (fixed focal depth at mid-depth of the muscle sample, push duration = 600 μs, center frequency = 4.1 MHz) transmitted by 40 elements of the transducer generated shear waves in the muscle tissue specimen as shown in Figure 3. After the push, the Verasonics system immediately switched to flash imaging mode and used the same transducer to detect propagation of the shear waves for about 20 ms at a frame rate of 7.6 kHz. Shear wave particle velocity signal at the focal depth of the push beam was averaged over 10 wavelengths (corresponding to an axial range of 3 mm along the beam axis to improve signal-to-noise ratio. Shear wave speed was then estimated using a time-to-peak method at different lateral distance (lateral range of shear wave data analysis is about 15 mm) from the push beam center through linear regression (Palmeri et al, 2008). Finally, shear modulus throughout the tensile range of each muscle specimen was converted from the shear wave speed measurements using Equation (1):
Figure 2.
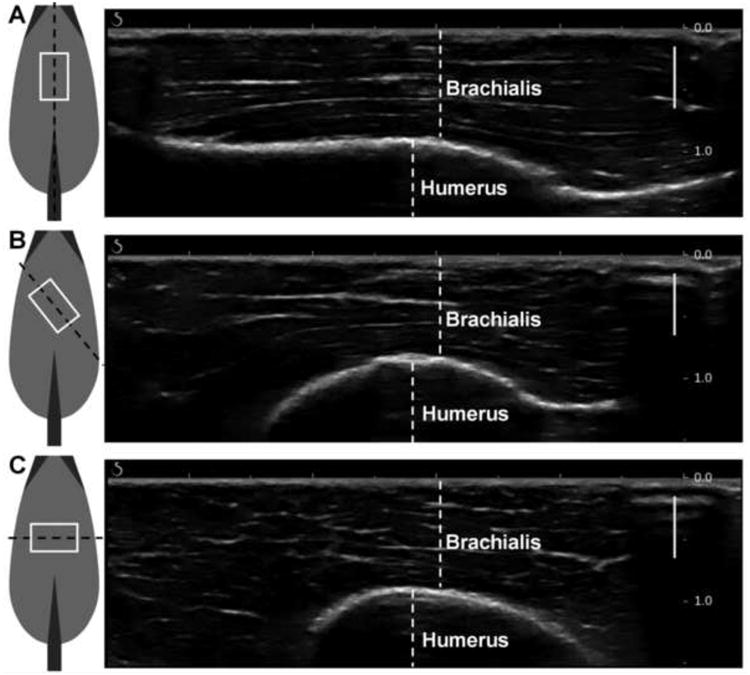
Ultrasound transducer orientations over brachialis muscle, with sample B-mode images acquired using the Aixplorer ultrasound system in the MSK/Superficial MSK mode to demonstrate underlying muscle structure. Ultrasound transducer coming out of the page, white box indicates ultrasound transducer footprint, black dashed line indicates imaging plane. (A) parallel, demonstrating muscle fibers running right-to-left. (B) 45°, (C) perpendicular, demonstrating muscle fibers visible in cross-section. Solid bars indicate focusing range. Scale (on right) in cm.
Figure 3.
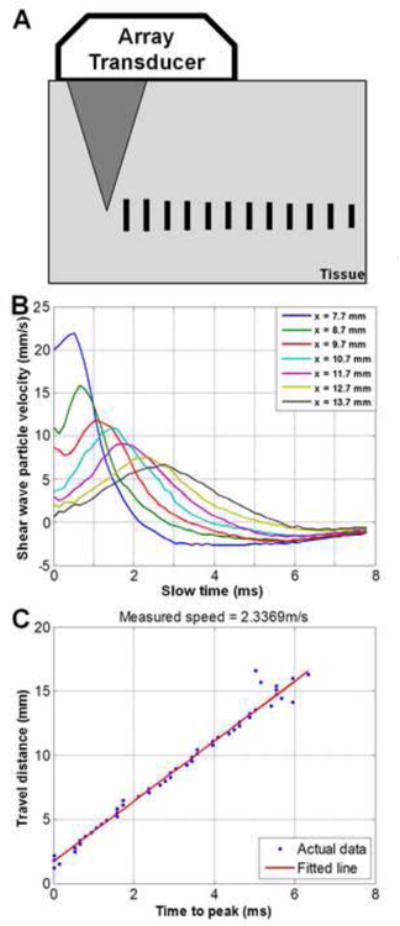
Shear wave elastography and time-to-peak fitting. A) Focused ultrasound “push” beam generates shear waves in the muscle tissue specimen. The same transducer monitors the time-to-peak of shear wave displacements at different lateral distances, indicated by vertical bars. B) Example of shear waveform propagation across a lateral range of approximately 6 mm. (Slow time indicates time-direction of shear wave propagation; x represents lateral distance to the initial “push” beam.) C) Example of time-to-peak fitting of waveforms, obtained via linear regression.
| (1) |
where μ is shear modulus, cs is shear wave propagation velocity, and ρ is density, which can be assumed to be 1000 kg/m3 for all soft tissues.
Sample B-mode images are included in Figure 2. We acquired these via the Aixplorer (SuperSonic Imagine, Aix-en-Provence, France) ultrasound system, using the SL15-4 transducer in the MSK/Superficial MSK mode (center frequency = 8.5 MHz). We used this additional imaging system to obtain B-mode images that clearly demonstrate the underlying tissue organization. It was necessary to use the Verasonics equipment to ensure proper synchronization between the SWE measures and the MTS force and displacement data, which is not available on the Aixplorer machine. Furthermore, the Verasonics equipment enabled us to control the focal depth of the push beam so that strong shear waves could be generated at the region of interest from which the most robust shear wave speed measurements could be achieved using a 1D time-to-peak fitting technique. For these reasons, we used the Verasonics system for SWE measurements in this study.
Data Analysis
We used regression to examine the correlation between Young's modulus from MTS and shear modulus from SWE for each of the transducer orientations. However, as we tested every muscle specimen multiple times for each axial loading trial, individual data points were not independent of each other and thus conducting a simple linear regression was not possible. To account for repeated testing of each muscle specimen, we used a generalized linear model to run the regression. We estimated the parameters for the model using generalized estimating equations (GEE) via the GENMOD procedure in Statistical Analysis Software version 9.3 (SAS Institute Inc., Cary, NC). GEE are designed to optimally weight observations from repeated-measures data sets to accurately estimate regression parameters, and thus were well-suited for this analysis (Liang and Zeger, 1986; Zeger and Liang, 1986). The GENMOD procedure, using the “repeated” statement, properly accounts for the repeated testing of this study, though does not output a typical coefficient of determination. For this reason, we manually calculated the goodness-of-fit R2 statistic using Equation 2:
| (2) |
where ŷi are the values predicted by the GENMOD procedure, ȳ is the mean of all observations, and yi are the observations (Moore et al, 2012).
3. Results
All four brachialis specimens displayed similar trends throughout tensile testing and were thus grouped together for subsequent analysis. The descriptive statistics for the four swine brachialis specimens are included in Table 1. Young's moduli increased with increasing displacement throughout the tensile test for all specimens, as demonstrated by the representative set of elastic moduli-displacement curves are included in Figure 4. All other specimens displayed similar behavior. Shear moduli also increased with increasing strain for trials utilizing parallel ultrasound transducer orientation. Only slight increases were seen with either 45° or perpendicular transducer orientations.
Table 1.
Descriptive statistics for four swine specimen. Swine mass taken immediately prior to sacrifice; brachialis muscle lengths obtained at time of harvest; CSA obtained during mechanical testing.
| Specimen ID | Animal mass (kg) | Initial length (mm) | Final length (mm) | Muscle CSA (mm2) |
|---|---|---|---|---|
| 1 | 90 | 130 | 160 | 981.75 |
| 2 | 95 | 130 | 160 | 1040.65 |
| 3 | 50 | 110 | 130 | 706.86 |
| 4 | 60 | 115 | 135 | 725.71 |
Figure 4.
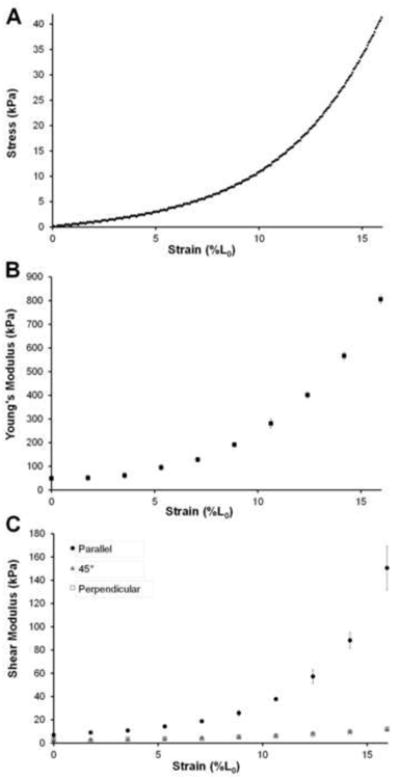
Moduli data from a representative sample for specimen #3. A) Stress-strain curve obtained from MTS test. B) Mean Young's moduli data, measured based on the stress-strain curve in (A) throughout tensile test from all 15 loading trials. Error bars indicate ±SD. C) Mean shear moduli data throughout tensile test for each of the three transducer orientations. Error bars indicate ±SD.
GEE analyses of all observations from all four specimens are included in Table 2. These results indicate a significant correlation between Young's modulus and shear modulus for parallel transducer orientation (p < 0.0001). The regression coefficient was 0.1944, with a 95% confidence interval of (0.1463 – 0.2425). Scatterplots of all Young's moduli and shear moduli from the parallel transducer trials, with associated generalized linear model regression lines, are included in Figure 5. The parameters for 45° and perpendicular transducer orientations were near zero and nonsignificant (0.0061; p = 0.1077, and 0.0043; p = 0.2435, respectively).
Figure 5.
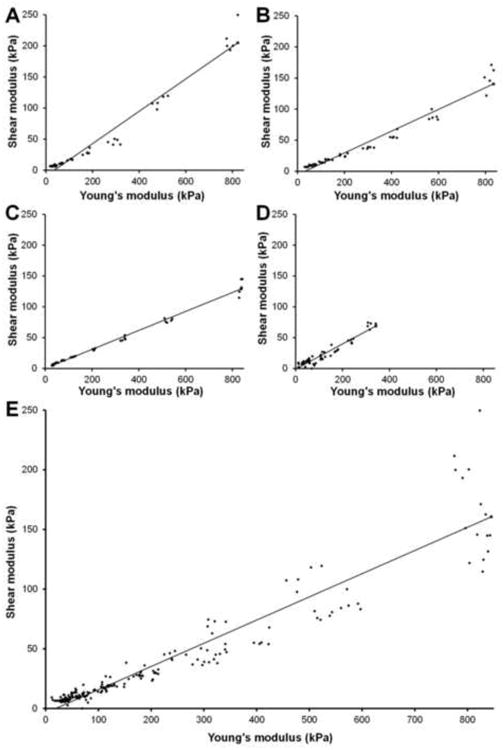
Scatterplots of elastic moduli (Shear modulus, G; Young's modulus, E) for parallel ultrasound transducer trials. Generalized linear model regression line obtained from generalized estimating equations analysis. A) Specimen #1. G = 0.2602 E – 9.1963; R2= 0.9651. B) Specimen #2. G = 0.1539 E +0.1928; R2= 0.9884. C) Specimen #3. G = 0.1750 E – 5.4259; R2= 0.9577. D) Specimen #4. G = 0.2044 E – 1.0085; R2= 0.9160. E) All trials from all 4 specimens combined. G = 0.1944 E – 3.6760.
4. Discussion
As hypothesized, both parallel SWE and MTS showed increased stiffness measures with increasing tensile load. These techniques also correlated well with each other throughout the tensile range, as indicated by the GEE parameter estimate for shear modulus obtained with parallel transducer orientation. The notable discrepancy between shear modulus (via SWE) and Young's modulus (via MTS) for 45° and perpendicular ultrasound transducer orientations was well-anticipated, as it is understood that shear waves propagate much more readily along fibers rather than across them (Gennisson et al, 2003). These findings illustrate the necessity to closely consider muscle architecture when making ultrasound elastography measures.
Numerous structural aspects of the swine brachialis made it very well-suited for this investigation. As tendon compliance may contribute significantly to increases in length for muscle-tendon units under tension (Herbert et al, 2011; 2002), it was important to minimize the opportunities for tendon strain in this investigation. The swine brachialis has negligible tendon at both the origin and insertion, which allowed us to reasonably assume minimal tendon strain. As seen in Figure 1, the swine brachialis originated on the humerus just distal to the humeral head, and had only one head of origin, unlike the two often seen in humans (Leonello et al, 2007). The fibers converged distally to a very short aponeurosis where the brachialis inserted into the ulna, which is fused with the radius in swine. By both gross inspection and ultrasound evaluation, we found the brachialis to have largely parallel fiber orientation, similar to other quadruped mammals such as the canine, as well as humans (Hulse et al, 2010; Leonello et al, 2007; Lieber et al, 1992).
The findings from this study compare well with those from earlier work by Gennisson and colleagues evaluating skeletal muscle throughout normal range of motion. Their study applied similar technologies to human biceps muscle for elbow angles ranging from 90° to 165°, reporting shear moduli values ranging from 5.40 kPa at 90° to 29.54 kPa at 165° for parallel transducer trials. The present study evaluating swine brachialis found a mean shear modulus 5.81 kPa at L0, which corresponds to an elbow angle of 90°. The relationship between shear modulus (reported as elasticity in Gennisson's paper) and elbow angle is very similar to that of the present study, between shear modulus and strain, demonstrated in Figure 4c (Gennisson et al., 2010).
More detailed interpretation of shear modulus results from SWE is difficult. It is clear that the shear moduli values obtained from off-axis ultrasound trials are only minimally related to Young's modulus during physiologically-relevant axial loading. As skeletal muscle may be considered transversely isotropic (Morrow et al, 2010), it is perhaps only accurate to report shear modulus, as calculated from shear wave speed, when the ultrasound transducer and subsequent shear wave propagation are aligned longitudinally with the underlying muscle fibers. In an ultrasound study where the transducer is not aligned with the muscle fibers, it may be more accurate to report only shear wave speed, rather than converting to shear modulus, as Equation (1) no longer holds in these cases (Royer et al, 2011). Furthermore, from a physiologic standpoint, the shear wave speed and associated shear modulus are perhaps most relevant when aligned longitudinally with muscle fibers, as this may represent the mechanism by which mechanical forces are transmitted throughout tissue, allowing skeletal muscles to perform work (Huijing, 1999; Purslow, 2002; Sharafi and Blemker, 2010).
This study makes several assumptions, some of which may be considered technical limitations in the study design. Young's moduli estimations are based on CSA measures that were assumed to be constant throughout the tensile test. Additionally, Young's moduli estimations are based on global strain measures, throughout the entire muscle tissue – rather than local strain measures, obtained in the area corresponding to that where ultrasound measures were obtained. While these assumptions are incorrect, we expect the changes in strain measure would be minimal and determined it to be an acceptable limitation given current practices. The ultrasound transducer orientation trials assumed a majority of the muscle fibers were parallel to the muscle line of action. Gross evaluation of each muscle sample using B-mode ultrasound imaging indicate this is a reasonable assumption, though no previous investigations have established the precise pennation and architecture of the swine brachialis. This study also assume near-constant material properties throughout skeletal muscle, as it compares whole-muscle Young's modulus to local shear modulus values. It is possible that intramuscular stiffness values differ with proximity to origin and insertion tendons, surrounding tissues, or intramuscular fascia. We chose to make ultrasound measures at the midsection of the muscle belly to limit the effects of regional alterations in stiffness, though inherent variations may still be present. Additionally, using dissected pre-rigor swine muscle tissue as an analog for living human muscle may be considered flawed. However, the benefits gained from these in vitro experiments directly comparing Young's modulus and shear modulus far outweigh any limitations that may arise when applying these findings to designing and evaluating a study that involves human muscle. Furthermore, the strong correlation between shear modulus and Young's modulus throughout the entire loading curve indicate that local SWE measures at mid-belly are as meaningful as whole-muscle measures.
The present investigation provides the first step for additional studies that can evaluate the distribution of both passive and active stiffness throughout a muscle. Evaluating a variety of muscles and loading profiles would further elucidate the nature of the relationship between Young's modulus and shear modulus; More complex muscle architecture should be thoroughly evaluated to further outline the relationship between muscle structure and ECM and passive stiffness assessed via SWE. Finally, materials testing results should be compared with in vivo measurements to elucidate the potential attenuation effects of overlying tissues.
In conclusion, this study demonstrates valid SWE shear modulus results may be obtained throughout the normal range of tension for appendicular skeletal muscle. The orientation of the ultrasound transducer plays a key role in obtaining meaningful results.
Acknowledgments
The authors thank Lawrence Berglund for technical assistance. This work was supported in part by NIH grant number TR000136 and T32 GM065841 - Medical Scientist Training Program at Mayo Clinic.
Footnotes
Conflict of interest statement: The authors do not have any financial or personal relationships to disclose that could have inappropriately biased this work.
Publisher's Disclaimer: This is a PDF file of an unedited manuscript that has been accepted for publication. As a service to our customers we are providing this early version of the manuscript. The manuscript will undergo copyediting, typesetting, and review of the resulting proof before it is published in its final citable form. Please note that during the production process errors may be discovered which could affect the content, and all legal disclaimers that apply to the journal pertain.
References
- 1.Alnaqeeb MA, Zaid al NS, Goldspink G. Connective tissue changes and physical properties of developing and ageing skeletal muscle. Journal of Anatomy. 1984;139(Pt 4):677–89. [PMC free article] [PubMed] [Google Scholar]
- 2.Bensamoun SF, Stevens L, Fleury M, Goubel F, Tho MH. Macroscopic-microscopic characterization of the passive mechanical properties in rat soleus muscle. Journal of Biomechanics. 2006;39:568–578. doi: 10.1016/j.jbiomech.2004.04.036. [DOI] [PubMed] [Google Scholar]
- 3.Bensamoun SF, Wang L, Robert L, Charleux F, Latrive J, Tho MH. Measurement of liver stiffness with two imaging techniques: magnetic resonance elastography and ultrasound elastometry. Journal of Magnetic Resonance Imaging : JMRI. 2008;28:1287–92. doi: 10.1002/jmri.21523. [DOI] [PubMed] [Google Scholar]
- 4.Bercoff J, Tanter M, Fink M. Supersonic shear imaging: a new technique for soft tissue elasticity mapping. IEEE Transactions on Ultrasonics, Ferroelectrics, and Frequency Control. 2004;51:396–409. doi: 10.1109/tuffc.2004.1295425. [DOI] [PubMed] [Google Scholar]
- 5.Bizzini M, Mannion AF. Reliability of a new, hand-held device for assessing skeletal muscle stiffness. Clinical Biomechanics. 2003;18:459–61. doi: 10.1016/s0268-0033(03)00042-1. [DOI] [PubMed] [Google Scholar]
- 6.Borg TK, Caulfield JB. Morphology of connective tissue in skeletal muscle. Tissue & Cell. 1980;12:197–207. doi: 10.1016/0040-8166(80)90061-0. [DOI] [PubMed] [Google Scholar]
- 7.Botelho SY, Cander L, Guiti N. Passive and active tension-length diagrams of intact skeletal muscle in normal women of different ages. Journal of Applied Physiology. 1954;7:93–8. doi: 10.1152/jappl.1954.7.1.93. [DOI] [PubMed] [Google Scholar]
- 8.Brown M, Fisher JS, Salsich G. Stiffness and muscle function with age and reduced muscle use. Journal of Orthopaedic Research. 1999;17:409–14. doi: 10.1002/jor.1100170317. [DOI] [PubMed] [Google Scholar]
- 9.Brown SH, Carr JA, Ward SR, Lieber RL. Passive mechanical properties of rat abdominal wall muscles suggest an important role of the extracellular connective tissue matrix. Journal of Orthopaedic Research. 2012;30:1321–1326. doi: 10.1002/jor.22068. [DOI] [PMC free article] [PubMed] [Google Scholar]
- 10.Chen S, Urban MW, Pislaru C, Kinnick R, Zheng Y, Yao A, Greenleaf JF. Shearwave dispersion ultrasound vibrometry (SDUV) for measuring tissue elasticity and viscosity. IEEE Transactions on Ultrasonics, Ferroelectrics, and Frequency Control. 2009;56:55–62. doi: 10.1109/TUFFC.2009.1005. [DOI] [PMC free article] [PubMed] [Google Scholar]
- 11.Damiano DL, Quinlivan J, Owen BF, Shaffrey M, Abel MF. Spasticity versus strength in cerebral palsy: relationships among involuntary resistance, voluntary torque, and motor function. European Journal of Neurology. 2001;8(5):40–9. doi: 10.1046/j.1468-1331.2001.00037.x. [DOI] [PubMed] [Google Scholar]
- 12.Debernard L, Robert L, Charleux F, Bensamoun SF. Analysis of thigh muscle stiffness from childhood to adulthood using magnetic resonance elastography (MRE) technique. Clinical Biomechanics. 2011a;26:836–40. doi: 10.1016/j.clinbiomech.2011.04.004. [DOI] [PubMed] [Google Scholar]
- 13.Debernard L, Robert L, Charleux F, Bensamoun SF. Characterization of muscle architecture in children and adults using magnetic resonance elastography and ultrasound techniques. Journal of Biomechanics. 2011b;44:397–401. doi: 10.1016/j.jbiomech.2010.10.025. [DOI] [PubMed] [Google Scholar]
- 14.Debernard L, Robert L, Charleux F, Bensamoun SF. A possible clinical tool to depict muscle elasticity mapping using magnetic resonance elastography. Muscle & Nerve. 2013;47:903–8. doi: 10.1002/mus.23678. [DOI] [PubMed] [Google Scholar]
- 15.Dutt V, Kinnick RR, Muthupillai R, Oliphant TE, Ehman RL, Greenleaf JF. Acoustic shear-wave imaging using echo ultrasound compared to magnetic resonance elastography. Ultrasound in Medicine & Biology. 2000;26:397–403. doi: 10.1016/s0301-5629(99)00166-0. [DOI] [PubMed] [Google Scholar]
- 16.Fouré A, Nordez A, McNair P, Cornu C. Effects of plyometric training on both active and passive parts of the plantarflexors series elastic component stiffness of muscle-tendon complex. European Journal of Applied Physiology. 2011;111:539–548. doi: 10.1007/s00421-010-1667-4. [DOI] [PubMed] [Google Scholar]
- 17.Fried LP, Tangen CM, Walston J, Newman AB, Hirsch C, Gottdiener J, Seeman T, Tracy R, Kop WJ, Burke G, McBurnie MA. Frailty in older adults: evidence for a phenotype. The Journals of Gerontology Series A, Biological Sciences and Medical Sciences. 2001;56:M146–56. doi: 10.1093/gerona/56.3.m146. [DOI] [PubMed] [Google Scholar]
- 18.Gennisson J, Catheline S, Chaffaï S, Fink M. Transient elastography in anisotropic medium: application to the measurement of slow and fast shear wave speeds in muscles. The Journal of the Acoustical Society of America. 2003;114:536–41. doi: 10.1121/1.1579008. [DOI] [PubMed] [Google Scholar]
- 19.Gennisson J, Cornu C, Catheline S, Fink M, Portero P. Human muscle hardness assessment during incremental isometric contraction using transient elastography. Journal of Biomechanics. 2005;38:1543–50. doi: 10.1016/j.jbiomech.2004.07.013. [DOI] [PubMed] [Google Scholar]
- 20.Viscoelastic and anisotropic mechanical properties of in vivo muscle tissue assessed by supersonic shear imaging. Ultrasound in Medicine & Biology. 36:789–801. doi: 10.1016/j.ultrasmedbio.2010.02.013. [DOI] [PubMed] [Google Scholar]
- 21.Gottsauner-Wolf F, Grabowski JJ, Chao EY, An KN. Effects of freeze/thaw conditioning on the tensile properties and failure mode of bone-muscle-bone units: a biomechanical and histological study in dogs. Journal of Orthopaedic Research. 1995;13:90–5. doi: 10.1002/jor.1100130114. [DOI] [PubMed] [Google Scholar]
- 22.Gracies J. Pathophysiology of spastic paresis. I: Paresis and soft tissue changes. Muscle & Nerve. 2005;31:535–51. doi: 10.1002/mus.20284. [DOI] [PubMed] [Google Scholar]
- 23.Herbert RD, Clarke J, Kwah LK, Diong J, Martin J, Clark EC, Bilston LE, Gandevia SC. In vivo passive mechanical behaviour of muscle fascicles and tendons in human gastrocnemius muscle-tendon units. The Journal of Physiology. 2011;589:5257–67. doi: 10.1113/jphysiol.2011.212175. [DOI] [PMC free article] [PubMed] [Google Scholar]
- 24.Herbert RD, Clarke J, Kwah LK, Diong J, Martin J, Clark EC, Bilston LE, Gandevia SC. Change in length of relaxed muscle fascicles and tendons with knee and ankle movement in humans. The Journal of Physiology. 2002;539:637–45. doi: 10.1113/jphysiol.2001.012756. [DOI] [PMC free article] [PubMed] [Google Scholar]
- 25.Hill A. The heat of shortening and the dynamic constants of muscle. Proceedings of the Royal Society of London Series B. 1938;126:136–95. [Google Scholar]
- 26.Huijing PA. Muscle as a collagen fiber reinforced composite: a review of force transmission in muscle and whole limb. Journal of Biomechanics. 1999;32:329–45. doi: 10.1016/s0021-9290(98)00186-9. [DOI] [PubMed] [Google Scholar]
- 27.Hulse D, Young B, Beale B, Kowaleski M, Vannini R. Relationship of the biceps- brachialis complex to the medial coronoid process of the canine ulna. Veterinary and Comparative Orthopaedics and Traumatology. 2010;23:173–6. doi: 10.3415/VCOT-09-06-0063. [DOI] [PubMed] [Google Scholar]
- 28.Huxley AF. Muscle structure and theories of contraction. Progress in Biophysics and Biophysical Chemistry. 1957;7:255–318. [PubMed] [Google Scholar]
- 29.Jaspers RT, Brunner R, Pel JJ, Huijing PA. Acute effects of intramuscular aponeurotomy on rat gastrocnemius medialis: force transmission, muscle force and sarcomere length. Journal of Biomechanics. 1999;32:71–9. doi: 10.1016/s0021-9290(98)00159-6. [DOI] [PubMed] [Google Scholar]
- 30.Jenkyn TR, Ehman RL, An K. Noninvasive muscle tension measurement using the novel technique of magnetic resonance elastography (MRE) Journal of Biomechanics. 2003;36:1917–21. doi: 10.1016/s0021-9290(03)00005-8. [DOI] [PubMed] [Google Scholar]
- 31.Johns R, Wright V. Relative importance of various tissues in joint stiffness. Journal of Applied Physiology 1962 [Google Scholar]
- 32.Kjaer M. Role of extracellular matrix in adaptation of tendon and skeletal muscle to mechanical loading. Physiological Reviews. 2004;84:649–98. doi: 10.1152/physrev.00031.2003. [DOI] [PubMed] [Google Scholar]
- 33.Larsson L, Grimby G, Karlsson J. Muscle strength and speed of movement in relation to age and muscle morphology. Journal of applied physiology: respiratory, environmental and exercise physiology. 1979;46:451–6. doi: 10.1152/jappl.1979.46.3.451. [DOI] [PubMed] [Google Scholar]
- 34.Leonello DT, Galley IJ, Bain GI, Carter CD. Brachialis muscle anatomy. A study in cadavers. The Journal of Bone and Joint Surgery. 2007;89:1293–7. doi: 10.2106/JBJS.F.00343. [DOI] [PubMed] [Google Scholar]
- 35.Liang K, Zeger SL. Longitudinal data analysis using generalized linear models. Biometrika. 1986;73:13–22. [Google Scholar]
- 36.Lieber RL, Jacobson MD, Fazeli BM, Abrams RA, Botte MJ. Architecture of selected muscles of the arm and forearm: anatomy and implications for tendon transfer. The Journal of Hand Surgery. 1992;17:787–98. doi: 10.1016/0363-5023(92)90444-t. [DOI] [PubMed] [Google Scholar]
- 37.Moore DS, McCabe GP, Craig BP. Introduction to the Practice of Statistics. 7. W.H. Freeman and Company; New York: 2012. [Google Scholar]
- 38.Morrow DA, Donahue TL, Odegard GM, Kaufman KR. Transversely isotropic tensile material properties of skeletal muscle tissue. Journal of the Mechanical Behavior of Biomedical Materials. 2010;3:124–9. doi: 10.1016/j.jmbbm.2009.03.004. [DOI] [PMC free article] [PubMed] [Google Scholar]
- 39.NIMSD Consortium; Muscular weakness assessment: use of normal isometric strength data. The National Isometric Muscle Strength (NIMS) Database Consortium. Archives of Physical Medicine and Rehabilitation. 1996;77:1251–5. doi: 10.1016/s0003-9993(96)90188-4. [DOI] [PubMed] [Google Scholar]
- 40.Oudry J, Chen J, Glaser KJ, Miette V, Sandrin L, Ehman RL. Cross-validation of magnetic resonance elastography and ultrasound-based transient elastography: A preliminary phantom study. Journal of Magnetic Resonance Imaging. 2009;30:1145–1150. doi: 10.1002/jmri.21929. [DOI] [PMC free article] [PubMed] [Google Scholar]
- 41.Palmeri ML, Wang MH, Dahl JJ, Frinkley KD, Nightingale KR. Quantifying hepatic shear modulus in vivo using acoustic radiation force. Ultrasound in Medicine & Biology. 2008;34:546–58. doi: 10.1016/j.ultrasmedbio.2007.10.009. [DOI] [PMC free article] [PubMed] [Google Scholar]
- 42.Park G, Kwon DR. Sonoelastographic evaluation of medial gastrocnemius muscles intrinsic stiffness after rehabilitation therapy with botulinum toxin a injection in spastic cerebral palsy. Archives of Physical Medicine and Rehabilitation. 2012;93:2085–9. doi: 10.1016/j.apmr.2012.06.024. [DOI] [PubMed] [Google Scholar]
- 43.Purslow PP. The structure and functional significance of variations in the connective tissue within muscle. Comparative Biochemistry and Physiology Part A, Molecular & Integrative Physiology. 2002;133:947–66. doi: 10.1016/s1095-6433(02)00141-1. [DOI] [PubMed] [Google Scholar]
- 44.Rabita G, Dupont L, Thevenon A, Lensel-Corbeil G, Pérot C, Vanvelcenaher J. Quantitative assessment of the velocity-dependent increase in resistance to passive stretch in spastic plantarflexors. Clinical Biomechanics. 2005;20:745–53. doi: 10.1016/j.clinbiomech.2005.04.002. [DOI] [PubMed] [Google Scholar]
- 45.Rowe J, Chen Q, Domire ZJ, McCullough MB, Sieck G, Zhan W, An K. Effect of collagen digestion on the passive elastic properties of diaphragm muscle in rat. Medical Engineering & Physics. 2010;32:90–94. doi: 10.1016/j.medengphy.2009.11.002. [DOI] [PMC free article] [PubMed] [Google Scholar]
- 46.Royer D, Gennisson J, Deffieux T, Tanter M. On the elasticity of transverse isotropic soft tissues (L) The Journal of the Acoustical Society of America. 2011;129:2757–60. doi: 10.1121/1.3559681. [DOI] [PubMed] [Google Scholar]
- 47.Rutherford OM, Jones DA. Measurement of fibre pennation using ultrasound in the human quadriceps in vivo. European Journal of Applied Physiology and Occupational Physiology. 1992;65:433–7. doi: 10.1007/BF00243510. [DOI] [PubMed] [Google Scholar]
- 48.Sarvazyan AP, Rudenko OV, Swanson SD, Fowlkes JB, Emelianov SY. Shear wave elasticity imaging: a new ultrasonic technology of medical diagnostics. Ultrasound in Medicine & Biology. 1998;24:1419–35. doi: 10.1016/s0301-5629(98)00110-0. [DOI] [PubMed] [Google Scholar]
- 49.Sharafi B, Blemker SS. A micromechanical model of skeletal muscle to explore the effects of fiber and fascicle geometry. Journal of Biomechanics. 2010;43:3207–13. doi: 10.1016/j.jbiomech.2010.07.020. [DOI] [PMC free article] [PubMed] [Google Scholar]
- 50.Shinohara M, Sabra K, Gennisson J, Fink M, Tanter M. Real-time visualization of muscle stiffness distribution with ultrasound shear wave imaging during muscle contraction. Muscle & Nerve. 2010;42:438–441. doi: 10.1002/mus.21723. [DOI] [PubMed] [Google Scholar]
- 51.Sinkjaer T, Magnussen I. Passive, intrinsic and reflex-mediated stiffness in the ankle extensors of hemiparetic patients. Brain. 1994;117(Pt 2):355–63. doi: 10.1093/brain/117.2.355. [DOI] [PubMed] [Google Scholar]
- 52.Sinkjaer T, Toft E, Andreassen S, Hornemann BC. Muscle stiffness in human ankle dorsiflexors: intrinsic and reflex components. Journal of Neurophysiology. 1988;60:1110–21. doi: 10.1152/jn.1988.60.3.1110. [DOI] [PubMed] [Google Scholar]
- 53.Tatsumi R, Liu X, Pulido A, Morales M, Sakata T, Dial S, Hattori A, Ikeuchi Y, Allen RE. Satellite cell activation in stretched skeletal muscle and the role of nitric oxide and hepatocyte growth factor. American journal of physiology Cell Physiology. 2006;290:C1487–94. doi: 10.1152/ajpcell.00513.2005. [DOI] [PubMed] [Google Scholar]
- 54.Tomonaga M. Histochemical and ultrastructural changes in senile human skeletal muscle. Journal of the American Geriatrics Society. 1977;25:125–31. doi: 10.1111/j.1532-5415.1977.tb00274.x. [DOI] [PubMed] [Google Scholar]
- 55.Vandervoort A. Ankle mobility and postural stability. Physiotherapy Theory and Practice. 1999;15:91–103. [Google Scholar]
- 56.Vaz DV, Mancini MC, Fonseca ST, Vieira DS, de Pertence AE. Muscle stiffness and strength and their relation to hand function in children with hemiplegic cerebral palsy. Developmental Medicine and Child Neurology. 2006;48:728–33. doi: 10.1017/S0012162206001563. [DOI] [PubMed] [Google Scholar]
- 57.Werle MJ. Cell-to-cell signaling at the neuromuscular junction: the dynamic role of the extracellular matrix. Annals of the New York Academy of Sciences. 2008;1132:13–8. doi: 10.1196/annals.1405.035. [DOI] [PubMed] [Google Scholar]
- 58.Yamakoshi Y, Sato J, Sato T. Ultrasonic imaging of internal vibration of soft tissue under forced vibration. IEEE Transactions on Ultrasonics, Ferroelectrics, and Frequency Control. 1990;37:45–53. doi: 10.1109/58.46969. [DOI] [PubMed] [Google Scholar]
- 59.Zeger SL, Liang K. Longitudinal data analysis for discrete and continuous outcomes. Biometrics. 1986;42:121–30. [PubMed] [Google Scholar]
- 60.Zhao H, Ren Y, Wu Y, Liu SQ, Zhang L. Ultrasonic evaluations of Achilles tendon mechanical properties poststroke. Journal of Applied Physiology. 2009;106:843–9. doi: 10.1152/japplphysiol.91212.2008. [DOI] [PMC free article] [PubMed] [Google Scholar]
- 61.van Ee CA, Chasse AL, Myers BS. Quantifying skeletal muscle properties in cadaveric test specimens: effects of mechanical loading, postmortem time, and freezer storage. Journal of Biomechanical Engineering. 2000;122:9–14. doi: 10.1115/1.429621. [DOI] [PubMed] [Google Scholar]