

Abstract
Vitamin A (vitA) regulates obesity, insulin resistance, inflammation, dyslipidemia, and hemostasis through its metabolites retinaldehyde (Rald) and retinoic acid (RA) produced in endogenous enzymatic reactions. Combination of at least 3 of these conditions leads to development of metabolic syndrome (Msyn) and, consequently, type 2 diabetes and/or cardiovascular disease. Although many foods are fortified with vitA, it remains unknown what conditions of Msyn are influenced by moderate dietary vitA supplementation. A family of aldehyde dehydrogenase 1 (Aldh1) enzymes is a key contributor to obesity via sex- and fat depot-specific production of RA in adipose tissue. Therefore, we studied effects of moderate vitamin A supplementation of an obesogenic high-fat (HF) diet (4IU vitA/g and 20IU vitA/g HF diet) on multiple conditions and mediators of Msyn in wild-type (WT, C57Bl/6) and Aldh1a1−/− mice. We found that mild vitamin A supplementation did not influence obesity, fat distribution, and glucose tolerance in males and females of the same genotype. In contrast, multiplex analysis of bioactive proteins in blood showed moderately increased concentrations (10-15%) of inflammatory IL-18 and MIP-1γ in vitA supplemented vs. control WT males. Marked decrease (28-31%) in concentrations of lymphotactin and tissue factor, a key protein contributing to thrombogenesis during injury, was achieved by vitA supplementation in WT females compared to control WT females. Aldh1a1 deficiency reduced obesity, insulin resistance, suppressed many pro-inflammatory cytokines, and abolished the effects of vitA supplementation seen in WT mice. Our study revealed specific inflammatory and pro-thrombotic proteins in plasma regulated by dietary vitamin A and the critical role of endogenous vitA metabolism in these processes. The sex-specific decrease of plasma tissue factor concentrations by moderate dietary vitA supplementation could potentially reduce related pro-thrombotic states in obese females.
Keywords: Retinol, coagulation, sex differences, Raldh1, HOMA-IR index
INTRODUCTION
Metabolic syndrome (MSyn) is a cluster of conditions, including chronic inflammation, insulin resistance, obesity, dyslipidemia, hypertension, and pro-thrombotic state in the circulation that lead to type 2 diabetes, cardiovascular disease, and premature death [1]. Obesity is one of the most prevalent MSyn conditions associated with development of type 2 diabetes and cardiovascular disease [2-5], because adipose tissue secretes an array of bioactive molecules contributing to chronic inflammation and a pro-coagulant state in blood [6]. There are two major types (depots) of white adipose tissue: visceral fat adjacent to vital organs and peripheral subcutaneous fat. Visceral fat produces cytokines, such as IL-6, TNFα, resistin, and retinol binding protein-4 (RBP-4), contributing to chronic inflammation and insulin resistance [7,8]. Subcutaneous fat, however, also produces anti-inflammatory adipokines, such as adiponectin, improving insulin sensitivity [7]. Sex is a major determinant of fat distribution and sexual dimorphism was also noted in blood concentrations of cytokines [8-10]. Both adipose depots secrete pro-thrombotic proteins, including tissue factor (TF) and PAI-1; however, PAI-1 is predominantly expressed in visceral fat [11]. Nonetheless, the shift of hemostasis (or haemostasis) to a pro-thrombotic state in Msyn is a sum of responses from different organs [12]. Liver, endothelial, and blood monocytes and platelets produce pro-thrombotic proteins, including factor VII, fibrinogen, and von Willebrand Factor (vWF) [12]. The rapid onset of MSyn in animal models without adipose tissue highlighted the important contribution of other tissues in the plasma pool of pro-inflammatory cytokines [13]. The pro-thrombotic state increases the risk for thrombosis, stroke, and heart attack in patients with MSyn [12]. The concentration of pro-coagulants and pro-inflammatory cytokines is increased in obese vs. lean patents and in animal models of obesity [14]. The pathways capable of improving the profile of cytokines and hemostasis in the blood of obese humans and rodents have not been sufficiently elucidated.
Dietary vitA (retinyl esters, retinol) serves as a precursor for retinaldehyde (Rald) and retinoic acid (RA) [15,16]. RA is a principal endogenous agonist for RA receptor (RAR) [17,18]. In addition, in many cell types, RA also regulates other transcription factors, including NF-κB, AP1, SP1, and STAT family [19-23]. These transcription factors also govern inflammation and production of pro-thrombotic proteins [24-26]. Notably, inflammation is associated with the depletion of vitA levels in plasma [27].
Intracellular RA is generated by the cytosolic aldehyde dehydrogenase-1 (ALDHa1, a2, and a3) enzyme family [16]. The enzymatic activity of ALDHa1 is critical for induction of fat-depot specific expression of Zfp423, i.e. 90% in visceral, and 70% in subcutaneous fat [28]. This transcription factor contributed to the higher expression of Pparg in subsutaneous than visceral fat [28]. PPARγ is a crucial regulator of adipogenesis, insulin sensitivity via adiponectin regulation, and suppressor of inflammation [29,30]. In Aldh1a1−/− mice, the diminished Zfp423/ Pparg expression rendered mice resistant to high-fat (HF) diet-induced obesity and glucose intolerance [28]. These effects were more pronounced in females than in males, because in males Aldh1a2 and Aldh1a3 compensated for RA deficiency [31]. However, it remains unknown how these metabolic changes influence inflammatory and hemostatic factors in blood of Aldh1a1−/− mice.
Consistent with its major role in obesity, vitA is stored in both white adipose depots [32]. In rodent genetic models of obesity and diabetes, vitA deficiency and vitA supplementation influence obesity, glucose tolerance, and inflammatory status [33-35]. However, due to the high capacity to store vitA in the hepatic stellate cells and white adipose tissue, dietary intake of vitA has only minimal impact on plasma concentrations. Previous studies showed that mice receiving diets containing different vitA concentrations (from 4.2 to 49 nmol/d) maintained the same plasma retinol concentrations (1.4–2.47 μmol/L) [36]. This physiological vitA levels in blood was sustained due to increased disposal rate (4.2–68.5 nmol/d) of vitA in the liver (1.2–11000 nmol) [36]. In humans, fortification with vitA of many basic products, such as milk, can lead to a moderate increase in vitA consumption (up to 5-fold recommended dietary allowance dose). It is unknown how a moderate increase in dietary levels of vitA influences Msyn conditions in obese mice.
In this study we showed that a moderate dietary vitA supplementation did not influence obesity and glucose tolerance in obese mice; however, it improved other MSyn conditions via suppression of pro-inflammatory and pro-thrombotic mediators in blood of obese female mice in Aldh1a1-dependent manner.
MATERIAL AND METHODS
Reagents
We purchased reagents from Sigma-Aldrich (St. Louis, MO) and cell culture media from Invitrogen (Carlsbad, CA) unless otherwise indicated.
Animal study was approved by the IACUC. Aldh1a1 null mutant C57BL/6J mice (Aldh1a1−/−) mice were developed by Dr. Gregg Duester and colleagues [16,37]. The metabolic characteristics of Aldh1a1−/− mice were described in [28,38]. Age- (8 weeks old) and sex-matched C57BL/6J (WT) and Aldh1a1−/− mice placed on a high fat diet (termed HF group, 45% kcal from fat with a standard 4IU vitA/g content or 20IU vitA (termed HFA group) purchased by Research Diets Inc., New Brunswick, NJ; HF: D12451 and HFA: D06031502). Each genetic/vitA group had 5 male and 5 female mice. Study lasted for 180 days. Metabolic cage measurements were performed after 120 days on HF and HFA diets. Food and water intake was measured after the mouse was acclimated to a powdered HF/HFA diets (4 days) in metabolic cages (Ancare, Charles River Laboratories).
Glucose tolerance test (GTT) and insulin tolerance test (ITT) was performed in overnight fasted mice. Animals were injected intraperitoneally with 0.004 mL 25% glucose/g body weight for GTT test and with insulin 0.1 U/ml, 0.005 ml/g body weight for ITT. HOMA-IR was calculated using the following formula: HOMA-IR = fasting glucose (mg/dl) × fasting insulin (μU/ml) / 405 [39].
Multiplex bead-based platform
Blood was collected by submandibular puncture. Plasma proteins were analyzed using the multiplex bead based platform (Charles River biomarker services).
Enzyme-linked immunosorbent assay (ELISA)
Blood was collected by cardiac puncture. Mouse Adiponectin/Acrp30 Quantikine kit was purchased by R&D Systems (Minneapolis, MN). Plasma was diluted 25,000-fold with ELISA diluent prior to measurement. Hemolytic samples were omitted from the analysis. Adipose tissue (~150mg) were homogenized in RIPA buffer containing protease inhibitors (Complete Protease Inhibitor Cocktail Tablets, Hoffmann-La Roche Ltd, Indianapolis, IN). Protein concentration was determines using Pierce BCA protein kit (Thermo Scientific). The lysates containing 50μg protein/mL RIPA were analyzed using ELISA according to manufacturer’s instructions.
Statistical analysis
Data are shown as mean±SD. Group comparisons were performed using unpaired Student t-test unless otherwise indicated.
RESULTS
Moderate increase in vitA in HF diet did not influence adipose tissue mass
The effect of moderate vitA supplementation (HFA groups) was studied in WT male and female mice on the HF diet (45% kcal from fat) (HF groups). Given that Aldh1a1 is the major RA-generating enzyme in white adipose tissue [28], we also examined the response to moderate vitA supplementation in Aldh1a1−/− mice. We defined as ‘moderate’ a five-fold increase in vitA levels compared to a standard 4IU/g vita content in HF. We selected male and female mice of similar weight at the beginning of the study (Fig. 1a, b). The enhanced vitA content in the HF diet did not influence weight gain in any of the studied groups. WT male and female mice gained more weight than Aldh1a1−/− mice; however, this gain was identical in HF and HFA-fed mouse groups. Similarly, food and water intake, measured in metabolic cages was not statistically different between HF and HFA fed mice in each sex and genotype group (Fig. 1c, d). The white adipose tissue mass in both subcutaneous and visceral fat depots was markedly different between WT and Aldh1a1−/− sex-matched groups (Fig. 2a, b), in agreement with our previous reports [31]. However, in each sex and genotype groups, moderate vitA supplementation per se did not influence the adipose tissue mass (Fig. 2a, b). Finally, neither liver weight (data not shown) nor liver to weight ratio (Fig. 2c) was changed in response to moderate vitA supplementation. White adipose and hepatic tissue are the major storage sites for dietary vitA and produce a variety of cytokines, adipokines, and hepatokines that regulate glucose metabolism [14,32]. Therefore, we investigated glucose metabolism in HF and HFA fed mouse groups.
Figure 1. High-fat (HF) and high-fat with moderately elevated vitA content (HFA) have similar responses on whole body weights and food and water consumptions in WT and in Aldh1a1−/− (KO) mice.
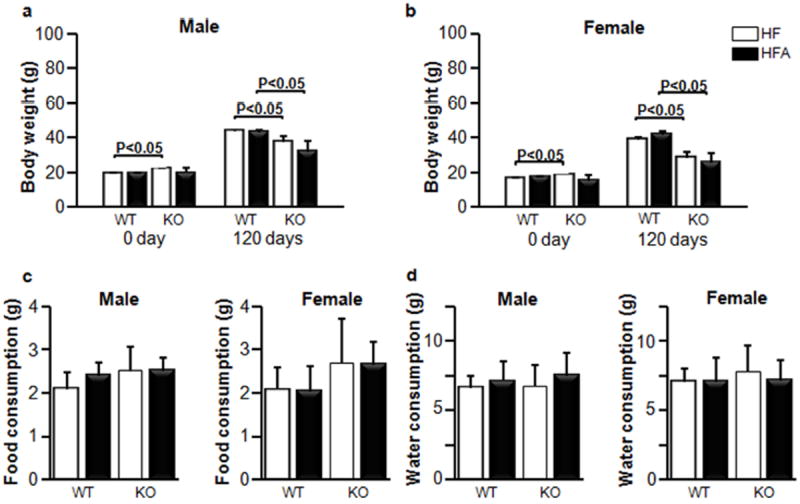
Whole body weights are shown before and after 120 days diet treatment for male (a) and female (b) mice (n=5 for all mouse groups). Effect of HF and HFA diets on food (c) and water (d) consumptions for male and female groups. Food and water consumption was measured in metabolic cages (n=4 for all mouse groups). Data are shown as mean±SD. The p-values were calculated by Student’s t-test.
Figure 2. Similar mass of white adipose tissue depots in WT and KO mice fed HF and HFA diets.
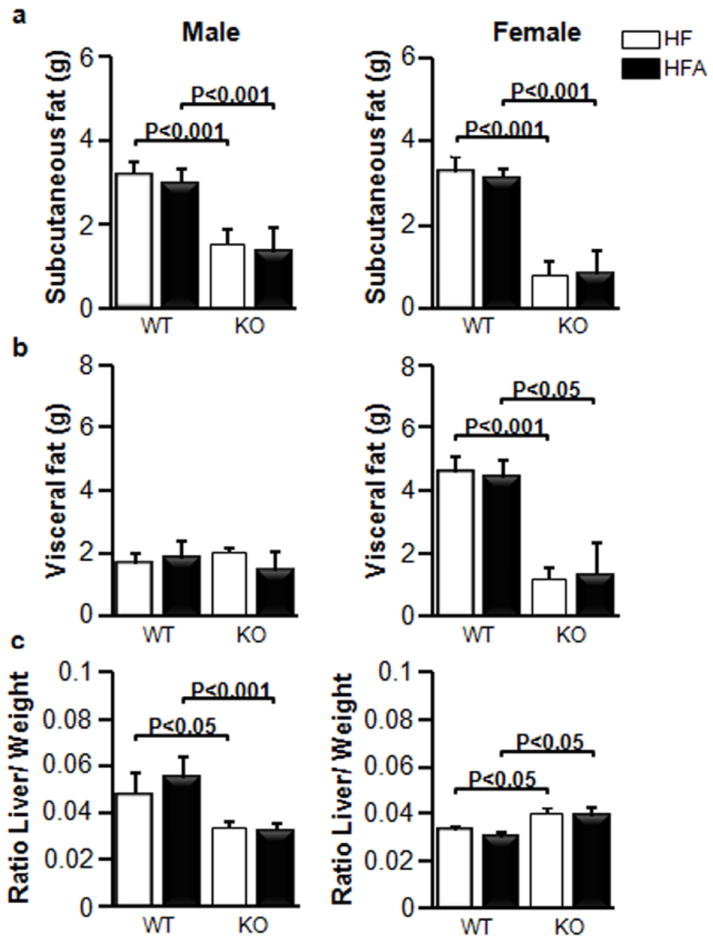
Mice (n=5 for all mouse groups, same as Fig.1) were fed HF and HFA diets for 180 days, then major adipose (a) subcutaneous, (b) visceral fat weights, and (c) the ratio of liver mass/body weight (relative liver weight) in WT and in KO mice. Data are shown as mean±SD. The p-values were calculated by Student’s t-test (n=5 for all mouse groups).
Moderate increase in vitA in HF diet improves glucose metabolism in obese males
Moderate vitA supplementation had no effect on the ITT, GTT, insulin concentration, or HOMA-IR index in WT male and female mice (Fig. 3). Both Aldh1a1−/− male and female mice had improved ITT, while GTT was only decreased in Aldh1a1−/− females compared to sex-matched WT groups (Fig. 3a, b). Both GTT and ITT responses were significantly improved in Aldh1a1−/− males supplemented with vitA compared to a control HF-fed Aldh1a1−/− male group (Fig. 3a, b, HFA vs. HF). The blood insulin levels and HOMA-IR index was decreased in Aldh1a1−/− vs. WT males (Fig. 3c, d) Dietary vitA had no effect on blood insulin levels and HOMA-IR index in any of the studied groups. Similarly, insulin-sensitizing adipokines such as adiponectin levels in circulation were also significantly changed between sex-matched WT and Aldh1a1−/− mice (Fig. 4a); however, vitamin A supplementation did not influence adiponectin levels in studied groups. Adiponectin concentrations in homogenized visceral (retroperitoneal) and subcutaneous fat pad were also not changed in HF vs. HFA sex-matched groups (Fig. 4b, c). We concluded that HF diet-mediated metabolic changes were more dependent on the metabolizing ALDH1a1 enzyme than on the moderate increase in vitA content in HF diet. Although adipose tissue is an important contributor to development of Msyn, some Msyn conditions, such as chronic inflammation also emerges in the absence of white adipose tissue [13] due to the increased secretion of pro-inflammatory mediators in blood by other tissues, including hepatic, intestinal, vascular, hematopoietic, and immune, which can affect immune status and hemostasis in blood [24-26]. Therefore, we tested concentrations of pro-inflammatory and pro-thrombotic proteins in blood.
Figure 3. Similar glucose tolerance in WT and KO mice fed HF and HFA diets.
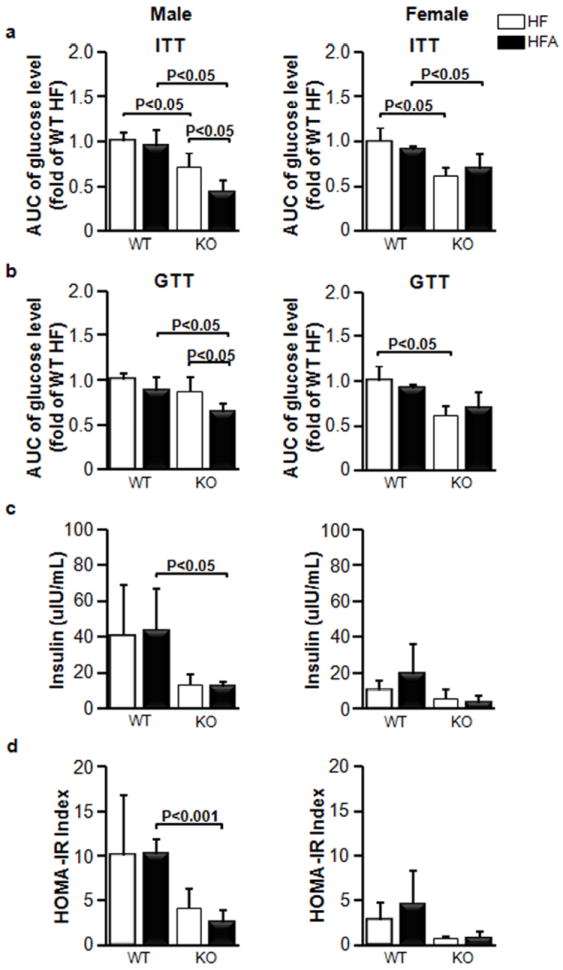
Comparison of areas under the curve (AUC) for (a) insulin tolerance tests (ITT) and (b) glucose tolerance tests (GTT) in WT and in KO male and female mice after 120 days on HF and HFA diets. (c) Fasting blood insulin levels in the mice after 120 days of treatment on HF and HFA diets. (e) Homeostasis Model of Assessment of Insulin Resistance (HOMA-IR) for the mice after 120 days of treatment on HF and HFA diets. Data are shown as mean±SD. The p-values were calculated by Student’s t-test. (n=4 for all mouse groups for ITT and GTT tests; n=5 for insulin measurements).
Figure 4. Similar adiponectin levels in blood, visceral, and subcutaneous tissues in WT and KO mice fed HF and HFA diets.
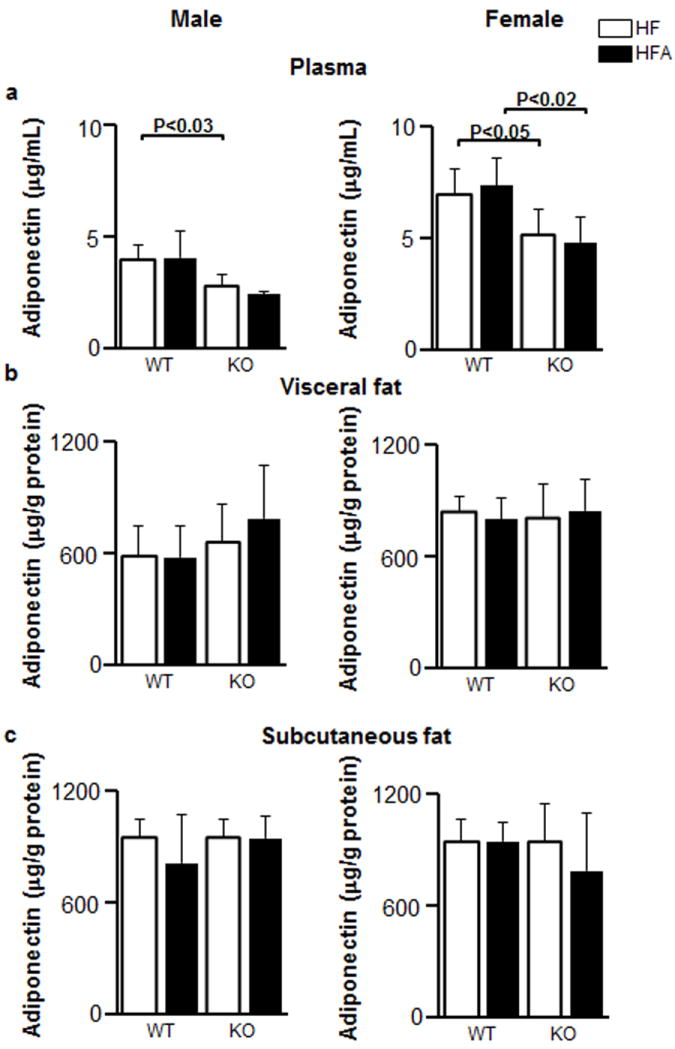
The concentrations of adiponectin in plasma (a), and homogenates of visceral (b) and subcutaneous (c) adipose tissues in response to HF and HFA diets in WT and KO male and female mice. Adiponectin concentrations were measured by ELISA. Tissues homogenates were normalized by protein content to 50 μg protein/mL prior to ELISA. Data are shown as mean±SD. The p-values were calculated by Student’s t-test. (n=5 for all mouse groups).
Increased content of vitA in diet decreases pro-thrombotic factors in obese females
We measured several metabolites in a multiplex format in the blood of WT and Aldh1a1−/− males and females fed HF and HFA diets (Table 1, 2). We found that Aldh1a1 deficiency significantly altered the profile of pro-inflammatory cytokines and pro-thrombotic factors in blood. We detected marked (≥2-fold) decrease in leptin, MCP-1, MCP-3, CD40, CD40L, IP-10, and IL-10 in Aldh1a1−/− compared to WT sex-matched mice on the HF diet. The decrease in MIP-1γ, MIP-1, MIP-3, IL1β, IL-5, and IL-18, was less pronounced but also significant in Aldh1a1−/− vs. WT sex-matched mice on the HF diet. The example of this regulation pattern is shown for leptin in Fig. 5a.
Table 1. Effect of moderate vitamin A supplementation on the inflammatory and haemostatic factors in blood of male mice.
Mice were fed a high-fat diet (HF, 4IU vitamin A/g chow) and same diet with increased vitamin A content (HFA, 20IU vitamin A/g chow) for 180 days. Blood was collected after 120 d on the diet. Data are shown as mean±SD, n=5 per each group. P, Mann-Whitney U test.
| WT male | P value1 | KO male | P value2 | P value3 | P value4 | ||||
|---|---|---|---|---|---|---|---|---|---|
| HF | HFA | HF | HFA | ||||||
| Leptin (ng/mL) | 33.3±5.9 | 35.22±3.9 | N/S | 15.3±5.1 | 11.83±6.2 | N/S | 0.0019 | 0.0001 | |
| CRP (μg/mL) | 0.12±0.03 | 0.13±0.06 | N/S | 0.16±0.03 | 0.14±0.03 | N/S | N/S | N/S | |
| CCL Chemokine | |||||||||
| MIP-1γ (ng/mL) | 16.1±0.6 | 18.5±1.7 | 0.0311 | 12.65±1.0 | 10.07±0.8 | 0.0039 | 0.0013 | 0.0001 | |
| MCP-1 (pg/mL) | 126±59 | 158±71.3 | N/S | 38.6±12.5 | 28.8±8.5 | N/S | 0.0233 | 0.0038 | |
| MCP-3 (pg/mL) | 254±106 | 279±76 | N/S | 104±26 | 100±35 | N/S | 0.0297 | 0.0014 | |
| MCP-5 (pg/mL) | 25.6±11.4 | 32.7±14.8 | N/S | 16.7±3.3 | 14.9±6.6 | N/S | N/S | N/S | |
| MDC (pg/mL) | 346±97 | 385±119 | N/S | 206 ±61 | 213±30 | N/S | 0.0429 | N/S | |
| MIP-1α (ng/mL) | 0.5±0.1 | 0.5±0.1 | N/S | 0.4±0.01 | 0.34±0.03 | N/S | 0.0192 | 0.0001 | |
| MIP-3β (ng/mL) | 0.3±0.1 | 0.3±0.1 | N/S | 0.3±0.1 | 0.3±0.1 | N/S | N/S | N/S | |
| Eotaxin (μg/mL) | 0.9±0.4 | 0.9±0.3 | N/S | 0.5±0.1 | 0.4±0.1 | N/S | N/S | 0.0106 | |
| CXCL Chemokine | |||||||||
| Lymphotactin (pg/mL) | 127±72 | 113±17 | N/S | 74.4±16.3 | 82.1±38.1 | N/S | N/S | N/S | |
| MIP-2 (pg/mL) | 20.3±10.7 | 19.9±12.5 | N/S | 3.7±2.7 | 4.7±1.8 | N/S | 0.0203 | 0.0272 | |
| IP-10 (pg/mL) | 56.3±21.9 | 58.8±10.0 | N/S | 21.7±5.4 | 19.7±10.2 | N/S | 0.0185 | 0.0003 | |
| TNF Family Proteins | |||||||||
| CD40 (pg/mL) | 141±20 | 162±25 | N/S | 65±14 | 47±10 | N/S | 0.0003 | 0.0001 | |
| CD40 Ligand (pg/mL) | 497±102 | 474±98 | N/S | 212±65 | 140±68 | N/S | 0.0020 | 0.0002 | |
| Haemostatic Factors | |||||||||
| TF (ng/mL) | 1.7±0.2 | 2.2±0.6 | N/S | 1.1±0.3 | 1.1±0.2 | N/S | 0.0023 | 0.0036 | |
| Endothelin-1 (pg/mL) | 39.3±6.3 | 41.8±7.9 | N/S | 33.9±6.5 | 29.6±5.3 | N/S | N/S | 0.0209 | |
| Factor VII (ng/mL) | 1.1±0.21 | 1.2±0.15 | N/S | 0.7±0.2 | 0.5±0.1 | N/S | 0.0197 | 0.0001 | |
| Thrombopoietin (ng/mL) | 10.8±1.3 | 10.2±0.7 | N/S | 7.5±1.0 | 7.9±0.5 | N/S | 0.0040 | 0.0003 | |
| vWF (ng/mL) | 1056±209 | 1203±389 | N/S | 1393±138 | 1750±384 | N/S | 0.0365 | N/S | |
| TIMT-1 (ng/mL) | 1.4±0.3 | 1.7±0.2 | N/S | 0.8±0.04 | 0.8±0.3 | N/S | 0.0098 | 0.0004 | |
| Interleukin Inflammatory Proteins | |||||||||
| IL-18 (ng/mL) | 1.4±0.1 | 1.6±0.1 | 0.05 | 1.2±0.04 | 1.1±0.1 | N/S | 0.0023 | 0.0001 | |
| IL-10 (pg/mL) | 295±84 | 328±100 | N/S | 166±34 | 162±36 | N/S | 0.0242 | 0.0083 | |
| IL-1β (ng/mL) | 1.7±0.2 | 1.7±0.2 | N/S | 1.2±0.2 | 1.1±0.1 | N/S | 0.0130 | 0.0003 | |
| NIL-5 (ng/mL) | 0.3±0.1 | 0.3±0.04 | N/S | 0.2±0.04 | 0.2±0.02 | N/S | 0.0243 | 0.0006 | |
P value, difference in HF vs. HFA chow for WT male mice
P value, difference in HF vs. HFA chow for KO male mice
P value, difference in WT vs. KO male mice for HF chow
P value, difference in WT vs. KO male mice for HFA chow
N/S – samples are not significantly different
Table 2. Effect of moderate vitamin A supplementation on the inflammatory and haemostatic factors in blood of female mice.
Mice were fed a high-fat diet (HF, 4IU vitamin A/g chow) and same diet with increased vitamin A content (HFA, 20IU vitamin A/g chow) for 180 days. Blood was collected after 120d on the diet. Data are shown as mean±SD, n=5 per each group. P, Mann-Whitney U test.
| WT female | P value1 | KO female | P value2 | P value3 | P value4 | ||||
|---|---|---|---|---|---|---|---|---|---|
| HF | HFA | HF | HFA | ||||||
| Leptin (ng/mL) | 33.9±12.1 | 33.2±8.6 | N/S | 7.2±4.9 | 5.9±7.5 | N/S | 0.0018 | 0.0014 | |
| CRP (μg/mL) | 0.11±0.05 | 0.17±0.03 | 0.0317* | 0.13±0.0 | 0.12±0.05 | N/S | N/S | N/S | |
| CCL Chemokine | |||||||||
| MIP-1γ (ng/mL) | 16.2±3.2 | 15.6±1.8 | N/S | 11.9±1.3 | 13.9±1.4 | N/S | 0.0483 | N/S | |
| MCP-1 (pg/mL) | 229±131 | 108±47 | N/S | 44.4±26.0 | 49.8±15.9 | N/S | 0.0146 | 0.0348 | |
| MCP-3 (pg/mL) | 427±298 | 318±95 | N/S | 134±43 | 172±43 | N/S | N/S | 0.0171 | |
| MCP-5 (pg/mL) | 36±15 | 41±20 | N/S | 16±5 | 215±10 | N/S | 0.0250 | N/S | |
| MDC (pg/mL) | 444±207 | 267±55 | N/S | 241±63 | 251±70 | N/S | N/S | N/S | |
| MIP-1α (ng/mL) | 0.46±0.07 | 0.40±0.03 | N/S | 0.37±0.04 | 0.40±0.05 | N/S | 0.0425 | N/S | |
| MIP-3β (ng/mL) | 0.35±0.03 | 0.31±0.08 | N/S | 0.24±0.03 | 0.25±0.05 | N/S | 0.0007 | N/S | |
| Eotaxin (μg/mL) | 1.8±1.2 | 1.2±0.8 | N/S | 0.8±0.5 | 0.8±0.7 | N/S | N/S | N/S | |
| CXCL Chemokine | |||||||||
| Lymphotactin (pg/mL) | 123±13 | 88±21 | 0.0197 | 75±15 | 93±27 | N/S | 0.0006 | N/S | |
| MIP-2 (pg/mL) | 42.8±44.5 | 11.7±6.9 | N/S | 6.1±2.8 | 6.2±5.4 | N/S | N/S | N/S | |
| IP-10 (pg/mL) | 75.9±30.2 | 49.3±27.6 | N/S | 14.8±3.8 | 20.7±9.7 | N/S | 0.0020 | N/S | |
| TNF Family Proteins | |||||||||
| CD40 (pg/mL) | 116.8±20.6 | 98.2±21.2 | N/S | 50.2±10.3 | 57.6±15.6 | N/S | 0.0002 | 0.0127 | |
| CD40 Ligand (pg/mL) | 585±66 | 516±103 | N/S | 217±49 | 242±130 | N/S | 0.0001 | 0.0109 | |
| Haemostatic Factors | |||||||||
| TF (ng/mL) | 2.15±0.43 | 1.49±0.33 | 0.0405 | 1.09±0.38 | 1.41±0.05 | N/S | 0.0034 | N/S | |
| Endothelin-1 (pg/mL) | 46.5±3.9 | 38.6±8.8 | N/S | 37.7±7.2 | 29.0±4.9 | N/S | 0.0443 | N/S | |
| Factor VII (ng/mL) | 1.3±0.2 | 1.1±0.15 | N/S | 0.7±021 | 0.8±0.15 | N/S | 0.0037 | 0.0118 | |
| Thrombopoietin (ng/mL) | 10.6±1.4 | 9.6±1.5 | N/S | 8.3±1.6 | 8.4±1.9 | N/S | 0.0439 | N/S | |
| vWF (ng/mL) | 1082±707 | 1102±438 | N/S | 1087±620 | 975±636 | N/S | N/S | N/S | |
| TIMT-1 (ng/mL) | 1.3±0.3 | 1.2±0.1 | N/S | 0.9±0.5 | 1.0±0.4 | N/S | N/S | N/S | |
| Interleukin Inflammatory Proteins | |||||||||
| IL-18 (ng/mL) | 1.3±0.1 | 1.3±0.2 | N/S | 1.0±0.1 | 1.3±0.1 | 0.0090 | 0.0016 | N/S | |
| IL-10 (pg/mL) | 347±99 | 439±299 | N/S | 154±39 | 179±91 | N/S | 0.0036 | N/S | |
| IL-1β (ng/mL) | 1.6±0.1 | 1.6±0.3 | N/S | 1.3±0.1 | 1.4±0.3 | N/S | 0.0018 | N/S | |
| IL-5 (ng/mL) | 0.4±0.04 | 0.3±0.1 | N/S | 0.3±0.1 | 0.3±0.1 | N/S | 0.0443 | N/S | |
P value, difference in HF vs. HFA chow for WT female mice
P value, difference in HF vs. HFA chow for KO female mice
P value, difference in WT vs. KO female mice for HF chow
P value, difference in WT vs. KO female mice for HFA chow
N/S – samples are not significantly different
P value was calculated using two-tailed U Test (Mann-Whitney U Test)
Figure 5. HFA selectively influence blood concentrations of cytokines and tissue factor in males and females in Aldh1a1−/−-dependent manner.

The concentrations of leptin (a), circulating lymphotactin (b), MIP-1γ (c), IL-18 (d), and tissue factor (e) in the blood in response to HF and HFA diets in WT and KO male and female mice. Data are shown as mean±SD. The p-values were calculated by Student’s t-test. WT (n=5 for all mouse groups, same as Fig. 1).
Dietary vitA supplementation resulted in a sex-specific regulation of only a few cytokines. Lymphotactin was reduced (-28%) in WT female mice on HFA vs. HF diet, but was maintained at the same levels in WT males (Fig. 5b). Aldh1a1 deficiency only led to a significant reduction of lymphotactin levels in the female group.
In WT males, vitA supplementation moderately increased blood concentration of two cytokines IL-18 and MIP-1γ (Fig. 5c, d). This effect was abolished in Aldh1a1−/− males.
An unexpected finding in our study was the sex-specific effect of both, vitA supplementation and Aldh1a1 deficiency on the blood hemostatic factors. Supplementation with vitA decreased tissue factor (-31%) in female, but not in male (+24%) WT mice on HFA vs. HF diet (100%). Aldh1a1 deficiency reduced tissue factor levels in both male and female Aldh1a1−/− vs. WT mice (Fig. 5e). Factor VII and thrombopoietin were significantly reduced in female Aldh1a1−/− vs. WT mice on HF and/or HFA diet; in males these factors were only significantly decreased on the HFA diet (Table 1, 2). Strikingly, vWF was elevated in the vitA supplemented group only in Aldh1a1−/− male mice, while females maintained similar vWF blood levels in all groups. Thus, levels of pro-thrombotic and pro-inflammatory proteins were improved by vitA in female but not in male WT obese mice.
Consistent with its expression in adipose tissue, leptin was correlated with the mass of white fat comprising of retroperitoneal visceral and subcutaneous fat pads (Fig. 6a). Pro-inflammatory cytokines such as MCP-1, IP-10 (Fig. 6b, c), which are expressed in adipose tissues, also significantly correlated with white fat mass, in contrast to lymphotactin (Fig. 6d). Pro-thrombotic tissue factor is expressed in adipose and predominantly in vascular cells [11]. Correspondingly, tissue factor showed a weaker, non-significant correlation with white adipose tissue mass (Fig. 6e), whereas vWF factors, produced by hepatic cells, showed no association with adipose tissue (Fig. 6f). Thus, both lymphotactin and tissue factor, that were altered in response to vitA dietary supplementation in females, were not correlated with the mass of major white adipose tissue depots.
Figure 6. White adipose tissues mass correlate with plasma concentration of adipokines and cytokines but not pro-thrombotic factors.
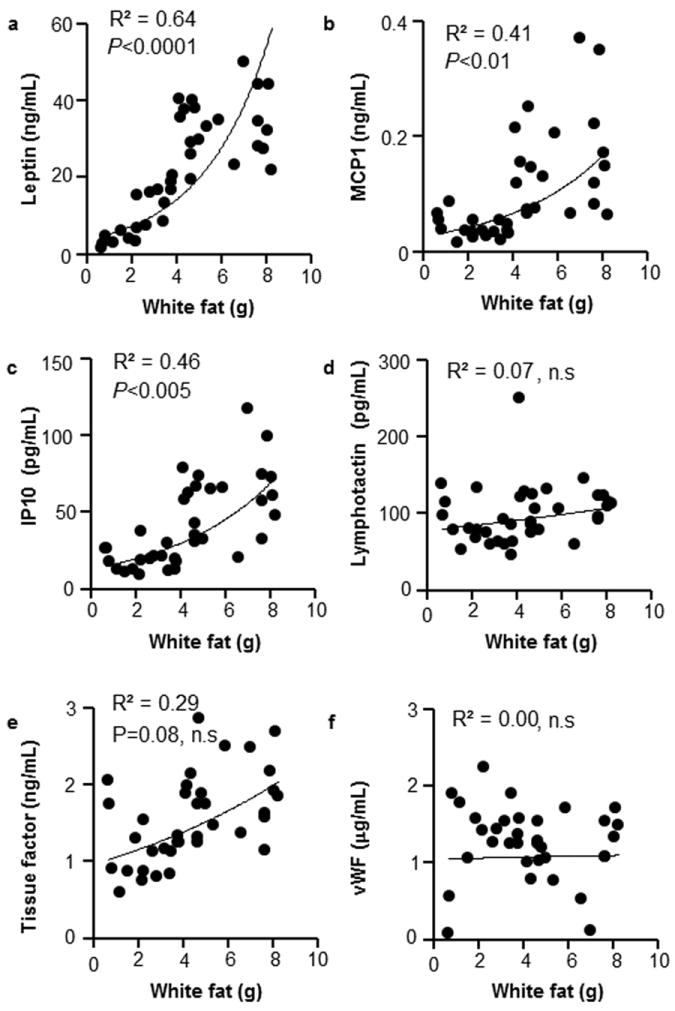
The white adipose tissue mass is a sum of weights of two visceral (retroperitoneal) and two subcutaneous fat pads. Concentrations of cytokines are the same as in Fig. 5. Data include all groups of WT and Aldh1a1−/− mice on HF and HFA diets. Correlations between white adipose tissue mass and leptin (a), MCP-1 (b), IP-10 (c), lymphotactin (d), tissue factor (e), and VWF (f). n=37, Pearson correlation test.
DISCUSSION
Fortification of dairy products with vitA can potentially lead to a moderate increase in vitA consumption. In light of controversial reports on the obesogenic and anti-obesogenic effects of vitA consumption, treatments with RA, and genetic deficiency in vitamin A-metabolizing enzymes in different rodent models or patients [19,33,34,40-42], it is important to understand metabolic effects of moderate vitA supplementation. Whereas obesity is an important condition, Msyn can also emerge without obesity [13]; therefore, we also assessed how dietary vitA supplementation influences other critical Msyn manifestations: such as plasma levels of mediators of inflammation and thrombosis. We found that moderate vitA increase in diet only influenced specific cytokines (MIF-1γ, IL-18, lymphotactin) and one pro-thrombotic factor (tissue factor) in a sex-specific manner (Fig. 7). These dietary effects appeared to be independent of adipose tissue mass (Fig.6, 7). However, were abolished in Aldh1a1−/− mice, suggesting the dependence of dietary vitA effects on endogenous metabolism by ALDH1a1. The overall role of vitA metabolism utilizing endogenous stores was more profound: Aldh1a1−/− mice were protected from obesity, glucose tolerance, liver steatosis [38], and had decreased levels of pro-inflammatory and pro-thrombotic mediators in blood (Fig.7). The obesity in mice appeared to be a major determinant of their cytokine profile as suggested by correlation analysis (Fig. 6). The plasma levels of MCP-1, IP-10, and other pro-inflammatory cytokines known to be secreted from adipose tissue [43-45], were reduced in Aldh1a1−/− mice proportionally to their adipose tissue mass. We proposed two principal modes of vitA action in inflammation and hemostasis (Fig. 7): 1) Enzyme-controlled utilization of endogenous vitA for regulation of cytokines in peripheral tissues, such as adipose, hepatic and other tissues, and 2) Direct responses to postprandial vitA concentrations by vascular and immune cells.
Figure 7. Hypothetical regulatory mechanism for pro-inflammatory cytokines and pro-thrombotic factors by dietary and endogenous vitA.
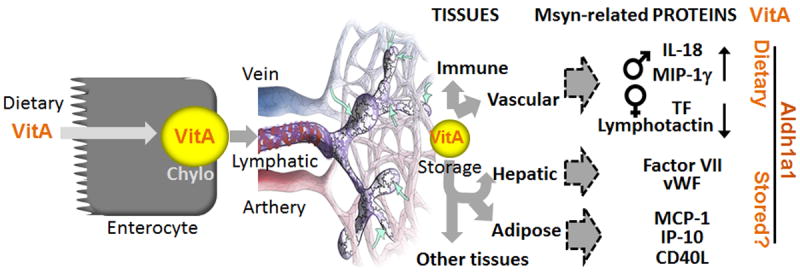
Dietary vitA is assembled into chylomicrons in enterocytes and transported in lymphatic system for the uptake in peripheral tissues. Intestinal, immune and vascular cells interact with vitA-loaden chylomicrons and respond to changes in dietary concentrations. Lymphotactin is expressed in intestinal and immune cells, whereas and vascular cells express tissue factor (TF) in females. In males, dietary vitA mildly increases IL-18 and MIP-1γ. The remaining vitA in chylomicron remnants is stored in adipose and hepatic tissues. In these tissues Aldh1a1, together with other enzymes, participate in the metabolism of endogenous vitA. Consequently, Aldh1a1 deficiency influences many adipokines, cytokines and hepatic pro-thrombotic factors. Circulating and resident in peripheral tissues immune cells may contribute to blood concentrations of pro-inflammatory cytokines.
Based on the well-documented links between vitA/inflammation and vitA/obesity [19-23,33,34,40-42], we initially hypothesized that inflammatory and hemostatic factors in the blood of WT and Aldh1a1−/− mice on the HF and HFA diet will change proportionally to the level of obesity and occur in a sex-specific manner. This indirect adipocentric mechanism is based on the fact that adipose tissue mass is markedly lower in Aldh1a1−/− compared to WT mice.
Hypertrophic adipocytes and macrophages in adipose tissue express leptin, MCP-1, MCP-3, CD40, CD40L, IP-10 IL-10, MIP-1γ, MIP-1, MIP-3, IL-18, IL1b, IL-5, and tissue factor [43-45]. We found that moderate vitA supplementation did not alter weight gain, fat formation, or fat distribution induced by HF diet in WT or Aldh1a1−/− mice (Fig. 1, 2). This finding was in consonance with previous reports [46]. The glucose metabolism and insulin-sensitizing adiponectin also was not altered in response to the moderate change in vitA content in the HF diet in these mice (Fig. 3, 4). In contrast, Aldh1a1 deficiency prevented development of obesity and glucose tolerance on both HF and HFA diets (Fig. 1-3), ref. [28,31,38]. Both liver and adipose tissues can effectively store high concentrations of vitA that could eliminate the impact of the different dietary levels of vitA in these peripheral tissues.
Consistent with the known contribution of adipose tissue to the pool of adipokines, pro-inflammatory cytokines, and pro-thrombotic factors in blood [14,24-26], leptin, MCP-1, MCP-3, CD40, CD40L, IP-10, IL-10, MIP-1γ, MIP-1, MIP-3, IL-18, IL1β, IL-5, and tissue factor were reduced in lean Aldh1a1−/− compared to obese WT mice. Significant correlation between white adipose tissue mass and leptin, MCP-1, and IP-10 suggested the pivotal role of adipose tissue in the production of these cytokines (Fig. 6). The lack of correlation between adipose tissue and tissue factor or pro-thrombotic factors VII and vWF (Fig. 6) is in agreement with the known production of these proteins by vascular and hepatic tissues, respectively. Hyperlipidemia and non-alcoholic liver steatosis is associated in some studies with higher production of factors VII and vWF [47-50]. Aldh1a1−/− mice resist HF-diet induced hyperlipidemia and triglyceride accumulation in the liver seen in WT mice on an obesogenic diet [38]. It is plausible that decreased plasma levels of factors VII and vWF are due to the differences in hepatic lipid metabolism in WT and Aldh1a1−/− mice. Specific mechanisms regulating cytokine regulation by ALDH1a1 and the role of endogenous vitA metabolism were beyond the scope of this study identifying ALDH1a1-sensitive pool of bioactive plasma proteins. Regardless of the mechanism, our study demonstrates that ALDH1a1, possibly via endogenous vitA utilization, controls the majority of metabolic pathways and mediators of inflammation and hemostasis in the blood.
Aldh1a1 is the major enzyme in human and mouse white adipose tissue capable of RA production [28]. In adipocytes, sex-specific differences are mediated in part by estrogen, which suppresses expression of Aldh1a2 and Aldh1a3 enzymes [31], therefore, Aldh1a1−/− females have less visceral adipose tissue than Aldh1a1−/− males. In consonance with the adipose reduction pattern, the blood levels of leptin were lower in Aldh1a1−/− females than males (Fig. 5a right vs. left panel). Other cytokines and pro-thrombotic factors circulated at similar levels in males and females. Notably, all HFA-diet-dependent changes occurred in a sex-specific fashion. While WT males had increased plasma concentrations of MIP-1γ and IL-18, WT females had reduced lymphotactin and tissue factor concentrations on HFA compared to HF diet (Fig. 5). In both sexes, the effect of dietary vitamin A was abolished in Aldh1a1−/− mice suggesting that the metabolic conversion to RA contributed to these effects. Altered concentrations of MIP-1γ and IL-18 in males and in tissue factor and lymphotactin in females were independent of changes in adipose tissue mass, and could be produced by another, e.g. immune and vascular tissue. Dietary vitA is assembled in enterocytes into chylomicrons and transported into the lymphatic system for uptake in peripheral tissues (Fig. 7) [15]. Lymphotactin is expressed in intestinal and immune cells [51], whereas vascular cells express tissue factor [11]. These cell types are exposed to dietary and postprandial vitA that could regulate synthesis of lymphotactin and tissue factor in response to moderate changes of dietary vitA. A potential mechanism leading to the sex-specific levels of these cytokines in blood may include ALDH1 enzymes, because all these effects were abolished in Aldh1a1 deficient males and females (Fig. 5). ALDH1 family of enzymes also plays an important role in other tissues, notably immune cells, including dendritic cells and macrophages [20,52]. Due to estrogen suppression of Aldh1a2 and Aldh1a3 expression [31], cells with low Aldh1a1 expression or activity have diminished RA production [28]. RA inhibits tissue factor expression in endothelial and leukemic cell cultures, probably via RAR/RXR dependent mechanisms [53,54]. However, RA also directly regulates expression of RAR receptors [55] and required for the differentiation of lymphatic vasculature [56], that expect to be impaired in Aldh1a1−/− females. Numerous studies have documented a role of estrogen in the regulation of coagulation cascade [57]. Ethynyl estradiol improved the pro-thrombotic phenotype in obese rats [57]. We can speculate that estrogen- and vitamin A-activated pathways synergize their action; however, future studies need to identify cells contributing to sex-specific production of tissue factor, and MIP-1γ, IL-18, lymphotactin and dissect mechanisms underlying vitA action.
The major finding in our study is that a moderate increase of vitA in the HF diet improved pro-thrombotic tissue factor levels in obese female WT mice, while in obese males elevated vitA content in the HF diet was associated with a moderate increase in inflammation.
Obese men and women showed sexual dimorphism in the expression of Aldh1 enzymes [31]. The sex-specific response to moderate vitA supplementation in obese mice may suggest that dietary vitA can also exert different metabolic effects in obese men and women. In obese male mice, HFA diet moderately (up to 15%) increased levels of pro-inflammatory MIP-1γ and IL-18 cytokines. IL-18 is an integral part of inflammasome secreted by adipose tissue [43], which is also causally implicated in the development of obesity [58]. In female mice, moderately-elevated dietary vitA content resulted in a profound (-30%) decrease in tissue factor levels in blood (Fig. 5e) suggesting a reduced propensity to pro-thrombotic events. Lymphotactin was found in human subcutaneous fat in association with obesity [59]. In our study, this cytokine was selectively and effectively reduced in obese females on HFA diet (Fig. 5b). More studies are needed to establish the function of this cytokine in obesity. VitA regulated numerous signaling and transcriptional pathways [19]. Our study demonstrated an array of inflammatory and pro-thrombotic factors that are dependent on dietary vitA and/or endogenous vitA metabolism. Dietary vitA can potentially provide an opportunity to regulate blood levels of cytokines and hemostatic factors for therapeutic purposes.
CONCLUSIONS
A moderate increase in vitA in the HF diet did not influence obesity and glucose sensitivity. It regulated adipokines, inflammatory cytokines, and hemostatic factors in a sex-specific and Aldh1a1-dependent fashion. VitA in the diet increased concentrations of pro-inflammatory cytokines in males, whereas in females it reduced lymphotactin and improved the hemostatic blood profile by diminished production of tissue factor. Our data demonstrate that vitA in the diet can differentially impact males and females and provide evidence of improved hemostatic factors in obese females.
HIGHLIGHTS.
A 5-fold increase in vitamin A in a high-fat diet (HFA vs. HF diet) does not influence obesity in mice
HFA vs. HF diet increased concentrations of pro-inflammatory cytokines MIP-1 and IL-18 in males
HFA vs. HF diet reduced lymphotactin and pro-thrombotic tissue factor in female mice
Dietary Vitamin A does not influence glucose tolerance in obese mice
Effects of dietary vitamin A depend on Aldh1a1
Acknowledgments
This research was supported by the SEED grants from Center for Advanced Functional Foods Research and Entrepreneurship, the Molecular Carcinogenesis and Chemoprevention Program of the Ohio State University Comprehensive Cancer Center Food Innovation Center SEED Grant, OSU International office SEED grant, and Pilot Industry partnership grant at the OSU Center for Clinical and Translational Science, which was supported by Award UL1RR025755 from the National Center Research Resources (O.Z.). The content is solely the responsibility of the authors and does not necessarily represent the official views of the National Institute of Diabetes And Digestive And Kidney Diseases or the National Institutes of Health. The funders had no role in study design, data collection and analysis, decision to publish, or preparation of the manuscript.
Abbreviations
- Aldh1a1
Aldehyde dehydrogenase 1 family, member a1
- Aldh1a1−/−
Knockout in Aldh1a1
- Aldh1a2
Aldehyde dehydrogenase 1 family, member a2
- Aldh1a3
Aldehyde dehydrogenase 1 family, member a3
- HF
high fat diet (4IU vitamin A/g)
- HFA
high fat vitamin A diet (20 IU vitamin A/g)
- GTT
Glucose tolerance test
- AP1
Activator Protein 1
- CC
CCL Chemokine Group of Cytokines
- CRP
C Reactive Protein
- CXC
CXCL Chemokine Group of Cytokines
- HOMA-IR
Homeostasis Model of Assessment of Insulin Resistance
- IL-18
Interleukin-18
- IL-10
Interleukin-10
- IL-1β
Interleukin-1 beta
- IL-5
Interleukin-5
- IP-10
Interferon gamma-induced protein 10
- ITT
Insulin tolerance test
- LIF
Leukemia Inhibitory Factor
- MCP-1
Monocyte Chemoattractant Protein-1
- MCP3
Monocyte Chemoattractant Protein-3
- MCP-5
Monocyte Chemoattractant Protein-5
- MDC
Macrophage-Derived Chemokine
- MIP-1α
Macrophage Inflammatory Protein-1 alpha
- MIP-3β
Macrophage Inflammatory Protein-3 beta
- MIP-1γ
Macrophage Inflammatory Protein-1 gamma (alias CCL9)
- MIP-2
Macrophage Inflammatory Protein-2
- NF-κB
nuclear factor kappa-light-chain-enhancer of activated B cells
- PAI-1
Plasminogen Activator Inhibitor-1
- PPARγ
Peroxisome Proliferator-activated Receptor gamma
- PPARβ/δ
Peroxisome Proliferator-activated Receptor delta
- RAR
Retinoic Acid Receptor
- Rald
Retinaldehyde
- RA
Retinoic acid
- RDA
Recommended Dietary Allowance
- RBP
Retinol Binding Protein
- SP1
Specificity Protein 1
- STAT
Signal Transducer and Activator of Transcription
- TF
Tissue Factor
- TIMT-1
Tissue Inhibitor of Metalloproteinase Type-1
- VWF
von Willebrand Factor
- ZFP423
Zinc-Finger Protein Transcription Factor 423
Footnotes
Publisher's Disclaimer: This is a PDF file of an unedited manuscript that has been accepted for publication. As a service to our customers we are providing this early version of the manuscript. The manuscript will undergo copyediting, typesetting, and review of the resulting proof before it is published in its final citable form. Please note that during the production process errors may be discovered which could affect the content, and all legal disclaimers that apply to the journal pertain.
References
- 1.Mendizabal Y, Llorens S, Nava E. Hypertension in metabolic syndrome: vascular pathophysiology. Int J Hypertens. 2013;2013:230868. doi: 10.1155/2013/230868. [DOI] [PMC free article] [PubMed] [Google Scholar]
- 2.Li C, Ford ES, McGuire LC, Mokdad AH. Increasing trends in waist circumference and abdominal obesity among US adults. Obesity (Silver Spring) 2007;15:216–224. doi: 10.1038/oby.2007.505. [DOI] [PubMed] [Google Scholar]
- 3.Empana JP, Ducimetiere P, Charles MA, Jouven X. Sagittal abdominal diameter and risk of sudden death in asymptomatic middle-aged men: the Paris Prospective Study I. Circulation. 2004;110:2781–2785. doi: 10.1161/01.CIR.0000146395.64065.BA. [DOI] [PubMed] [Google Scholar]
- 4.Canoy D, Boekholdt SM, Wareham N, Luben R, Welch A, Bingham S, Buchan I, Day N, Khaw KT. Body fat distribution and risk of coronary heart disease in men and women in the European Prospective Investigation Into Cancer and Nutrition in Norfolk cohort: a population-based prospective study. Circulation. 2007;116:2933–2943. doi: 10.1161/CIRCULATIONAHA.106.673756. [DOI] [PubMed] [Google Scholar]
- 5.Zhang C, Rexrode KM, van Dam RM, Li TY, Hu FB. Abdominal obesity and the risk of all-cause, cardiovascular, and cancer mortality: sixteen years of follow-up in US women. Circulation. 2008;117:1658–1667. doi: 10.1161/CIRCULATIONAHA.107.739714. [DOI] [PubMed] [Google Scholar]
- 6.Faber DR, de Groot PG, Visseren FL. Role of adipose tissue in haemostasis, coagulation and fibrinolysis. Obes Rev. 2009;10:554–563. doi: 10.1111/j.1467-789X.2009.00593.x. [DOI] [PubMed] [Google Scholar]
- 7.Foster MT, Pagliassotti MJ. Metabolic alterations following visceral fat removal and expansion: Beyond anatomic location. Adipocyte. 2012;1:192–199. doi: 10.4161/adip.21756. [DOI] [PMC free article] [PubMed] [Google Scholar]
- 8.Kelly KR, Kashyap SR, O’Leary VB, Major J, Schauer PR, Kirwan JP. Retinol-binding protein 4 (RBP4) protein expression is increased in omental adipose tissue of severely obese patients. Obesity (Silver Spring) 2010;18:663–666. doi: 10.1038/oby.2009.328. [DOI] [PMC free article] [PubMed] [Google Scholar]
- 9.Martinez-Garcia MA, Montes-Nieto R, Fernandez-Duran E, Insenser M, Luque-Ramirez M, Escobar-Morreale HF. Evidence for masculinization of adipokine gene expression in visceral and subcutaneous adipose tissue of obese women with polycystic ovary syndrome (PCOS) J Clin Endocrinol Metab. 2013;98:E388–396. doi: 10.1210/jc.2012-3414. [DOI] [PubMed] [Google Scholar]
- 10.Szabova M, Jahnova E, Horvathova M, Ilavska S, Pruzincova V, Nemessanyi T, Tulinska J, Wsolova L, Volkovova K. Changes in immunologic parameters of humoral immunity and adipocytokines in obese persons are gender dependent. Hum Immunol. 2012;73:486–492. doi: 10.1016/j.humimm.2012.02.006. [DOI] [PubMed] [Google Scholar]
- 11.Samad F, Pandey M, Loskutoff DJ. Tissue factor gene expression in the adipose tissues of obese mice. Proc Natl Acad Sci U S A. 1998;95:7591–7596. doi: 10.1073/pnas.95.13.7591. [DOI] [PMC free article] [PubMed] [Google Scholar]
- 12.Devaraj S, Rosenson RS, Jialal I. Metabolic syndrome: an appraisal of the pro-inflammatory and procoagulant status. Endocrinol Metab Clin North Am. 2004;33:431–453. doi: 10.1016/j.ecl.2004.03.008. table of contents. [DOI] [PubMed] [Google Scholar]
- 13.Moitra J, Mason MM, Olive M, Krylov D, Gavrilova O, et al. Life without white fat: a transgenic mouse. Genes Dev. 1998;12:3168–3181. doi: 10.1101/gad.12.20.3168. [DOI] [PMC free article] [PubMed] [Google Scholar]
- 14.Godsland IF, Crook D, Proudler AJ, Stevenson JC. Hemostatic risk factors and insulin sensitivity, regional body fat distribution, and the metabolic syndrome. J Clin Endocrinol Metab. 2005;90:190–197. doi: 10.1210/jc.2004-1292. [DOI] [PubMed] [Google Scholar]
- 15.Napoli JL. Retinoic acid biosynthesis and metabolism. FASEB J. 1996;10:993–1001. doi: 10.1096/fasebj.10.9.8801182. [DOI] [PubMed] [Google Scholar]
- 16.Duester G. Retinoic acid synthesis and signaling during early organogenesis. Cell. 2008;134:921–931. doi: 10.1016/j.cell.2008.09.002. [DOI] [PMC free article] [PubMed] [Google Scholar]
- 17.Germain P, Chambon P, Eichele G, Evans RM, Lazar MA, Leid M, De Lera AR, Lotan R, Mangelsdorf DJ, Gronemeyer H. International Union of Pharmacology. LX Retinoic acid receptors Pharmacol Rev. 2006;58:712–725. doi: 10.1124/pr.58.4.4. [DOI] [PubMed] [Google Scholar]
- 18.Germain P, Chambon P, Eichele G, Evans RM, Lazar MA, Leid M, De Lera AR, Lotan R, Mangelsdorf DJ, Gronemeyer H. International Union of Pharmacology. LXIII. Retinoid X receptors. Pharmacol Rev. 2006;58:760–772. doi: 10.1124/pr.58.4.7. [DOI] [PubMed] [Google Scholar]
- 19.Yasmeen R, Jeyakumar SM, Reichert B, Yang F, Ziouzenkova O. The contribution of vitamin A to autocrine regulation of fat depots. BBA - Molecular and Cell Biology of Lipids. 2011;1821:190–197. doi: 10.1016/j.bbalip.2011.06.004. [DOI] [PMC free article] [PubMed] [Google Scholar]
- 20.Tsai YC, Chang HW, Chang TT, Lee MS, Chu YT, Hung CH. Effects of all-trans retinoic acid on Th1- and Th2-related chemokines production in monocytes. Inflammation. 2008;31:428–433. doi: 10.1007/s10753-008-9095-x. [DOI] [PubMed] [Google Scholar]
- 21.Benkoussa M, Brand C, Delmotte MH, Formstecher P, Lefebvre P. Retinoic acid receptors inhibit AP1 activation by regulating extracellular signal-regulated kinase and CBP recruitment to an AP1-responsive promoter. Mol Cell Biol. 2002;22:4522–4534. doi: 10.1128/MCB.22.13.4522-4534.2002. [DOI] [PMC free article] [PubMed] [Google Scholar]
- 22.Cheng YH, Yin P, Xue Q, Yilmaz B, Dawson MI, Bulun SE. Retinoic acid (RA) regulates 17beta-hydroxysteroid dehydrogenase type 2 expression in endometrium: interaction of RA receptors with specificity protein (SP) 1/SP3 for estradiol metabolism. J Clin Endocrinol Metab. 2008;93:1915–1923. doi: 10.1210/jc.2007-1536. [DOI] [PMC free article] [PubMed] [Google Scholar]
- 23.Berry DC, Jin H, Majumdar A, Noy N. Signaling by vitamin A and retinol-binding protein regulates gene expression to inhibit insulin responses. Proc Natl Acad Sci U S A. 2011;108:4340–4345. doi: 10.1073/pnas.1011115108. [DOI] [PMC free article] [PubMed] [Google Scholar]
- 24.Johnson AR, Milner JJ, Makowski L. The inflammation highway: metabolism accelerates inflammatory traffic in obesity. Immunol Rev. 2012;249:218–238. doi: 10.1111/j.1600-065X.2012.01151.x. [DOI] [PMC free article] [PubMed] [Google Scholar]
- 25.Trayhurn P, Wood IS. Adipokines: inflammation and the pleiotropic role of white adipose tissue. Br J Nutr. 2004;92:347–355. doi: 10.1079/bjn20041213. [DOI] [PubMed] [Google Scholar]
- 26.Edgington TS, Mackman N, Fan ST, Ruf W. Cellular immune and cytokine pathways resulting in tissue factor expression and relevance to septic shock. Nouv Rev Fr Hematol. 1992;34(Suppl):S15–27. [PubMed] [Google Scholar]
- 27.Rosales FJ, Ross AC. Acute inflammation induces hyporetinemia and modifies the plasma and tissue response to vitamin A supplementation in marginally vitamin A-deficient rats. J Nutr. 1998;128:960–966. doi: 10.1093/jn/128.6.960. [DOI] [PubMed] [Google Scholar]
- 28.Reichert B, Yasmeen R, Jeyakumar SM, Yang F, Thomou T, et al. Concerted Action of Aldehyde Dehydrogenases Influences Depot-Specific Fat Formation. Mol Endocrinol. 2011;25:799–809. doi: 10.1210/me.2010-0465. [DOI] [PMC free article] [PubMed] [Google Scholar]
- 29.Rosen ED, Sarraf P, Troy AE, Bradwin G, Moore K, Milstone DS, Spiegelman BM, Mortensen RM. PPAR gamma is required for the differentiation of adipose tissue in vivo and in vitro. Mol Cell. 1999;4:611–617. doi: 10.1016/s1097-2765(00)80211-7. [DOI] [PubMed] [Google Scholar]
- 30.Glass CK, Saijo K. Nuclear receptor transrepression pathways that regulate inflammation in macrophages and T cells. Nat Rev Immunol. 2010;10:365–376. doi: 10.1038/nri2748. [DOI] [PubMed] [Google Scholar]
- 31.Yasmeen R, Reichert B, Deiuliis J, Yang F, Lynch A, et al. Autocrine function of aldehyde dehydrogenase 1 as a determinant of diet- and sex-specific differences in visceral adiposity. Diabetes. 2013;62:124–136. doi: 10.2337/db11-1779. [DOI] [PMC free article] [PubMed] [Google Scholar]
- 32.Tsutsumi C, Okuno M, Tannous L, Piantedosi R, Allan M, Goodman DS, Blaner WS. Retinoids and retinoid-binding protein expression in rat adipocytes. J Biol Chem. 1992;267:1805–1810. [PubMed] [Google Scholar]
- 33.Zhang Y, Li R, Li Y, Chen W, Zhao S, Chen G. Vitamin A status affects obesity development and hepatic expression of key genes for fuel metabolism in Zucker fatty rats. Biochem Cell Biol. 2012;90:548–557. doi: 10.1139/o2012-012. [DOI] [PubMed] [Google Scholar]
- 34.Jeyakumar SM, Vijaya Kumar P, Giridharan NV, Vajreswari A. Vitamin A improves insulin sensitivity by increasing insulin receptor phosphorylation through protein tyrosine phosphatase 1B regulation at early age in obese rats of WNIN/Ob strain. Diabetes Obes Metab. 2011;13:955–958. doi: 10.1111/j.1463-1326.2011.01407.x. [DOI] [PubMed] [Google Scholar]
- 35.Lu J, Field CJ, Basu TK. The immune responses to diabetes in BB rats supplemented with vitamin A. J Nutr Biochem. 2000;11:515–520. doi: 10.1016/s0955-2863(00)00114-5. [DOI] [PubMed] [Google Scholar]
- 36.Kelley SK, Green MH. Plasma retinol is a major determinant of vitamin A utilization in rats. J Nutr. 1998;128:1767–1773. doi: 10.1093/jn/128.10.1767. [DOI] [PubMed] [Google Scholar]
- 37.Fan X, Molotkov A, Manabe S, Donmoyer CM, Deltour L, Foglio MH, Cuenca AE, Blaner WS, Lipton SA, Duester G. Targeted disruption of Aldh1a1 (Raldh1) provides evidence for a complex mechanism of retinoic acid synthesis in the developing retina. Mol Cell Biol. 2003;23:4637–4648. doi: 10.1128/MCB.23.13.4637-4648.2003. [DOI] [PMC free article] [PubMed] [Google Scholar]
- 38.Ziouzenkova O, Orasanu G, Sharlach M, Akiyama TE, Berger JP, et al. Retinaldehyde represses adipogenesis and diet-induced obesity. Nat Med. 2007;13:695–702. doi: 10.1038/nm1587. [DOI] [PMC free article] [PubMed] [Google Scholar]
- 39.Matthews DR, Hosker JP, Rudenski AS, Naylor BA, Treacher DF, Turner RC. Homeostasis model assessment: insulin resistance and beta-cell function from fasting plasma glucose and insulin concentrations in man. Diabetologia. 1985;28:412–419. doi: 10.1007/BF00280883. [DOI] [PubMed] [Google Scholar]
- 40.Berry DC, Noy N. All-trans-retinoic acid represses obesity and insulin resistance by activating both peroxisome proliferation-activated receptor beta/delta and retinoic acid receptor. Mol Cell Biol. 2009;29:3286–3296. doi: 10.1128/MCB.01742-08. [DOI] [PMC free article] [PubMed] [Google Scholar]
- 41.Bonet ML, Ribot J, Felipe F, Palou A. Vitamin A and the regulation of fat reserves. Cell Mol Life Sci. 2003;60:1311–1321. doi: 10.1007/s00018-003-2290-x. [DOI] [PMC free article] [PubMed] [Google Scholar]
- 42.Zhang M, Hu P, Krois CR, Kane MA, Napoli JL. Altered vitamin A homeostasis and increased size and adiposity in the rdh1-null mouse. FASEB J. 2007;21:2886–2896. doi: 10.1096/fj.06-7964com. [DOI] [PubMed] [Google Scholar]
- 43.Weiss TW, Arnesen H, Troseid M, Kaun C, Hjerkinn EM, Huber K, Wojta J, Seljeflot I. Adipose tissue expression of interleukin-18 mRNA is elevated in subjects with metabolic syndrome and independently associated with fasting glucose. Wien Klin Wochenschr. 2011;123:650–654. doi: 10.1007/s00508-011-0028-6. [DOI] [PubMed] [Google Scholar]
- 44.Uchida Y, Takeshita K, Yamamoto K, Kikuchi R, Nakayama T, Nomura M, Cheng XW, Egashira K, Matsushita T, Nakamura H, Murohara T. Stress augments insulin resistance and prothrombotic state: role of visceral adipose-derived monocyte chemoattractant protein-1. Diabetes. 2012;61:1552–1561. doi: 10.2337/db11-0828. [DOI] [PMC free article] [PubMed] [Google Scholar]
- 45.Kurki E, Shi J, Martonen E, Finckenberg P, Mervaala E. Distinct effects of calorie restriction on adipose tissue cytokine and angiogenesis profiles in obese and lean mice. Nutr Metab (Lond) 2012;9:64. doi: 10.1186/1743-7075-9-64. [DOI] [PMC free article] [PubMed] [Google Scholar]
- 46.Felipe F, Bonet ML, Ribot J, Palou A. Up-regulation of muscle uncoupling protein 3 gene expression in mice following high fat diet, dietary vitamin A supplementation and acute retinoic acid-treatment. Int J Obes Relat Metab Disord. 2003;27:60–69. doi: 10.1038/sj.ijo.0802188. [DOI] [PubMed] [Google Scholar]
- 47.Bruckert E, Ankri A, Jung M, Turpin G, De Gennes JL. Mild liver abnormalities associated with elevated plasma factor VII and protein C in hypertriglyceridaemic patients. Eur J Med. 1993;2:461–465. [PubMed] [Google Scholar]
- 48.Cigolini M, Targher G, Agostino G, Tonoli M, Muggeo M, De Sandre G. Liver steatosis and its relation to plasma haemostatic factors in apparently healthy men--role of the metabolic syndrome. Thromb Haemost. 1996;76:69–73. [PubMed] [Google Scholar]
- 49.Targher G, Bertolini L, Scala L, Zoppini G, Zenari L, Falezza G. Non-alcoholic hepatic steatosis and its relation to increased plasma biomarkers of inflammation and endothelial dysfunction in non-diabetic men. Role of visceral adipose tissue. Diabet Med. 2005;22:1354–1358. doi: 10.1111/j.1464-5491.2005.01646.x. [DOI] [PubMed] [Google Scholar]
- 50.Yalcin SS, Gunes B, Unal S, Gumruk F, Coskun T. Antihyperlipidemic agents cause a decrease in von Willebrand factor levels in pediatric patients with familial hyperlipidemia. J Pediatr Endocrinol Metab. 2010;23:765–771. doi: 10.1515/jpem.2010.126. [DOI] [PubMed] [Google Scholar]
- 51.Scheerens H, Hessel E, de Waal-Malefyt R, Leach MW, Rennick D. Characterization of chemokines and chemokine receptors in two murine models of inflammatory bowel disease: IL-10-/- mice and Rag-2-/- mice reconstituted with CD4+CD45RBhigh T cells. Eur J Immunol. 2001;31:1465–1474. doi: 10.1002/1521-4141(200105)31:5<1465::AID-IMMU1465>3.0.CO;2-E. [DOI] [PubMed] [Google Scholar]
- 52.Collins CB, Aherne CM, Kominsky D, McNamee EN, Lebsack MD, Eltzschig H, Jedlicka P, Rivera-Nieves J. Retinoic acid attenuates ileitis by restoring the balance between T-helper 17 and T regulatory cells. Gastroenterology. 2011;141:1821–1831. doi: 10.1053/j.gastro.2011.05.049. [DOI] [PMC free article] [PubMed] [Google Scholar]
- 53.Marchetti M, Vignoli A, Bani MR, Balducci D, Barbui T, Falanga A. All-trans retinoic acid modulates microvascular endothelial cell hemostatic properties. Haematologica. 2003;88:895–905. [PubMed] [Google Scholar]
- 54.Tenno T, Botling J, Oberg F, Jossan S, Nilsson K, Siegbahn A. The role of RAR and RXR activation in retinoid-induced tissue factor suppression. Leukemia. 2000;14:1105–1111. doi: 10.1038/sj.leu.2401785. [DOI] [PubMed] [Google Scholar]
- 55.Gillespie RF, Gudas LJ. Retinoic acid receptor isotype specificity in F9 teratocarcinoma stem cells results from the differential recruitment of coregulators to retinoic response elements. J Biol Chem. 2007;282:33421–33434. doi: 10.1074/jbc.M704845200. [DOI] [PubMed] [Google Scholar]
- 56.Marino D, Dabouras V, Brandli AW, Detmar M. A role for all-trans-retinoic acid in the early steps of lymphatic vasculature development. J Vasc Res. 2011;48:236–251. doi: 10.1159/000320620. [DOI] [PMC free article] [PubMed] [Google Scholar]
- 57.Cleuren AC, van Hoef B, Hoylaerts MF, van Vlijmen BJ, Lijnen HR. Short-term ethinyl estradiol treatment suppresses inferior caval vein thrombosis in obese mice. Thromb Haemost. 2009;102:993–1000. doi: 10.1160/TH09-03-0169. [DOI] [PubMed] [Google Scholar]
- 58.Vandanmagsar B, Youm YH, Ravussin A, Galgani JE, Stadler K, Mynatt RL, Ravussin E, Stephens JM, Dixit VD. The NLRP3 inflammasome instigates obesity-induced inflammation and insulin resistance. Nat Med. 2011;17:179–188. doi: 10.1038/nm.2279. [DOI] [PMC free article] [PubMed] [Google Scholar]
- 59.Skopkova M, Penesova A, Sell H, Radikova Z, Vlcek M, Imrich R, Koska J, Ukropec J, Eckel J, Klimes I, Gasperikova D. Protein array reveals differentially expressed proteins in subcutaneous adipose tissue in obesity. Obesity (Silver Spring) 2007;15:2396–2406. doi: 10.1038/oby.2007.285. [DOI] [PubMed] [Google Scholar]