Abstract
Complex organisms rely on experience to optimize the function of perceptual and motor systems in situations relevant to survival. It is well established that visual cues reliably paired with danger are processed more efficiently than neutral cues and that such facilitated sensory processing extends to low levels of the visual system. The neurophysiological mechanisms mediating biased sensory processing however are not well understood. Here we used grating stimuli specifically designed to engage luminance or chromatic pathways of the human visual system in a differential classical conditioning paradigm. Behavioral ratings and visual electroencephalographic steady-state potentials were recorded in healthy human participants. Our findings indicate that the visuo-cortical response to high spatial frequency, isoluminant (red-green) grating stimuli was not modulated by fear conditioning, but low-contrast, low spatial frequency reversal of grayscale gratings resulted in pronounced conditioning effects. We conclude that sensory input conducted via the chromatic pathways into retinotopic visual cortex has limited access to the bi-directional connectivity with brain networks mediating the acquisition and expression of fear, such as the amygdaloid complex. Conversely, luminance information is necessary to establish amplification of learned danger signals in hierarchically early regions of the visual system.
Keywords: Differential fear conditioning, visual learning, steady-state potentials, sensory biases
Introduction
A crucial function of sensory systems is to facilitate adaptive behavior in constantly changing environments. Hence, recurring cues that reliably predict impending danger or reward elicit enhanced sensory processing (Sokolov, 1963). In the mammalian brain, aversive and appetitive learning leads to cue-related retuning of neuronal response profiles within primary sensory cortex (Weinberger, 2004; Shuler & Bear, 2006), driven perhaps by lowering response thresholds or altering synaptic connectivity in primary representation areas (Keil et al., 2007) potentially via re-entrant feedback originating in deep structures such as the amygdala (Amaral, 2003). Thus, sensory processing becomes biased towards affectively conditioned cues, which are more easily identified than non-relevant stimuli (Quirk et al., 1995). In the human visual system, such prioritization has been demonstrated with phobic content (Öhman et al., 2001) and during classical conditioning (Moratti et al., 2006), where neutral stimuli (i.e., the CS+) paired with noxious events (e.g., electric shock) elicit facilitated sensory responses, compared to the non-paired stimuli (i.e., the CS−; Stolarova et al., 2006). It remains unclear however what sensory pathways mediate the acquisition of threat-cue specific response amplification.
Work examining the perception of emotional faces or complex scenes has attempted to uncover the precise compositional features that drive sensory facilitation by manipulating the physical properties of images, thus challenging specific subsystems within the visual system (Bocanegra & Zeelenberg, 2009). This research suggests that perceptual biases for threat-related stimuli may depend on the brain’s ability to extract information from low spatial frequency and luminance channels, sometimes equated with the magnocellular pathway of the human visual system (Pourtois et al., 2005). For instance, effects of spatial frequency on electrophysiological indices of emotion perception are observed for visual ERPs such as the N1 (Carretie et al., 2007) but not for late positivities (>300 ms latency) to complex affective scenes (De Cesarei & Codispoti, 2011) or conditioned cues (Baas et al., 2002).
One may hypothesize that different visual pathways vary in their ability to mediate experience-dependent sensory amplification of learned danger signals. In this study, we tested this hypothesis by preferentially stimulating distinct pathways: (i) luminance and (ii) chromatic pathways. The latter pathways processes chromatic signals derived from two channels: the first channel is sensitive to reddish-greenish hue variations through coding the weighted difference of L and M differential cone excitations (L−M) and the second channel is sensitive to bluish-yellowish hue variations through coding the weighted difference between the differential S-cone and the summed differential L and M cone excitations (S−(L+M); (for review, see Stockman & Brainard, 2010). Meanwhile, the luminance pathway responds to a sum of weighted long-wave (L), middle-wave (M) and, under certain conditions (Ripamonti et al., 2009), short-wave (S) differential cone excitations (L+M+S).
In a classical differential fear conditioning design where the orientation of grating stimuli predicted the occurrence of an aversive loud noise, we used either isoluminant (chromatic) or grayscale (luminance) pattern reversal at stable temporal rates to evoke steady-state visual potentials (ssVEPs) in the visual cortex. Only the luminance pathway, potentially via preferential access to deep brain structures involved in fear conditioning, was expected to mediate robust CS+ specific sensory enhancement.
Materials and Methods
Participants
Twenty-six (16 female) students from University of Florida undergraduate psychology courses participated for course credit. The mean age was 19.5 years (SD 1.1 years). All participants reported normal or corrected to normal vision and a negative personal and family history of seizure disorder. All procedures were in accordance with the Declaration of Helsinki, and the study was approved by the Institutional Review Board of the University of Florida. All participants provided written informed consent.
Stimuli and Design
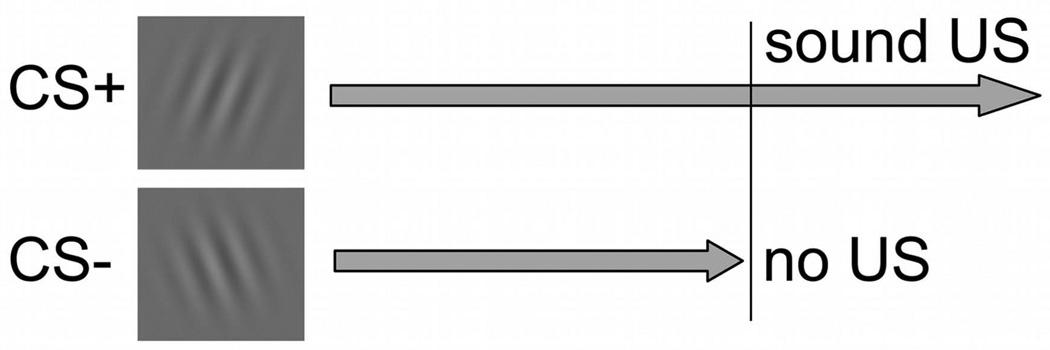
A differential delay classical conditioning design was used, in which the orientation of a phase-reversing Gabor patch signaled the presence (CS+) or absence (CS−) of an unconditioned stimulus (US) in the form of a 92-dB sound pressure level (SPL) white noise, presented through speaker boxes placed next to the participant. During the acquisition phase, the US was presented during the final interval of CS+ presentation and set to co-terminate with CS+ during the conditioning trials using a 100% reinforcement ratio (see Figure 1). Both CSs were sinusoidal gratings multiplied with a Gaussian envelope (Gabor patch) and were oriented either at 15° or 345° relative to the vertical meridian. The assignment of Gabor patch orientations to conditions (i.e., CS+ signaling threat and CS− signaling safe) was counterbalanced across participants. Stimuli were designed to preferentially engage either the luminance-based or the chromatic-based channels of the human visual system. The low spatial frequency, luminance stimulus consisted of a pair of anti-phasic Gabor patches with 7 cycles, covering 8 degrees of visual angle (20.7 cm on the screen surface and viewed from 1.5 m distance). They were designed to have 6.8% Michelson contrast and a low spatial frequency of .875 cpd. The lightest point of the Gabor patch was 47 cd/m2 and the darkest point was 41 cd/m2. The high spatial frequency, chromatic stimuli were two isoluminant (see below) gray-and-green and red-and-green Gabor patches with 29 cycles, covering 8 degrees of visual angle (3.625 cpd). Both stimuli were shown on a gray background with a luminance of 44 cd/m2.
Figure 1.
Differential classical conditioning paradigm, in which the orientation of the grating stimuli (Gabor patches) predicts the occurrence of a noxious stimulus. In the present study, the CS+ predicting the loud noise (US) is presented alone for 6.7 or 7.1 seconds, then accompanied by the US for an additional 1.3 seconds, upon which the stimuli co-terminate. The CS− is never paired with the US, and terminates after 6.7 or 7.1 seconds, respectively.
Steady-state VEPs were elicited by pattern reversal for both the low spatial frequency, luminance and the high spatial frequency, chromatic stimuli. Two different reversal rates were used to drive the visual system. Presentation alternated between a stimulus and its counterpart at a rate of 15 Hz (7.5 Hz for a full cycle of both patterns; 16 participants) or 14 Hz (7 Hz for a full cycle; 10 participants) to produce pattern-reversal ssVEPs at the first harmonic of the full cycle frequency.
Stimuli were shown on a Sony CRT monitor set to a refresh rate of 60 Hz (15 Hz condition) or 70 Hz (14 Hz condition). The same ssVEP frequencies were also used in a session preceding the experiment proper, in which isoluminance was determined by means of flicker photometry. Using monochromatic circles embedded in a gray (first step) or monochromatic (second step) field, observers first adjusted the intensity of the red gun of the CRT until no flicker was perceived between alternating red and gray (set to 44.7 cd/m2). In a next step, the green gun was adjusted such that no flicker was perceived when alternating between red and green. Color trivalues were stored and used throughout the conditioning sessions for a given participant.
Procedure and design
The experiment consisted of 72 trials in total: 24 habituation trials, 24 acquisition trials, and 24 extinction trials. Stimulus presentation was randomized and fully balanced in each phase, and during acquisition, one of the stimulus orientations signaled the imminent US noise. All trials except for the CS+ acquisition trials were 6.666 s (100 cycles at 15 Hz) or 7.142 s (100 cycles at 14 Hz) in length. During the acquisition period, 20 cycles were appended at the end of the CS+ trials (1.333 s in the 15 Hz condition, 1.428 s in the 14 Hz condition) to accommodate concurrent presentation of CS+ with the US. Following each trial was a variable inter-trial interval of 9–12 s.
Participants were seated in a sound-attenuated, electrically shielded chamber with very dim lighting. An IBM-compatible computer was used for stimulus presentation, running MATLAB in conjunction with functions from the Psychtoolbox stimulus control suite (Brainard, 1997). The EEG sensor net was applied and participants were given oral instructions to fixate, avoid eye movements and blinks, and to expect occasional loud noises. No instructions regarding the contingencies were given. In addition to the spoken instructions, participants also viewed on-screen instructions before each phase of the experiment. After each experimental phase, participants rated the hedonic valence and emotional arousal of each stimulus in the experiment using the self-assessment manikin (SAM), a 9-level scale pictorial measure of affective evaluation (Lang, 1980). At the end of the experiment, all participants were debriefed and all reported contingency awareness, including discrimination of the CS+ during acquisition.
EEG Recording and Data Collection
The electroencephalogram (EEG) was continuously recorded from 257 electrodes by means of an Electrical Geodesics (EGI) high-density sensor net, using Cz as the recording reference and keeping impedances below 60 kΩ. This sensor net provides extensive coverage over occipital regions, including dense coverage around and inferior to the occipital pole, which is helpful for capturing activity in retinotopic areas of the visual system (Foxe and Simpson, 2002). Data was sampled at a rate of 250 Hz with an online bandpass filter set at 0.1 Hz high-pass and 50 Hz low-pass. Additional data processing occurred offline by means of EMEGS (ElectroMagnetic EncaphaloGraphy Software) for MATLAB (Peyk et al., 2011). Relative to stimulus onset, epochs were extracted from the raw EEG that included 400 ms pre- and 6600 ms post-onset for all conditions. Data were then filtered using a 25 Hz low-pass (cut-off at 3 dB point; 45 dB/octave, 10th order Butterworth) and a 1 Hz high-pass (cut-off at 3 dB point; 18 dB/octave, 4th order Butterworth). Then, statistical parameters were used to find and remove artifact-contaminated channels and trials (Junghofer et al., 2000): the original recording reference (Cz) was first used to detect recording artifacts, and then the data was average referenced to detect global artifacts. Subsequently, bad sensors within individual trials were identified and interpolated based on rejection criteria for amplitude, standard deviation, and gradient. After artifact correction, an average of 18.2 trials per condition (range: 12 to 23) were retained for analysis.
Data reduction and statistical analysis
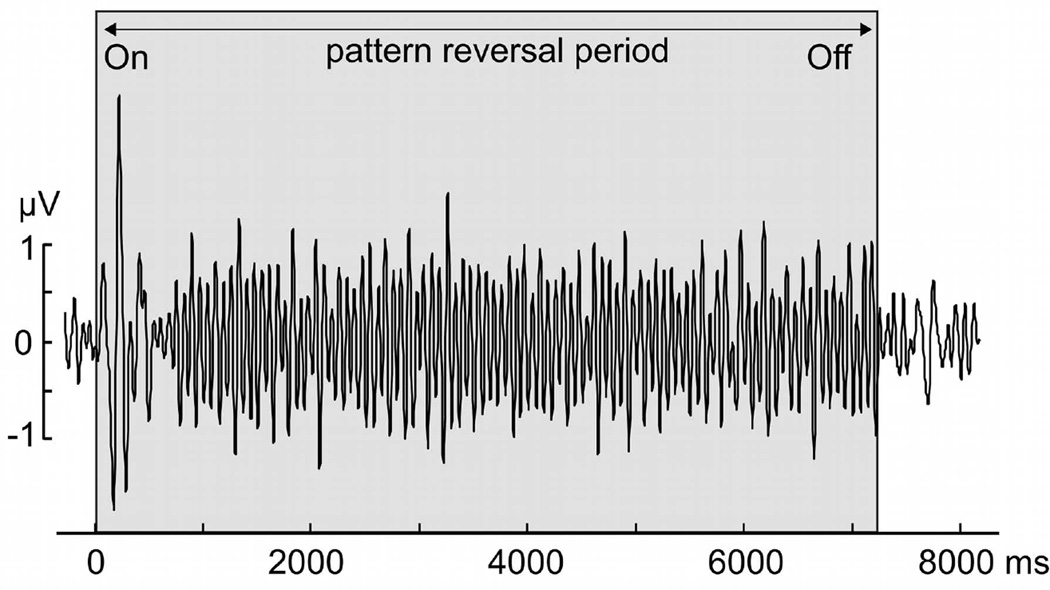
Artifact free segments were averaged in the time domain, following the factorial design of the present study, with phase (habituation, acquisition, extinction), CS type (CS+, CS−), and stimulus type (luminance stimulus, chromatic stimulus). An example time domain average is shown in Figure 2. These averages were then transformed into the frequency domain using a Fourier transform of the last 3200 ms (800 sample points) of CS− alone presentation (prior to the US presentation in CS+ acquisition trials). In both the 15 and 14 Hz conditions data were windowed with a cosine square window (20 points rise/fall) and then padded with zeros for a total segment length of 4000 ms, resulting in 0.25 Hz frequency resolution. The late segment was selected based on previous work showing pronounced ssVEP amplitude increase for the CS+ in the time segment immediately preceding the US (Moratti & Keil, 2005; Moratti et al., 2006). Fourier coefficients were normalized by the number of points and the ssVEP amplitude extracted as the absolute value of the Fourier coefficients at the respective driving frequency (14 Hz; 15 Hz). For statistical analyses, the resulting amplitude estimates were pooled across the EGI sensor corresponding to site Oz of the International 10–20 System, where the spectral amplitude was maximal, and its 4 nearest neighbors. Thus, an ssVEP amplitude estimate was generated for each participant, phase, and condition, resulting in 12 estimates per participant. To reduce the known large inter-individual variability in ssVEP magnitude, a z-transformation was applied to these 12 estimates, using each individual’s overall mean (across phases and conditions) and standard deviation. The normalized signal change at the driving ssVEP frequency was then evaluated by means of an omnibus mixed-model ANOVA, with CS TYPE (CS+, CS−), PHASE (Baseline, Conditioning, Extinction) and STIMULUS (Luminance, Chromatic) as the within-subject factors and TAGGING FREQUENCY (14Hz, 15Hz) as the between-subjects factor. Rating data obtained after each experimental phase were submitted to the same statistical model. A CS TYPE × PHASE interaction was deemed necessary for inferring a conditioning effect and served as a prerequisite for conducting follow-up ANOVAs. An alpha level of 0.05 (two-tailed) was employed for all analyses.
Figure 2.
Example of the time-domain representation of the ssVEP recorded at the occipital midline electrode location (Oz) when viewing the luminance stimulus, from one representative participant, in the 14 Hz condition. The signal is averaged across experimental phases and conditions, and shows the entrainment of visual cortical areas at the reversal rate of 14 cycles per second.
Results
Rating data
Ratings of hedonic valence and emotional arousal collected after the end of each experimental phase demonstrated clear evidence of fear conditioning. Across reversal frequencies and stimulus types, participants rated the CS+ as more unpleasant (i.e., lower in hedonic valence) than the CS− solely during the acquisition phase [F(1,25)=35.90, p<.001, ηp2 =.59], resulting in a CS TYPE × PHASE interaction [F(2,50)=19.32, p < .001, ηp2 =.44] in the overall model. No differences were observed during the habituation and extinction phases (all Fs< 2.52, ps>.12). In terms of emotional arousal (intensity), main effects of experimental PHASE [F(2,48]=12.60, p<.001, ηp2 =.34] and of CS TYPE [F(1,24]=32.08, p<.001, ηp2 =.57] were qualified by an interaction of CS TYPE × PHASE [F(2,48]=18.68, p<.001, ηp2 =.44]. This interaction reflected the absence of CS related arousal effects during habituation (Fs<2.42, ps>.13), and extinction (Fs<2.71, ps>.10), and greater rated emotional arousal specifically in response to the CS+ during acquisition [F(1,25)=58.50, p<.001, ηp2 =.71]. Importantly, behavioral ratings were not affected by stimulus type.
ssVEPs
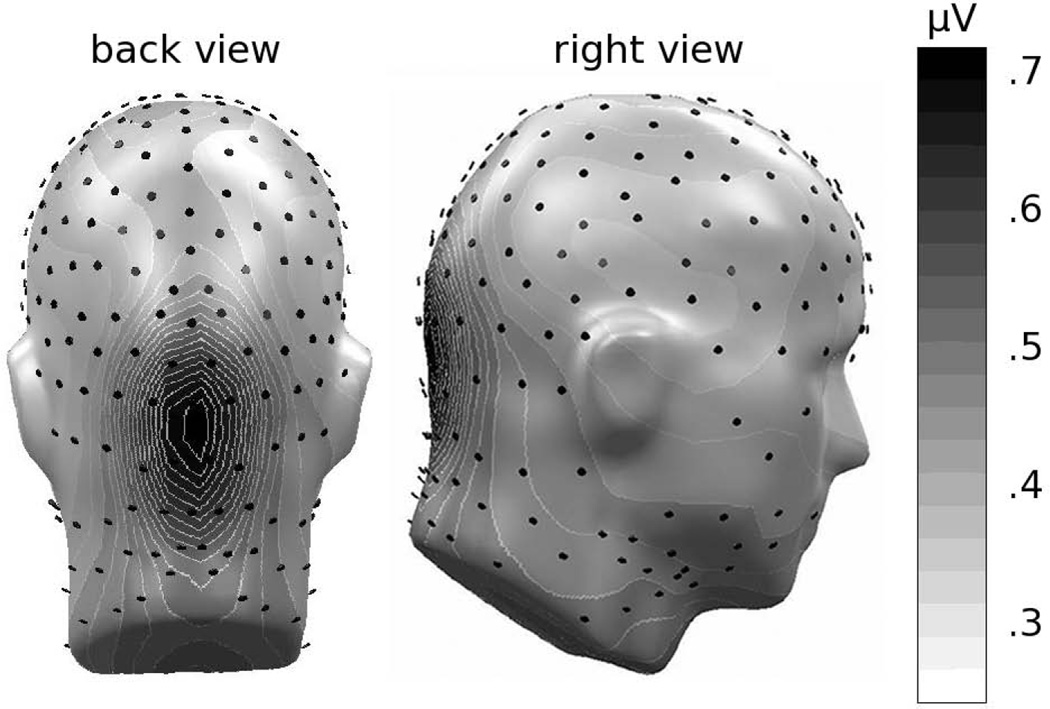
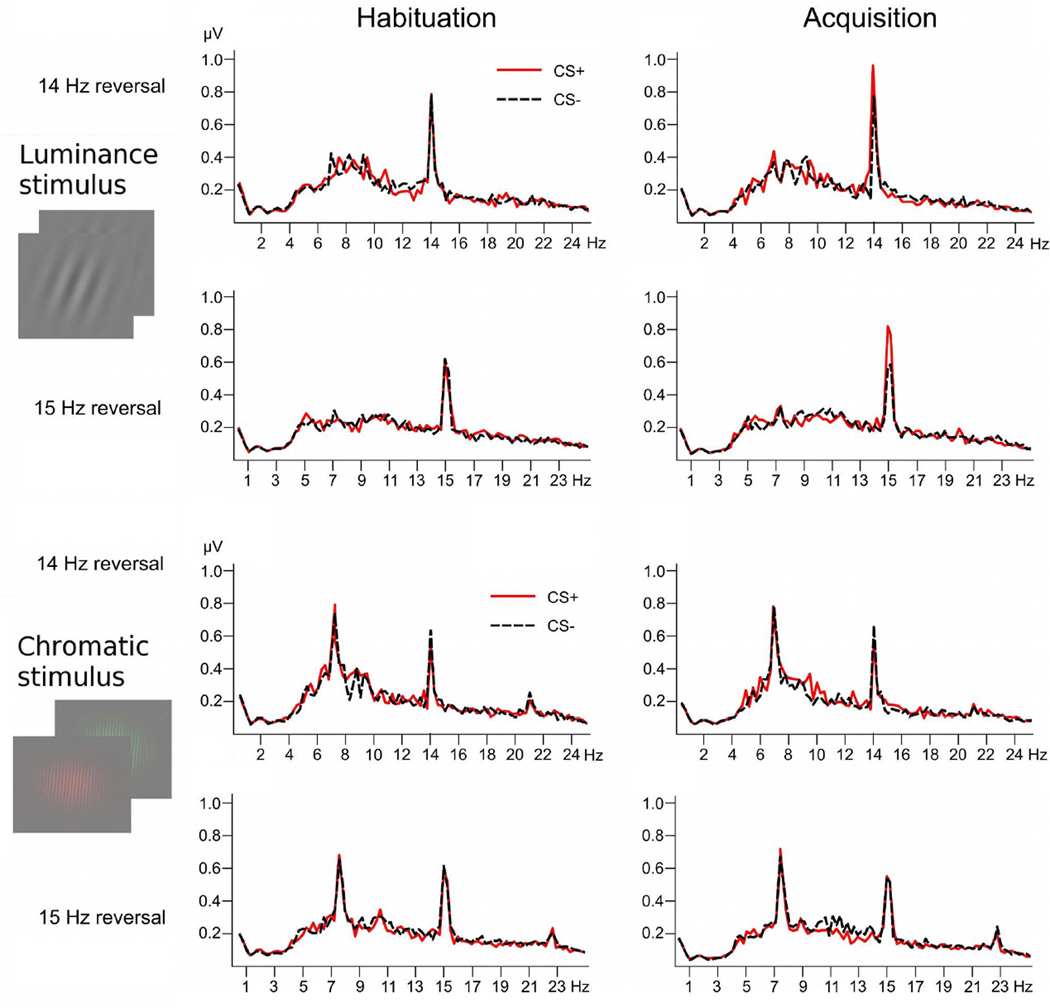
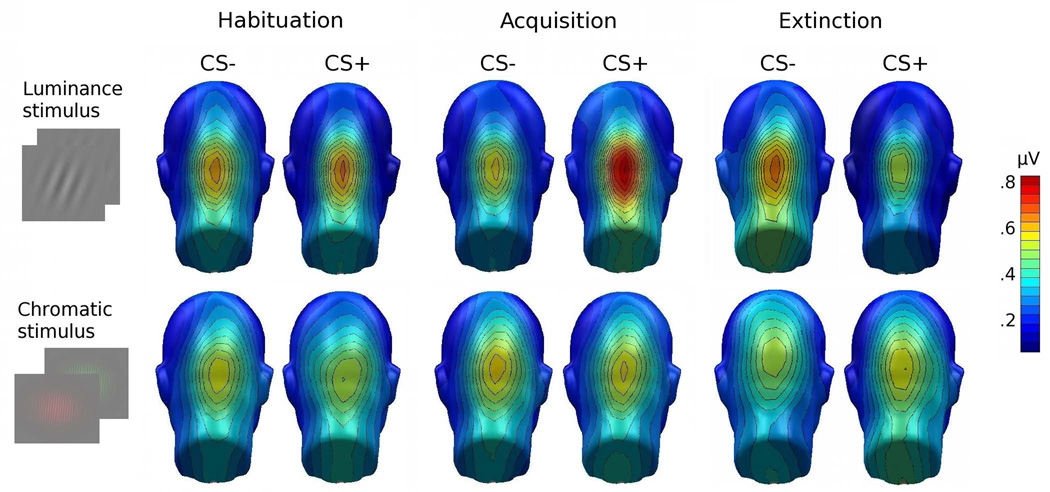
Both stimuli evoked strong and reliable ssVEPs at the reversal frequency, with a pronounced posterior topographical maximum (see Figure 3). Focusing on local ssVEP amplitude over a group of occipital sensors, we observed a significant three-way CS TYPE × PHASE × STIMULUS [F(2,48)=6.39, p=.003, ηp2 =.21] interaction. Since there were no significant effects involving TAGGING FREQUENCY (all ps > 0.103), this factor was dropped in subsequent analyses. As suggested by Figure 4, the crucial CS TYPE × PHASE interaction [F(2,50)=9.80, p < .001, ηp2 =.28] was observed for low spatial frequency, luminance stimuli only (chromatic stimuli, CS TYPE × PHASE F < 1, p > 0.77).
Figure 3.
Grand mean (n = 26) topographical distribution of the ssVEP amplitude across experimental phases and conditions. Spherical splines were used for topographical illustrations throughout this manuscript. Electrode locations are shown as black disks.
Figure 4.
Grand mean frequency spectra for both stimulus conditions and reversal rates, comparing the habituation and acquisition phase for the CS+ (red solid) and CS− gratings (black dashed), respectively. Spectra were calculated on the last 3200 ms of the time-domain averaged ssVEPs, where US presentation is imminent in the CS+ condition. Pronounced peaks at the reversal rates of 14 and 15 Hz are visible. Note that chromatic stimuli also showed a strong response at the fundamental frequency of the pattern reversal, which did not discriminate between conditions.
We next conducted a series of follow-up ANOVA contrasts on ssVEPs evoked by the low spatial frequency, luminance Gabor patches in each experimental phase. These analyses confirmed the visual impression conveyed by Figure 5; a CS+ specific enhancement at posterior sensors was observed during the conditioning [F(1,25)=6.25, p = .019, ηp2 =.20], but not the baseline phase (F < 1). Interestingly, this pattern of amplitude differences reversed during the extinction phase, leading to a CS− specific enhancement [F(1,25)=12.73, p = .001, ηp2 =.34].
Figure 5.
Topographical representations of the grand mean spectral amplitude, across reversal frequencies (n = 26), comparing ssVEP amplitude in response to the CS+ and CS− gratings, across all experimental phases, and for the luminance (top row) versus chromatic gratings (bottom row). Spectra were calculated on the last 3200 ms of the time-domain averaged ssVEPs, where US presentation is imminent in the CS+ condition. Maps are generated by means of spherical splines, including extrapolations to locations below the electrode array (Junghöfer et al., 1997).
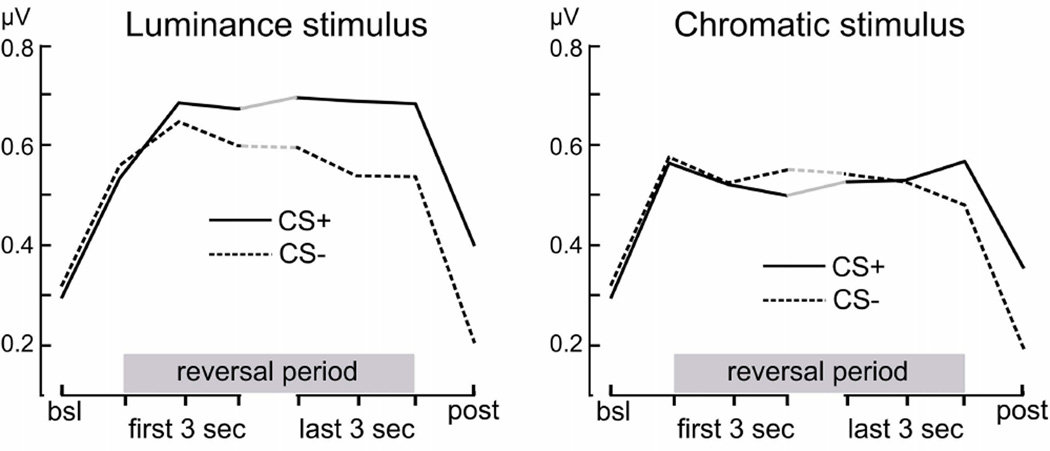
The suitability of the temporal window used for the overall ANOVAs above (the final 3200 ms of each segment) was tested in an additional method check, with discrete Fourier analyses conducted for 1-second segments across the time-domain averages for each condition. The normalized amplitude (divided by the number of time points) at the reversal rates was extracted from the spectrum in each time window and averaged across participants to result in time course data for each condition, across the viewing epoch. These data are shown for the acquisition phase in Figure 6. They suggest that, in line with earlier reports, the differential ssVEP amplification for the CS+ increases over the viewing epoch and tends to reach a maximum around the termination of the CSs. In the present study, this pattern was specific to the luminance stimulus. These findings confirm that the segment chosen for the main analyses appropriately reflects the desired variability among threat and safety cues.
Figure 6.
Grand mean (n = 26) time course of ssVEP amplitude measures across the viewing epoch, during the acquisition phase, shown separately for luminance and chromatic CS+ and CS− stimuli. Values represent spectral power at the reversal frequencies during an initial pre-stimulus baseline, during the first and last 3 seconds of reversal stimulation, and during the post-CS time window. Differential amplification of the luminance CS+ ssVEP increases over time and reaches a maximum at the end of the CS presentation.
To control for potential confounds of stimulation type and the kind of contrast underlying the ssVEP and to more closely parallel the luminance stimulus condition where the Gabor patches were reversed in anti-phase, we conducted an experiment with the chromatic condition in a separate group of individuals (n=12), where the same chromatic Gabor patches were reversed at 14 Hz, but red and green Gabor patches were presented in anti-phase, not in-phase as in the main study. Although strong driving was observed with anti-phase chromatic reversal on an isoluminant background, no differences emerged between safe (CS−) and threat (CS+) cues, all Fs<2.12, ps >.22.
Discussion
The present study examined the extent to which low spatial frequency, luminance versus high spatial frequency, chromatic visual information is critical for the acquisition of low-level visual sensory biases towards threat cues. Using a differential classical conditioning design with Gabor patch stimuli designed to preferentially activate either the luminance or the chromatic-driven human visual pathways, we found that an isoluminant stimulus that relied purely on chromatic contrast did not lead to an enhancement of threat-evoked visuocortical responses. By contrast, stimulating the luminance pathway by means of grayscale low-contrast, low spatial frequency pattern reversal resulted in pronounced conditioning effects. Specifically, we observed selectively enhanced neural response amplitudes for the CS+ relative to CS− during the acquisition phase of the experiment. This difference between the conditioned threat and safety signals was no longer present, and was in fact reversed, during extinction. It can be concluded that visual input conducted via the chromatic pathways into early visual cortex appears to have limited or no capacity for amplification deriving from aversive learning. By contrast, the lower-tier visual cortical response driven by the luminance pathway is facilitated within a few trials of classical conditioning when the eliciting stimulus predicts a noxious event.
The present study used the ssVEP as a dependent variable because it constitutes a high signal-to-noise brain response known to emanate to a large extent from peri-calcarine visual neurons in response to periodically modulated stimuli (Di Russo et al., 2007). As expected, we found strong and reliable oscillatory responses over sensors covering the visual cortex at the reversal frequencies of 14 and 15 Hz in both experiments. Stimulation at these high rates has been related to relatively circumscribed activation of lower-tier visual cortex (Di Russo et al., 2005; Di Russo et al., 2007), which was desired in this study. In addition, the chromatic pattern reversal ssVEP showed strong oscillatory responses at the fundamental frequency of an entire reversal cycle (i.e. a full repetition of the red-green pair), which is half of the reversal frequency. This fundamental frequency response was absent in the ssVEP signal evoked by the luminance stimulus. The prominent peak at the fundamental frequency might reflect a luminance or edge artifact owing to one of the high-frequency chromatic gratings, despite our best efforts to produce isoluminance. It should be noted however that similar spectra were observed previously with high-spatial frequency and chromatic pattern reversal stimuli and may reflect superposition effects of slower processes (Kim et al., 2005). Importantly, paralleling the response at the reversal frequency, the chromatic ssVEP at the fundamental frequency did not show any sensitivity to classical conditioning, bolstering the inference that strong modulation of luminance-based input is necessary to mediate sustained threat-related changes in the visual cortical response. The ssVEP amplitudes in response to the luminance and chromatic stimuli did not differ during the initial habituation phase, where both stimuli showed comparable driving of population responses resulting in pronounced peaks. Taken together, this pattern of results strongly argues against the simple explanation that the lack of conditioning effects for the chromatic condition might be attributable to a lower signal-to-noise ratio in this condition.
The present findings add to a large body of studies that have attempted to isolate the contribution of specific visual nodes or channels to affective processing. In the present paper, we abstain from equating the chromatic stimulation with exclusive engagement of parvo-cellular neurons as well as equating the luminance condition with pure magnocellular engagement: The extent to which it is possible to neatly parse magnocellular versus parvocellular processes using experimental designs available in human psychophysics and electrophysiology has been intensely debated (Skottun, 2004; Skottun, 2011). Furthermore, the direct mapping of cortical luminance and chromatic processing to the magno- and parvocellular subcortical systems has been questioned (for a review, see Lee, 2011). It is also well known that parvocellular systems code certain luminance signals by virtue of their spatially opponent mode of function (Ingling & Martinez-Uriegas, 1983). Human EEG data show that above 8% contrast, it is not possible to discount the interplay of multiple channels in coding luminance while contrasts below 8% do indeed bias processing of low-frequency stimuli towards the magnocellular stream (Rudvin et al., 2000). Furthermore, chromatic differences between red and green should not be equated with L−M isolating, parvocellular-driven processing - in fact, colors typically considered as 'red' and 'green' actually contain a significant S−(L+M) decrement (Wuerger et al., 2005). Here we compared the luminance and chromatic-based visual pathways, which are more readily and unambiguously defined in terms of their preferred driving stimuli.
Although the nature of a specialized cortical pathway for color processing originating in V1 is still debated (Conway et al., 2010), there is abundant evidence that suggests a prominent involvement of ventral occipitotemporal cortices in color processing (Conway, 2009). Both these occipito-temporal cortices and more posterior peri-calcarine, areas possess bi-directional connections with the bilateral amygdaloid nuclei in the macaque monkey brain (Amaral et al., 1992). Imaging work using fluorescent tracers demonstrates however that the neuronal populations within the basal nucleus of the amygdala that are bi-directionally connected with low-level visual cortex (V1 and V2) do not greatly overlap with the populations connected with the more ventral visual areas. Re-entrant projections originating in basal nucleus layers with larger (magno-) neurons tend to have their targets in primary and secondary visual cortex, whereas higher-order occipito-temporal visual areas receive afferents from layers characterized by intermediate and small (parvo-) cell bodies (Amaral et al., 2003). Assuming a similar neuro-architecture in the human brain, this would imply that luminance-defined Gabor patches readily benefit from strong amygdalo-fugal re-entry into retinotopic visual areas when the CS+ becomes reliably paired with threat. The present data suggest that, when viewing chromatic stimuli, the visual cortex cannot establish such a flexible link with structures providing modulatory input into peri-calcarine regions, at least not in ways that would affect rapidly oscillating excitations of visual neuron populations (i.e. ssVEPs).
It is well established that the ssVEP is confined to lower-tier areas in the visual hierarchy, particularly with stimulation frequencies above 7 Hz (Müller et al., 2006; Wieser and Keil, 2011). Therefore, one possible explanation for the dissociation between chromatic and luminance processing is that luminance-defined CS+ patches more strongly engage those primary and secondary visual cortical neurons that take part in recurrent processing with additional brain structures that are sensitive to emotional value. Animal and human studies however have provided evidence of V1 neurons that are sensitive to both color and orientation (Johnson et al., 2004; Engel, 2005; Johnson et al., 2010). The extent to which these neurons are involved in conditioned sensory changes is an interesting question for future studies that may involve appropriate animal models of visual learning as well as paradigms suitable for hemodynamic imaging (Engel, 2005).
We replicated the null-findings with chromatic stimulation in an additional experiment where the same iso-luminant color gratings were alternated in anti-phase, paralleling the luminance stimulus condition. The fact that no conditioning effects were observed in the anti-phase condition supports the notion that it is not anti-phasic stimulation per se but luminance contrast that drives the development of response amplification of danger cues in human visual cortex.
In summary, stimulation of the luminance pathway led to measurable changes in the electrocortical response to the CS+, suggesting that luminance information is readily susceptible to response amplification within retinotopic visual cortex as a function of prior experience and motivational relevance. To the extent that no conditioning-dependent ssVEP amplitude modulation was observed with chromatic stimuli, one may conclude that luminance information is necessary and sufficient for acquiring a response bias towards a learned danger stimulus in the visual neuron populations that contribute to generating ssVEP responses. Taken together, the present results are an encouraging step towards using classical conditioning paradigms in combination with stimuli possessing known neurophysiological specificity. We demonstrate that, despite similar response amplitudes in response to luminance and chromatic-based driving, only the peri-calcarine response to low-spatial frequency luminance stimuli is modulated by associative fear learning.
Acknowledgments
This research was supported by Grants from the National Institute of Mental Health (R01MH097320; R01MH084392) and the US AMRAA (W81XWH-11-2-0008). The authors would like to thank members of the University of Florida Center for the Study of Emotion and Attention for their valuable comments on the experimental design. We are grateful for technical assistance given by Hailey Bulls.
Footnotes
The authors declare no competing financial interests.
References
- Amaral DG. The amygdala, social behavior, and danger detection. Ann N Y Acad Sci. 2003;1000:337–347. doi: 10.1196/annals.1280.015. [DOI] [PubMed] [Google Scholar]
- Amaral DG, Behniea H, Kelly JL. Topographic organization of projections from the amygdala to the visual cortex in the macaque monkey. Neuroscience. 2003;118:1099–1120. doi: 10.1016/s0306-4522(02)01001-1. [DOI] [PubMed] [Google Scholar]
- Amaral DG, Price JL, Pitkaenen A, Carmichael ST. Anatomical organization of the primate amygdaloid complex. In: Aggleton JP, editor. The amygdala: Neurobiological aspects of emotion, memory, and mental dysfunction. New York: Wiley-Liss; 1992. pp. 1–66. [Google Scholar]
- Baas JM, Kenemans JL, Bocker KB, Verbaten MN. Threat-induced cortical processing and startle potentiation. Neuroreport. 2002;13:133–137. doi: 10.1097/00001756-200201210-00031. [DOI] [PubMed] [Google Scholar]
- Bocanegra BR, Zeelenberg R. Emotion improves and impairs early vision. Psychol Sci. 2009;20:707–713. doi: 10.1111/j.1467-9280.2009.02354.x. [DOI] [PubMed] [Google Scholar]
- Brainard DH. The Psychophysics Toolbox. Spat Vis. 1997;10:433–436. [PubMed] [Google Scholar]
- Carretie L, Hinojosa JA, Lopez-Martin S, Tapia M. An electrophysiological study on the interaction between emotional content and spatial frequency of visual stimuli. Neuropsychologia. 2007;45:1187–1195. doi: 10.1016/j.neuropsychologia.2006.10.013. [DOI] [PubMed] [Google Scholar]
- Conway BR. Color vision, cones, and color-coding in the cortex. Neuroscientist. 2009;15:274–290. doi: 10.1177/1073858408331369. [DOI] [PubMed] [Google Scholar]
- Conway BR, Chatterjee S, Field GD, Horwitz GD, Johnson EN, Koida K, Mancuso K. Advances in color science: from retina to behavior. J Neurosci. 2010;30:14955–14963. doi: 10.1523/JNEUROSCI.4348-10.2010. [DOI] [PMC free article] [PubMed] [Google Scholar]
- De Cesarei A, Codispoti M. Scene identification and emotional response: which spatial frequencies are critical? J Neurosci. 2011;31:17052–17057. doi: 10.1523/JNEUROSCI.3745-11.2011. [DOI] [PMC free article] [PubMed] [Google Scholar]
- Di Russo F, Pitzalis S, Aprile T, Spitoni G, Patria F, Stella A, Spinelli D, Hillyard SA. Spatiotemporal analysis of the cortical sources of the steady-state visual evoked potential. Hum Brain Mapp. 2007;28:323–334. doi: 10.1002/hbm.20276. [DOI] [PMC free article] [PubMed] [Google Scholar]
- Di Russo F, Pitzalis S, Spitoni G, Aprile T, Patria F, Spinelli D, Hillyard SA. Identification of the neural sources of the pattern-reversal VEP. Neuroimage. 2005;24:874–886. doi: 10.1016/j.neuroimage.2004.09.029. [DOI] [PubMed] [Google Scholar]
- Engel SA. Adaptation of oriented and unoriented color-selective neurons in human visual areas. Neuron. 2005;45:613–623. doi: 10.1016/j.neuron.2005.01.014. [DOI] [PubMed] [Google Scholar]
- Foxe JJ, Simpson GV. Flow of activation from V1 to frontal cortex in humans: a framework for defining “early” visual processing. Experimental Brain Research. 2002;142:139–150. doi: 10.1007/s00221-001-0906-7. [DOI] [PubMed] [Google Scholar]
- Ingling CR, Jr, Martinez-Uriegas E. The relationship between spectral sensitivity and spatial sensitivity for the primate r-g X-channel. Vision Res. 1983;23:1495–1500. doi: 10.1016/0042-6989(83)90161-x. [DOI] [PubMed] [Google Scholar]
- Johnson EN, Hawken MJ, Shapley R. Cone inputs in macaque primary visual cortex. J Neurophysiol. 2004;91:2501–2514. doi: 10.1152/jn.01043.2003. [DOI] [PubMed] [Google Scholar]
- Johnson EN, Van Hooser SD, Fitzpatrick D. The representation of S-cone signals in primary visual cortex. J Neurosci. 2010;30:10337–10350. doi: 10.1523/JNEUROSCI.1428-10.2010. [DOI] [PMC free article] [PubMed] [Google Scholar]
- Junghöfer M, Elbert T, Leiderer P, Berg P, Rockstroh B. Mapping EEG-potentials on the surface of the brain: a strategy for uncovering cortical sources. Brain Topogr. 1997;9:203–217. doi: 10.1007/BF01190389. [DOI] [PubMed] [Google Scholar]
- Junghofer M, Elbert T, Tucker DM, Rockstroh B. Statistical control of artifacts in dense array EEG/MEG studies. Psychophysiology. 2000;37:523–532. [PubMed] [Google Scholar]
- Keil A, Stolarova M, Moratti S, Ray WJ. Adaptation in visual cortex as a mechanism for rapid discrimination of aversive stimuli. Neuroimage. 2007;36:472–479. doi: 10.1016/j.neuroimage.2007.02.048. [DOI] [PMC free article] [PubMed] [Google Scholar]
- Kim D, Zemon V, Saperstein A, Butler PD, Javitt DC. Dysfunction of early-stage visual processing in schizophrenia: harmonic analysis. Schizophr Res. 2005;76:55–65. doi: 10.1016/j.schres.2004.10.011. [DOI] [PubMed] [Google Scholar]
- Lang PJ. Behavioral treatment and bio-behavioral assessment: Computer applications. In: Sidowski JB, Johnson JH, William TA, editors. Technology in mental health care delivery systems. Norwood, NJ: Ablex; 1980. pp. 119–137. [Google Scholar]
- Lee BB. Visual pathways and psychophysical channels in the primate. J Physiol. 2011;589:41–47. doi: 10.1113/jphysiol.2010.192658. [DOI] [PMC free article] [PubMed] [Google Scholar]
- Moratti S, Keil A. Cortical activation during Pavlovian fear conditioning depends on heart rate response patterns: an MEG study. Brain Res Cogn Brain Res. 2005;25:459–471. doi: 10.1016/j.cogbrainres.2005.07.006. [DOI] [PubMed] [Google Scholar]
- Moratti S, Keil A, Miller GA. Fear but not awareness predicts enhanced sensory processing in fear conditioning. Psychophysiology. 2006;43:216–226. doi: 10.1111/j.1464-8986.2006.00386.x. [DOI] [PubMed] [Google Scholar]
- Müller MM, Andersen S, Trujillo NJ, Valdes-Sosa P, Malinowski P, Hillyard SA. Feature-selective attention enhances color signals in early visual areas of the human brain. Proc Natl Acad Sci U S A. 2006;103(38):14250–14254. doi: 10.1073/pnas.0606668103. [DOI] [PMC free article] [PubMed] [Google Scholar]
- Öhman A, Flykt A, Esteves F. Emotion drives attention: detecting the snake in the grass. J Exp Psychol Gen. 2001;130:466–478. doi: 10.1037/0096-3445.130.3.466. [DOI] [PubMed] [Google Scholar]
- Peyk P, DeCesarei A, Junghöfer M. Electro Magneto Encephalograhy Software: overview and integration with other EEG/MEG toolboxes. Computational Intelligence and Neuroscience. 2011;2011 doi: 10.1155/2011/861705. Article ID 861705. [DOI] [PMC free article] [PubMed] [Google Scholar]
- Pourtois G, Dan ES, Grandjean D, Sander D, Vuilleumier P. Enhanced extrastriate visual response to bandpass spatial frequency filtered fearful faces: time course and topographic evoked-potentials mapping. Hum Brain Mapp. 2005;26:65–79. doi: 10.1002/hbm.20130. [DOI] [PMC free article] [PubMed] [Google Scholar]
- Quirk GJ, Repa C, LeDoux JE. Fear conditioning enhances short-latency auditory responses of lateral amygdala neurons: parallel recordings in the freely behaving rat. Neuron. 1995;15:1029–1039. doi: 10.1016/0896-6273(95)90092-6. [DOI] [PubMed] [Google Scholar]
- Ripamonti C, Woo WL, Crowther E, Stockman A. The S-cone contribution to luminance depends on the M- and L-cone adaptation levels: silent surrounds? J Vis. 2009;9:10, 11–16. doi: 10.1167/9.3.10. [DOI] [PubMed] [Google Scholar]
- Rudvin I, Valberg A, Kilavik BE. Visual evoked potentials and magnocellular and parvocellular segregation. Vis Neurosci. 2000;17:579–590. doi: 10.1017/s0952523800174085. [DOI] [PubMed] [Google Scholar]
- Shuler MG, Bear MF. Reward timing in the primary visual cortex. Science. 2006;311:1606–1609. doi: 10.1126/science.1123513. [DOI] [PubMed] [Google Scholar]
- Skottun BC. On the use of red stimuli to isolate magnocellular responses in psychophysical experiments: A perspective. Visual Neuroscience. 2004;21:63–68. doi: 10.1017/s0952523804041069. [DOI] [PubMed] [Google Scholar]
- Skottun BC. On the Use of Visual Motion Perception to Assess Magnocellular Integrity. Journal of Integrative Neuroscience. 2011;10:15–32. doi: 10.1142/S0219635211002592. [DOI] [PubMed] [Google Scholar]
- Sokolov EN. Perception and the conditioned reflex. New York: Macmillan; 1963. [Google Scholar]
- Stockman A, Brainard DH. Color Vision Mechanisms. In: Bass M, editor. Optical Society of America Handbook of Optics. New York: McGraw-Hill; 2010. pp. 11.11–11.104. [Google Scholar]
- Weinberger NM. Specific long-term memory traces in primary auditory cortex. Nat Rev Neurosci. 2004;5:279–290. doi: 10.1038/nrn1366. [DOI] [PMC free article] [PubMed] [Google Scholar]
- Wieser MJ, Keil A. Temporal Trade-Off Effects in Sustained Attention: Dynamics in Visual Cortex Predict the Target Detection Performance during Distraction. J Neurosci. 2011;31:7784–7790. doi: 10.1523/JNEUROSCI.5632-10.2011. [DOI] [PMC free article] [PubMed] [Google Scholar]
- Wuerger SM, Atkinson P, Cropper S. The cone inputs to the unique-hue mechanisms. Vision Res. 2005;45:3210–3223. doi: 10.1016/j.visres.2005.06.016. [DOI] [PubMed] [Google Scholar]


