

Abstract
When the head rotates, the image of the visual world slips across the retina. A dedicated set of retinal ganglion cells (RGCs) and brainstem visual nuclei termed the “accessory optic system” (AOS) generate slip-compensating eye movements that stabilize visual images on the retina and improve visual performance. Which types of RGCs project to each of the various AOS nuclei remain unresolved. Here we report a new transgenic mouse line, Hoxd10–GFP, in which the RGCs projecting to all the AOS nuclei are fluorescently labeled. Electrophysiological recordings of Hoxd10–GFP RGCs revealed that they include all three subtypes of On direction-selective RGCs (On–DSGCs), responding to upward, downward, or forward motion. Hoxd10–GFP RGCs also include one subtype of On–Off DSGCs tuned for forward motion. Retrograde circuit mapping with modified rabies viruses revealed that the On–DSGCs project to the brainstem centers involved in both horizontal and vertical retinal slip compensation. In contrast, the On–Off DSGCs labeled in Hoxd10–GFP mice projected to AOS nuclei controlling horizontal but not vertical image stabilization. Moreover, the forward tuned On–Off DSGCs appear physiologically and molecularly distinct from all previously genetically identified On–Off DSGCs. These data begin to clarify the cell types and circuits underlying image stabilization during self-motion, and they support an unexpected diversity of DSGC subtypes.
Introduction
The cell types and neural computations that give rise to distinct aspects of motion detection remain incompletely understood. Global visual motion occurs whenever the head or eyes move. To prevent blurring of the visual scene, the brain executes compensatory image-stabilizing eye movements that are driven by the cooperative activity of the vestibular and visual systems. Although both of these sensory systems detect self-motion, they cover complementary ranges of head velocity. The vestibular semicircular canals respond well to rapid head rotation and drive counter-rotation of the eyes, closely matching the head rotation. However, at slower rotational velocities, vestibular compensation is imperfect, causing the image of the visual world to drift across the retina (“retinal slip”). The task of the visual component of the image-stabilization network is to accurately encode the direction and speed of this slow, full-field retinal slip. Visual and vestibular signals eventually converge and access a common oculomotor output network to drive almost perfect image-stabilizing eye movements (Simpson, 1984).
Where in the visual system is slow-velocity retinal slip encoded and how are the necessary compensations generated? Previous studies in rabbits and monkeys showed that a dedicated set of brainstem visual nuclei, termed the “accessory optic system” (AOS) and the retinal ganglion cells (RGCs) that innervate them, are ideally configured to meet these requirements (Oyster et al., 1980; Simpson, 1984; Soodak and Simpson, 1988; Distler and Hoffmann, 2011). A major conclusion of that work and thus the prevailing view for more than three decades was that the primary source of drive to the AOS comes from a subset of direction-selective RGCs that respond to increments in light (On–DSGCs) (Yonehara et al., 2009; for review, see Simpson, 1984; Schiller, 2010; Borst and Euler, 2011). Indeed, On–DSGCs respond to slow velocities and have large receptive fields, properties well suited for detecting retinal slip during slow head rotations.
Previous work described three major subtypes of On–DSGCs, each differing in directional preference: (1) one subtype prefers upward motion in the visual world; (2) another prefers downward motion; (3) and the third prefers forward motion (Oyster and Barlow, 1967). Intriguingly, each of these directions matches the slip seen by the retina when the head rotates about the best axis of one of the three vestibular semicircular canals (Fig. 1). These directional channels have been argued to remain primarily segregated in the nuclei of the AOS because postsynaptic neurons in AOS targets prefer the same three directions of retinal slip: upward, downward, or forward (Simpson, 1984).
Figure 1.

Vestibular and visual components of the AOS. A, The three major axes of visual slip (upward, blue; forward, red; and downward, green) experienced by cells in the retina when the head moves. B, The three major axes of visual slip. The arrows represent the direction of slip along each of the three major axes. C, Semicircular canals of the inner ear that respond to the three major axes of head movements: horizontal (red), anterior (blue), and posterior (green).
The other major category of DSGCs are the On–Off DSGCs. These are distinguishable from On–DSGCs in several ways: (1) their dendrites are bistratified rather than monostratified; (2) they respond to both light increments and decrements; (3) they prefer higher velocity visual stimuli; and (4) on average they have smaller dendritic and receptive fields than On–DSGCs (Barlow and Hill, 1963; Barlow and Hill, 1964; Weng et al., 2005; Rivlin-Etzion et al., 2011). On–Off DSGCs encode direction along one of the four cardinal axes: (1) upward; (2) downward; (3) forward; or (4) backward (Borst and Euler, 2011; Vaney et al., 2012). In both rabbits and mice, On–Off DSGCs project to the dorsal lateral geniculate nucleus (dLGN) and superior colliculus (SC), visual targets associated with spatial vision and reorientation of gaze, respectively (Pu and Amthor, 1990; Huberman et al., 2009; Kay et al., 2011; Rivlin-Etzion et al., 2011). Based on these characteristics, On–Off DSGCs have been proposed to contribute to pattern vision and/or fine-scale eye movements (Vaney et al., 2001), placing them in a distinct parallel pathway from On–DSGCs and AOS targets. However, a recent study showed that a subtype of upward tuned On–Off DSGCs also project to AOS targets in the mouse (Kay et al., 2011), suggesting that, On–DSGCs and On–Off DSGCs may comprise overlapping rather than purely parallel visual circuits. A thorough analysis of this issue requires testing whether On–Off DSGCs encoding other axes of motion also feed the AOS.
Materials and Methods
Animals.
All experimental procedures were conducted in accordance with National Institutes of Health guidelines and approved by Institutional Animal Care and Use Committees at University of California, San Diego and Brown University. Homeobox d10 BAC–EGFP (Hoxd10–GFP) mice were obtained from Mutant Mouse Regional Resource Centers (http://www.mmrrc.org/catalog/sds.php? mmrrc_id=32065). Trhr–GFP, Drd4–GFP, and CB2–GFP were described previously (Huberman et al., 2008, 2009; Rivlin-Etzion et al., 2011). All analyses were restricted to male and female mice that were 1–3 months of age.
Histology and immunohistochemistry.
The brains and retinas of Hoxd10–GFP mice were perfusion fixed, harvested, and processed for immunohistochemistry as described previously (Huberman et al., 2008; Estevez et al., 2012). RGC axons were labeled by intraocular injections of cholera toxin β conjugated to Alexa Fluor 594 (CTb–594; Invitrogen) as described previously (Huberman et al., 2008).
Primary antibodies used included the following: rabbit anti-GFP (1:1000; A6455; Invitrogen), guinea pig anti-GFP (1:1000; 132005; Synaptic Systems), chicken anti-GFP (1:1000; GFP-1020; Aves Labs), rabbit anti-dsRed (1:1000; 632292; Clontech), rabbit anti-Cart (1:1000; H00362; Phoenix Pharmaceutical), guinea pig anti-VAChT (1:1000; AB1588; Millipore), and goat polyclonal anti-ChAT (1:200; AB144B; Millipore). Secondary antibodies (Alexa Fluor 488, 594, or 647) were from Invitrogen.
RGC quantification.
Hoxd10–GFP mouse retinas were stained for GFP. Photomicrographs of the entire retina taken at 5× were montaged. A marker was placed over each GFP-expressing (GFP+) RGC in the montaged image, and the total number of RGCs were counted for each retina. For density analysis, two (opposite) retina leaflets were selected, and GFP+ RGCs in a 0.25 mm2 area in the central and peripheral retina were counted. Student's t test was used for statistical comparison of RGC numbers between central and peripheral retina.
Intracellular dye filling.
Hoxd10–RGCs were filled by intracellular iontophoretic dye injection with Lucifer yellow or Alexa Fluor 488 or 555 hydrizide (Invitrogen) using sharp micropipettes, as described previously (Pu et al., 1994; Estevez et al., 2012; Beier et al., 2013). For whole-cell recordings, Lucifer yellow or Alexa Fluor 488 was added to the recording pipette solution and passively diffused into the cell during the recording.
Imaging and reconstructions.
Fixed retinas containing intracellularly filled GFP+ cells were flat mounted on a glass slide and imaged sequentially along the z-axis (perpendicular to the ganglion cell layer) with a SPOT RT Slider digital microscope camera mounted to a Nikon (Diagnostic Instruments) as described previously (Berson et al., 2010; Estevez et al., 2012). The images were compiled in Adobe Photoshop CS3, and cell profiles were manually traced in Adobe Photoshop CS3 to create two-dimensional reconstructed drawings. Soma diameter, dendritic field diameter, dendritic length in the On inner plexiform layer (IPL), dendritic length in the Off IPL, branch points, and number of primary dendrites were determined using NIH ImageJ software (http://imagej.nih.gov) as reported previously (Berson et al., 2010; Estevez et al., 2012). Percentage of total dendritic arbor in the On IPL was calculated by dividing the dendritic length in On IPL by the total dendritic length. Sholl analysis was performed using the Sholl Analysis Plugin 1.0 for NIH ImageJ (freely available online at http://biology.ucsd.edu/labs/ghosh/software/) using 10 μm steps from a starting radius of 10 μm as described previously (Estevez et al., 2012). Confocal images of dendritic stratification were acquired with a Zeiss LSM 510 Meta laser scanning confocal microscope and analyzed using Zeiss LSM Image Browser software. For figure preparation, adjustments were made to brightness and contrast using Photoshop software (Adobe Systems). For one photomicrograph panel (see Fig. 7A), fluorescence from sources other than the filled cell (e.g., vasculature) were digitally masked for clarity before psuedocoloring the dendritic processes. For Figures 5E and 7A, the dendritic processes were pseudocolored so the dendrites in the proximal (On) sublayer of the IPL appear green and those in the distal (Off) sublayer appear white. This is also noted in the legend for these figures.
Figure 7.
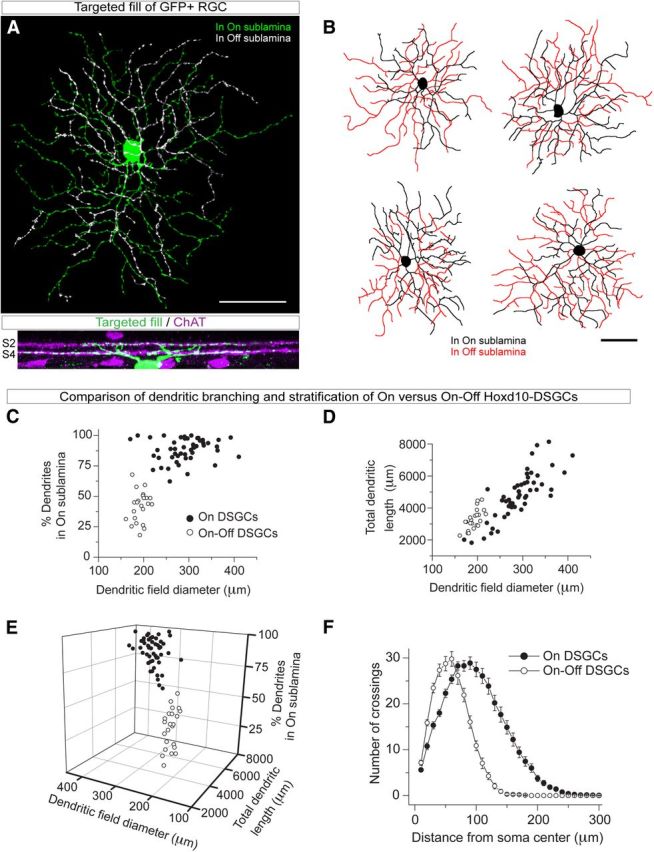
Hoxd10–RGC include cells that morphologically resemble On–Off DSGCs. Targeted fill (A) and reconstructions (B) reveals a second RGC subtype marked in Hoxd10–GFP mice that costratifies with both the On–ChAT and Off–ChAT bands (magenta) in the IPL of the retina. C–F, Morphological comparison of On–DSGCs (filled circles, n = 50) and On–Off RGCs (open circles, n = 23) filled by sharp electrode intracellular dye injection or diffusion of dye during whole-cell patch-clamp recording. 3D scatter plot (E) of percentage dendritic arbor in the On sublamina of the IPL, dendritic field diameter, and total dendritic field length was constructed by combining the 2D scatter plots in C and D. The 3D plot in E is shown at a 13% perspective angle to illustrate clustering of data into two distinct populations based on these morphological parameters. In addition, On–Off RGC dendritic arbors differ from those of On–DSGCs when analyzed by Sholl analysis (F). Scale bar, 50 μm. Error bars indicate SEM.
Figure 5.

Dye-filled Hoxd10–RGCs display On–DSGC-like morphology. A, B, High magnification of a leaflet of Hoxd10–GFP retina (B corresponds to boxed region in A). The presence of GFP+ RGC doublets (B, red arrows), a violation of mosaic organization, suggests the presence of multiple RGC subtypes. There was no tendency for brighter or dimmer GFP+ RGCs to reside close to one another (data not shown). Note that partial dendrites (white arrowhead) are visible without immunostaining in adult Hoxd10–GFP mice. C, Example flat-mount Hoxd10–GFP mouse retina (black outline) showing distribution of GFP+ RGCs (black dots). GFP+ RGCs are observed throughout the entire retina. D, Quantification of density of GFP+ RGCs in adult Hoxd10–GFP mice. The relatively small number of GFP+ RGCs (∼2000; Results) and uniform density suggests that only a few subtypes of RGCs are present in the Hoxd10–GFP mouse line. E, Example Hoxd10–RGC filled with Alexa Fluor 488 hydrazide (green) reveals On–DSGC-like dendritic morphology. Hoxd10–RGC dendrites in green represent dendritic branches in the On sublamina in the IPL of the retina, and pseudocolored white represent branches in the Off sublamina of the IPL. Reconstructed trace of this cell is shown in I. F, Dendrites of a filled GFP+ Hoxd10–RGC costratify and cofasciculate (white arrows) with the On starburst amacrine dendrites (magenta, ChAT) in the IPL. Confocal z-stack shows dendrites in the On sublamina (S4), with a small dendritic branch in the Off sublamina (S2). G–J, Example en face view of reconstructions of targeted Hoxd10–RGC fills with On–DSGC-like dendritic morphologies. Dendrites stratifying in the On or Off sublamina of the IPL are drawn in black and red, respectively. Scale bars: A, 500 μm; B, 100 μm; E, G–J, 50 μm; F, 10 μm. S, Superior; T, temporal; I, inferior; N, nasal.
Retinal electrophysiology.
Whole-cell current-clamp recordings from GFP+ RGCs were performed as described previously (Estevez et al., 2012). Retinas were dissected under dim red light, after making a small cautery mark on the far dorsal cornea, approximately equidistant from the nasal and temporal angles of the eye. Then, a large relieving cut was made in the dorsal eyecup, and this cut was used to orient the retina in the recording chamber. The retina was superfused at 3–4 ml/min with oxygenated Ames' medium (95% O2/5% CO2; Sigma-Aldrich) supplemented with 23 mm NaHCO3 and 10 mm d-glucose and maintained at 32–34°C. Cells were recorded with glass pipettes (3–8 MΩ) containing the following (in mm): 120 K-gluconate, 5 NaCl, 4 KCl, 2 EGTA, 10 HEPES, 4 ATP-Mg, 7 phosphocreatine-Tris, and 0.3 GTP-Tris, pH 7.3 (270–280 mOsm). GFP+ RGCs were targeted using mercury epifluorescence excitation and then maintained in darkness for 20–30 min before patching using infrared visual guidance. This resulted in an approximate 2 log unit reduction in outer retina sensitivity based on our previous work (Estevez et al., 2012); thus, our physiological experiments were performed at a steady-state bleach-adapted state of the retina and likely represent cone-dominated input to RGCs.
Patterned light stimuli were generated by custom software developed in Psychophysics Toolbox and MATLAB, projected onto the retina using a Dell video projector (M109s DLP) custom fitted with a UV LED (NC4U134A; final emission, 398nm; Nichia), attenuated by a neutral density 2.0 filter, and focused using a 20× objective to the level of rod and cone outer segments, as described previously (Estevez et al., 2012; Marvin et al., 2013). The maximum contrast emitted by the projector (98% Michelson contrast) was attenuated according to the sensitivity of the cell by adjusting the projector pixel intensity in MATLAB. At the beginning of each experiment, 100 μm spots of light were generated on the projector and moved to different locations on the retina using a computer mouse. The center of the receptive field of the cell on the projector was then saved for all future recordings of that cell. The receptive field diameter of the cell and its extent of surround antagonism was determined by flashing spots of light of diameters of 50–1300 μm, aligned to the center of the cell. Drifting sinusoidal contrast gratings were used to test preferences for direction, spatial frequency, and drift speed. Spatial frequencies used ranged from 26 to 1180 μm/cycle, and speeds ranged from 0.2 to 20°/s on the retina, calculated using a conversion factor of 31 μm/° (Remtulla and Hallett, 1985). The gratings filled the entire projector screen and extended well beyond the receptive field center of the recorded cell. Directional preference was determined by drifting the gratings across the receptive field of the cell in eight directions at the preferred speed and spatial frequency for that cell, which was determined at the beginning of the experiment. The number of spikes obtained over a sweep of the gratings in one direction was taken as the response amplitude for the given direction. The preferred direction and direction selectivity index (DSI) were calculated as described previously (Kim et al., 2008; Yonehara et al., 2009). Briefly, the preferred direction is the angle of the vector sum of the response amplitudes from eight different directions. The DSI corresponds to the length of the vector sum, divided by the sum of all responses, and ranges from 0 for a cell with equal responses in all directions to 1 for a cell that responds to only one direction. Cells with DSI ≥0.3 were considered direction selective in accordance with previous reports on mouse and rat DSGCs (Sun et al., 2011; Xu et al., 2013).
DSIs were plotted on a polar plot (see Fig. 6E) using the coloring scheme (shown in Fig. 1) that divides polar plots of preferred directions into three 90° segments. On Hoxd10–DSGCs with peak direction tuning between 315 and 45° (forward) were labeled red. Those with peak direction tuning between 90 and 180° (upward) were labeled blue, and those with peak tuning between 180 and 270° (downward) were labeled green. Any On–DSGCs that did not fall within these three bins were labeled gray. Analysis of DSI population data for On–DSGCs was performed using the following cluster model. First, cells were binned every 30° starting at 0°. Then DSI magnitudes of cells in each bin were summed, and summed DSIs were plotted with a polar plot as a function of the median of the bin group angle.
Figure 6.
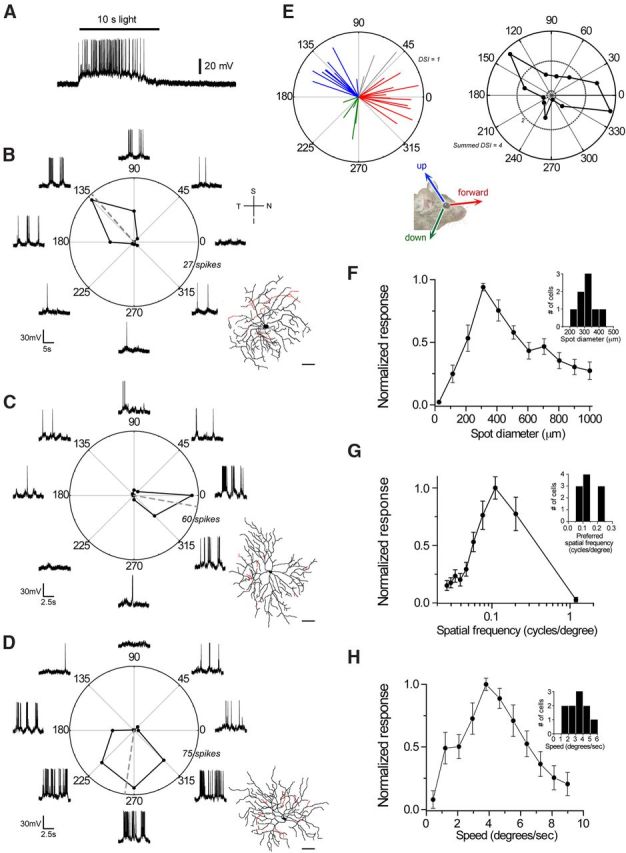
Hoxd10–RGCs include On–DSGCs encoding three different directions of motion. A, Example whole-cell current-clamp recording from a GFP+ Hoxd10 On–DSGC (same as cell shown in B) shows sustained firing in response to a 10 s step of light (362-μm-diameter spot aligned to the receptive field center of the cell). B–D, Example polar plot of evoked firing rate as a function of grating drift direction. All three canonical On directions in visual space: upward (B), forward (C), and downward (D) are represented in the Hoxd10–GFP mouse line. Dashed gray line indicates the vector sum of responses. Morphology of the recorded cell is shown to the right of each polar plot (black, On sublamina; red, Off sublamina of IPL). Grating dimensions were custom constructed for each cell according to the preferred spatial frequency and speed tuning of each cell and were 0.06, 0.08, and 0.13 cycles/° and speed of 3.2, 6.3, and 3.8°/s for cell in B–D, respectively. E, Summary of directional preference of all recorded On–DSGCs (n = 30 cells). Plot on the left shows the preferred direction in space, and DSIs are represented by the angle and length of the line, with coloring scheme to divide the polar plot into three 90° segments (see Materials and Methods). Twenty-seven of 30 On–DSGCs fell in these three ranges. Three of 30 Hoxd10 On–DSGCs exhibited tuning in the 45–90° range (gray). Plot on the right (black) shows summed DSI magnitudes of all 30 recorded cells plotted as a function of bin group angle (binned every 30°; see Materials and Methods), demonstrating that the maximum summed DSIs cluster into bins for angles closely matching forward and upward directions, with a small contribution of summed DSIs from the downward population. F–H, On–DSGCs prefer slow moving contrast gratings and large-diameter spots of light. Normalized maximum firing rate plotted as a function of spot size (F), spatial frequency (G), and drift speed (H) of grating drifted at the predetermined preferred direction of each cell. Mean ± SEM peak spot diameter, spatial frequency, and speed values were 319.6 ± 23.0 μm (n = 8), 0.13 ± 0.05 cycles/° (n = 10), and 3.20 ± 0.40°/s (n = 10). Histograms demonstrating the range of values observed are shown as insets plots in F and G. Scale bar, 50 μm. Error bars indicate SEM. S, Superior; T, temporal; I, inferior; N, nasal.
Analyses.
Data analysis and statistics were performed using Clampfit 9.2 (Molecular Devices), Origin 6.0 (Microcal Software), and MATLAB (MathWorks). Unless noted otherwise, data are expressed as mean ± SEM, and differences between the data were considered statistically significant when p < 0.01, as determined using an independent two-tailed Student's t test.
Retrograde labeling of Hoxd10–RGCs from central targets.
Stereotaxic injections (∼50–100 nl) of glycoprotein-deleted modified rabies virus encoding mCherry (ΔG–RABV–mCherry; titer, 8.0 × 10⁸ to 2.0 × 10⁹ infectious units/ml; Osakada et al., 2011) or CTb–555 (Invitrogen) were made in the medial terminal nucleus (MTN), nucleus of the optic tract (NOT), or SC of Hoxd10–GFP mice using a pulled glass pipette attached to a nanoinjector (Nanoject II; Drummond Scientific). Six days (for viral injections) or 2 d (for CTb–555 injections) later, animals were killed, and retina and brain tissue were harvested as described above. GFP and mCherry signals were enhanced using the antibodies described above. Injection location was confirmed in target structures in coronal brain sections post hoc. RGCs expressing both GFP and mCherry (or CTb–555) were imaged as described previously (Beier et al., 2013) and 3D reconstructions were generated using Neurolucida (MicroBrightField) to analyze their morphology and dendritic stratification.
Behavioral analyses of eye movements in awake mice.
The behavioral setup for monitoring and quantification of eye movements in head-fixed awake mice was adapted from Faulstich et al. (2004). Briefly, mice were anesthetized and placed in a stereotaxic holder (David Kopf Instruments), and a head post was fixed on the skull with dental cement. Animals were allowed to recover for at least 2 d before behavioral testing. Animals were head fixed in the behavioral setup, and eye movements were recorded (one session per day and three to four sessions per animal) in response to moving sinusoidal gratings (alternating black and white stripes, 100% contrast) displayed using three computer monitors placed surrounding the animal to obtain a 270° view. The movement of the right eye in response to the stimulus, moving from the temporal-to-nasal (forward) direction across the right eye, was recorded using a CCD camera (IPX-VGA210; Imprex). The displacement of the pupil was computed with respect to the reflection of the reference LED (placed on top of the camera) on the eye.
To convert pupil position into rotational angle of the eye, we followed the protocol described by Faulstich et al. (2004) in which, first, the camera and reference LED were rotated around the mouse over a ±10° range from center. Then, to generate a conversion factor (Rp), we calculated the difference between the reflection of the reference LED on the eye relative to pupil location, when the camera was rotated to each of the two extreme positions. This enabled the rotational angle of the eye to be measured using the following equation:
 |
where E is the rotational angle, and X is the horizontal distance between the reflection of the reference LED and the pupil (Stahl et al., 2000; Stahl, 2002). Custom MATLAB software code was used to calculate the eye velocity and gain of eye movements. Two spatial frequencies, 0.06 and 0.16 cycles/°, were presented at varying temporal frequencies in the range of 0.01–6 Hz. The gain of the eye movement, defined as the eye velocity divided by stimulus velocity, was obtained from the responses to presentations of visual stimuli of varying spatial and temporal frequencies (see Fig. 12D and Notes).
Figure 12.
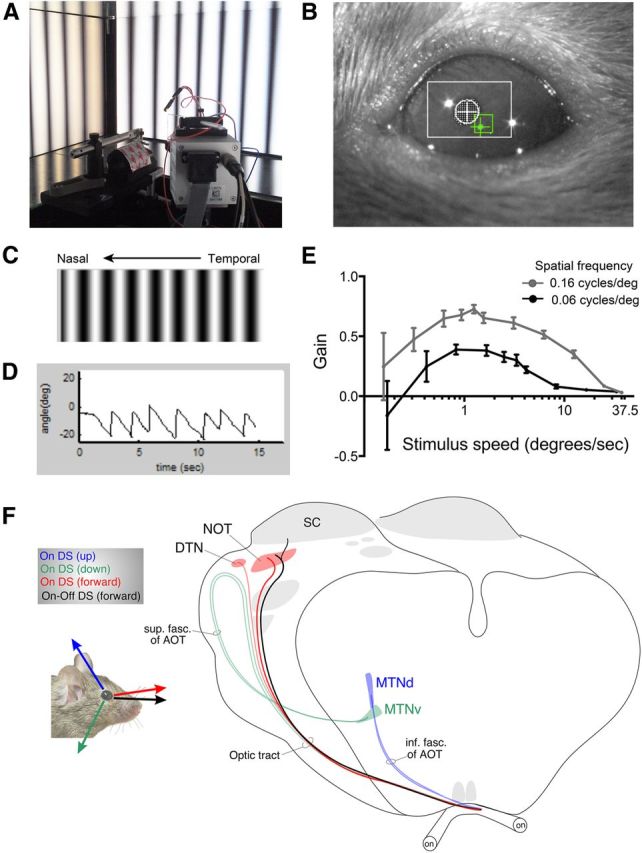
Quantitative paradigm for measuring reflexive eye movements in head-fixed, awake mice. A, Behavioral setup for measuring optokinetic nystagmus in mice. The mouse is head fixed to a post, surrounded by three screens presenting drifting gratings of defined spatial and temporal frequencies. The position of the eye is automatically tracked by a CCD camera and reference electrode. B, Sample image captured by a CCD camera used to record eye movements. The relative position of the pupil (white crosshatch) to a fixed reference point (green crosshatch) is measured. C, Example of grating stimulus presented in the temporal-to-nasal (forward) direction with respect to the recorded eye (right eye) of the mouse. D, Example trace of pupil displacement relative to the reference point during presentation of drifting gratings. E, Tuning curves of the gain (eye velocity/stimulus velocity) in response to two different spatial frequencies (gray, 0.16 cycles/°; black, 0.06 cycles/°). See Notes. F, Summary of the various DSGC subtypes described in this study and their central projections to the AOS. The view of the subcortical visual pathway (cortex removed) with the two optic nerves, the optic chiasm, and several of the non-AOS retinorecipient targets, including the SC shown in gray. The black arrow overlying the mouse represents the signals from the slow-velocity, forward-preferring On–Off DSCGs identified in this study. The projections of these DSGCs to the NOT and SC are shown on the brain schematic in black. Whether those cells also target the DTN is unknown; the DTN is too small to inject without encroaching on the SC. The On–DSGC inputs to other AOS targets are color coded as well. The tuning of the three types of On–DSGCs and their central projections are shown in red, green, and blue. The tuning preferences of target cells are derived from Yonehara et al. (2009) and from studies in rabbits (Simpson, 1984). Schematic design adapted from Pak et al. (1987).
Results
A mouse with selective fluorescent labeling of RGCs innervating the AOS
Mice provide a genetically tractable model for mapping specific components of the subcortical visual system. In an ongoing screen for transgenic mice suitable for this purpose, we identified a mouse line with selective labeling of retinal projections to brainstem nuclei of the image stabilization network. In this mouse line (Hoxd10–GFP), GFP is expressed under the control of the Homeobox d10 promoter. Initial examination revealed strong and selective labeling of several components of the AOS. To confirm this, we labeled retinal axons in these mice with binocular injections of a red fluorescent tracer (CTb–594) and then surveyed labeled retinorecipient target nuclei for the presence or absence of GFP+ axons.
The labeled RGCs (hereafter termed Hoxd10–RGCs) innervated a remarkably limited subset of retinorecipient nuclei, all of which belong to the AOS. First, they heavily innervated the NOT (Fig. 2A–C,H,I), a pretectal nucleus residing just rostral to the SC. The NOT is a major component of the AOS (Pak et al., 1987; Telkes et al., 2000; Giolli et al., 2006). Hoxd10–RGC axons also densely innervated the two other AOS nuclei in mice: MTN and dorsal terminal nucleus (DTN). The MTN sits at the base of the midbrain between the cerebral peduncles (Fig. 2A–C,J,K), whereas the DTN sits just lateral to the SC (Fig. 2D–G). Previous work suggested that the dorsal and ventral subdivisions of the MTN receive input from different subtypes of On–DSGCs. The dorsal division is targeted by On–DSGCs preferring upward motion, whereas the ventral division gets input from downward-preferring On–DSGCs (Yonehara et al., 2009). We found that Hoxd10–RGCs innervated both the ventral and dorsal subdivisions of the MTN (Fig. 2J,K).
Figure 2.

Genetic labeling of RGC axons that densely innervate all subcortical nuclei controlling image stabilization. A, Coronal view of midbrain. RGCs labeled with CTb–594 (magenta). B, Hoxd10–GFP+ RGC axons (black) terminate in the NOT and MTN. C, Merged image of RGCs labeled with CTb–594 (magenta) and Hoxd10–GFP RGC axons (green; hereafter Hoxd10–RGCs). D, E, Hoxd10–RGC axons innervate the DTN but provide only sparse input to the largest and most commonly innervated subcortical visual target, the SC. Labeling (color) conventions as in A–C. F, G, High-magnification view of Hoxd10–GFP terminations in the DTN (corresponds to boxed region in D, E). H, Within the pretectum, Hoxd10–RGC axons are restricted to the NOT (black). I, Merged signals from Hoxd10–RGC axons (green) and RGC axons collectively (magenta) reveals the specificity of Hoxd10–RGC axon targeting to the NOT (white outline); two pretectal nuclei neighboring the NOT (asterisks) do not receive axons from Hoxd10–RGCs. J, K, Both the dorsal and ventral MTN (MTNd and MTNv) receive dense axonal input from Hoxd10–RGCs. Comparison of the spatial extent of GFP (J, black) and labeling of RGC axons (K, magenta) reveals that Hoxd10–RGC axons occupy the entire MTN structure. D, Dorsal; L, lateral. Scale bars: C, E, 500 μm; G, 50 μm; I, K, 100 μm.
Labeled retinofugal axons in Hoxd10–GFP mice avoided almost all other retinorecipient targets. They avoided entirely the suprachiasmatic nucleus of the hypothalamus, which is the master circadian pacemaker (Fig. 3C,D), and they provided only very sparse input the dLGN and SC (Figs. 2D, 3A,B). Removal of one eye led to a disappearance of virtually all GFP+ axons in the contralateral retinofugal pathway, indicating that the GFP+ axons were of retinal origin (Fig. 4). A small minority of GFP+ axons from the intact eye were observed in the ipsilateral MTN (Fig. 4P,Q), but we could not discern Hoxd10–RGCs projecting to the ipsilateral NOT (Fig. 4D,E). Therefore, the vast majority of Hoxd10–RGC axons project contralaterally.
Figure 3.
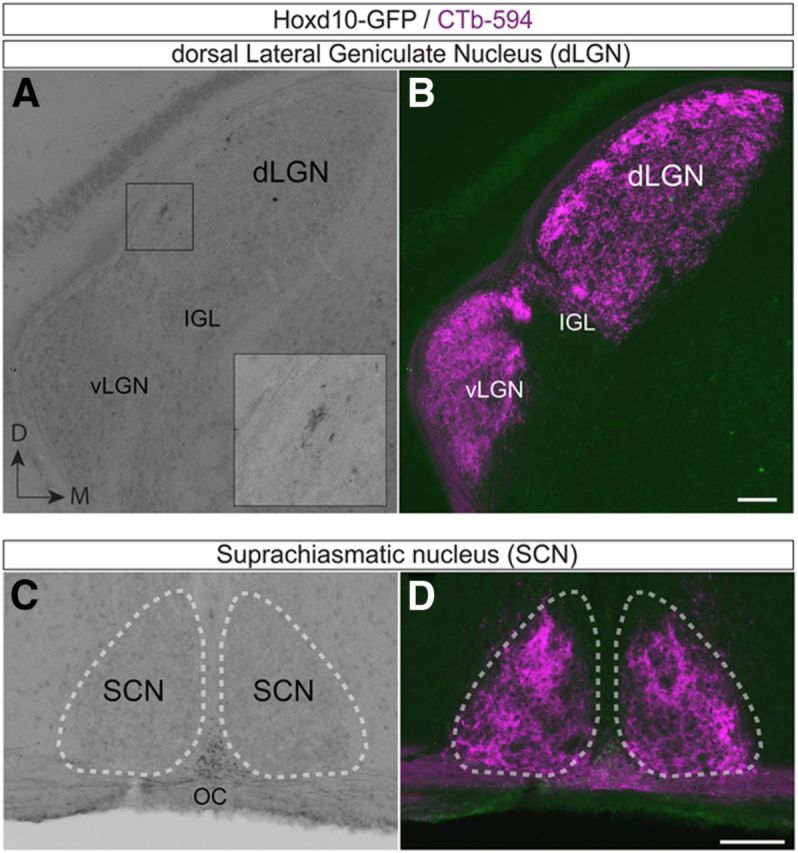
Minimal input from Hoxd10–RGCs to subcortical retinorecipient targets involved in circadian rhythms, directed gaze, or image formation. A, Sparse input to the subcortical target involved in image formation, the dLGN from Hoxd10–RGCs. Inset, A small patch of GFP+ axon terminals near the optic tract. The majority of the dLGN is primarily devoid of Hoxd10–RGC inputs. B, CTb–594 labeling of RGCs (magenta) in the same plane as A. RGC axons terminate throughout this target. C, D, Hoxd10–RGCs do not innervate the suprachiasmatic nucleus (SCN, white outline), a structure involved in circadian entrainment. IGL, Inner granule layer; vLGN, ventral LGN; D, dorsal; M, medial; OC, Optic chiasm. Scale bars: B, D, 100 μm.
Figure 4.
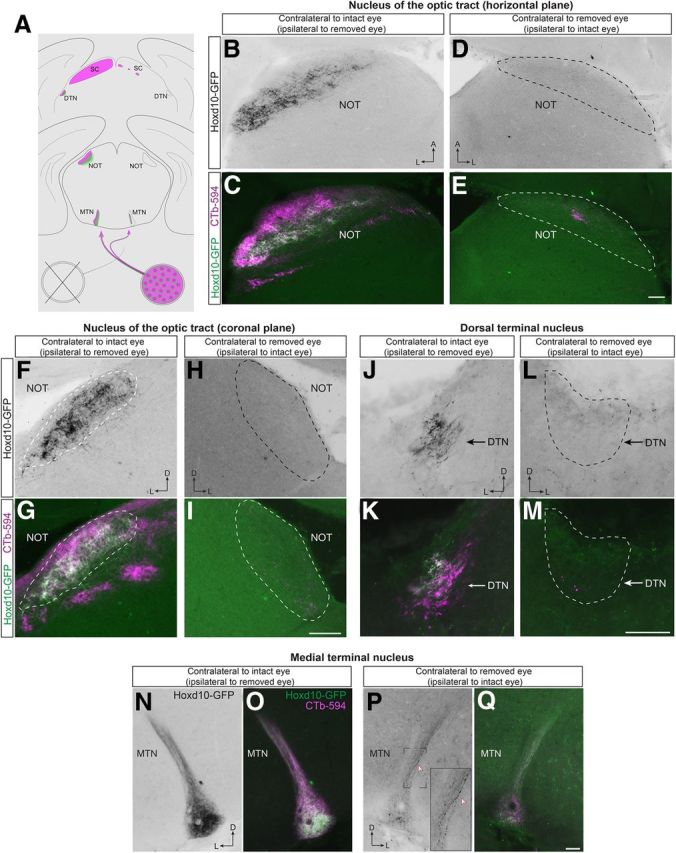
Hoxd10–RGCs are the source of GFP+ axons in AOS targets, and they project almost entirely to the contralateral brain hemisphere. A, Experimental paradigm for determining the origin of GFP+ axons in the AOS target structures in the Hoxd10–GFP mouse line. The right eye of adult Hoxd10–GFP mice were surgically removed. Approximately 3 weeks later, tracer CTb–594 was injected in the spared eye (left eye). Visual target structures in both hemispheres were analyzed for the presence or absence of GFP+ and CTb–594+ axons fibers. B–I, GFP+ and CTb–594+ axons were observed in the contralateral side of the intact eye (B, C, F, G). The NOT contralateral to the removed eye was completely devoid of GFP+ fibers, and almost complete lack of CTb signal confirmed that eye removal resulted in degeneration of RGC inputs to the NOT (D, E, H, I). J–M, Removal of the right eye results in complete loss of GFP signal in the contralateral hemisphere in the DTN (while outline). N, Hoxd10–RGC axons (black) from the intact eye in the contralateral MTN. O, RGC axons of the intact eye are bulk labeled with CTb–594 (magenta). P, Q, Only a few GFP+ retinal fibers are present in the MTN contralateral to the removed eye, demonstrating that the Hoxd10–RGCs are predominately contralateral projecting. D, Dorsal; L, lateral; A, anterior. Scale bars: E, I, 100 μm; M, G, 50 μm.
Hoxd10–GFP mice thus join a collection of transgenic mice discovered in the past few years in which a limited subset of RGCs express fluorescent reporters and restrict their labeled axonal projections to specific subsets of retinorecipient nuclei (Huberman et al., 2008, 2009; Kim et al., 2008, 2010; Yonehara et al., 2008, 2009; Ecker et al., 2010; Kay et al., 2011; Osterhout et al., 2011; Rivlin-Etzion et al., 2011). However, the Hoxd10–GFP line is unique among these mouse lines in that it densely and selectively labels a common functional network responsible for visually driven image stabilization (Simpson et al., 1988a,b). As far as we are able to discern, all AOS nuclei in mice are labeled in Hoxd10–GFP mice (the MTN, DTN, and NOT). In other mammals, there is one additional AOS nucleus, the lateral terminal nucleus (LTN), but mice apparently lack an LTN (Pak et al., 1987; Yonehara et al., 2009; see Discussion). Previous studies described mouse lines that label a subset of the RGCs projecting to the AOS, but those mice did so transiently, only partially, and had many other retinal output pathways labeled as well (Yonehara et al., 2008, 2009; Kay et al., 2011). Thus, Hoxd10–GFP mice represent a powerful new tool to comprehensively parse the type and organization of retinal signals driving the AOS. In particular, they permit us to probe the identity of the labeled RGC subtypes that provide afferent drive to this system and thereby to address whether different AOS targets derive input from common or separate pools of functionally distinct RGC subtypes.
Hoxd10–RGCs include all three subtypes of On–DSGCs
We began our analysis of Hoxd10–RGCs by surveying their distribution and density in whole-mount retinal preparations (Fig. 5A–D). All the GFP+ neurons in retinas of Hoxd10–GFP mice were restricted to the ganglion cell layer and were verified as RGCs; all GFP+ fluorescence in the retina disappeared after optic nerve crush (n = 3 mice; data not shown). The total number of Hoxd10–RGCs was ∼2000 per retina [2090 ± 54 RGCs; measured from n = 5 retinas (5 mice)]. This value represents ∼3–5% of the total RGC population in mice (Dräger and Olsen, 1980; Jeon et al., 1998). The distribution of Hoxd10–RGCs was relatively uniform across the retina (Fig. 5C,D; mean density in central retina, 166 ± 35 GFP+ cells/mm2; density in peripheral retina, 159 ± 43 GFP+ cells/mm2; p = 0.68; n = 6 retinas from 3 mice).
The relatively sparse and even distribution of Hoxd10–RGCs across the retina, coupled with their highly selective projections to the brain, suggested that a limited number of RGC subtypes are labeled. However, we suspected that more than one subtype might express GFP because RGCs of the same subtype tend to be arrayed in regularly spaced mosaics across the retina (Wässle, 2004), but we often observed Hoxd10–RGC cell bodies abutting each other (Fig. 5B, red arrows).
What types of RGCs are labeled in Hoxd10–GFP mice? Two common metrics for determining RGC subtype identity are dendritic morphology and dendritic stratification in the IPL of the retina (Famiglietti and Kolb 1976; Masland, 2004; Berson, 2008). We targeted Hoxd10–GFP+ cells for intracellular fluorescent-dye filling to reveal their complete dendritic morphology (Fig. 5E). Many Hoxd10–RGCs appeared to belong to a single morphological type resembling rabbit On–DSGCs (Amthor et al., 1989; He and Masland, 1998; Ackert et al., 2006; Kanjhan and Sivyer, 2010; Hoshi et al., 2011; for mouse, see Sun et al., 2006; Yonehara et al., 2009). They had relatively large dendritic fields stratifying mainly in the On sublayer of the IPL (Table 1; mean dendritic field diameter, 291.5 ± 41.2; n = 50 cells filled; see also Fig. 5G–J and see black circles within plots in Fig. 7C–E). Most of their dendritic arbor costratified and cofasciculated with the processes of On-cholinergic amacrine cells (Fig. 5F). However, we noted that these presumptive On–DSGCs almost invariably extended a small fraction of their dendritic arbor (∼12%) distally, toward the inner nuclear layer in which they costratified and cofasciculated with the processes of Off-cholinergic amacrine cells (Fig. 5E, white dendrites, G–J, red dendrites). These presumptive On–DSGCs were easily distinguishable from other large-field, On-stratifying RGC subtypes in mice, such as the M2 and M4 intrinsically photosensitive RGCs (ipRGCs) because Hoxd10–RGC dendritic profiles were much more highly branched (76.0 ± 10.8 branch points, n = 50 cells; Fig. 7F, black circles; Table 1; for comparable data for ipRGCs, see Berson et al., 2010; Estevez et al., 2012). Collectively, the anatomical characteristics of the large-field Hoxd10–RGCs closely matched those of the On–DSGCs encountered in previous studies (Amthor et al., 1989; He and Masland, 1998; Ackert et al., 2006; Kanjhan and Sivyer, 2010; Hoshi et al., 2011; for mouse, see Sun et al., 2006; Yonehara et al., 2009).
Table 1.
Quantification of morphological properties of Hoxd10-RGCs
| On–DSGCs (n = 50) | On–Off DSGCs (n = 23) | |
|---|---|---|
| Soma diameter (μm) | 15.1 ± 2.1 | 15.9 ± 0.4 |
| Dendritic field diameter (μm)* | 291.5 ± 41.2 | 192.4 ± 2.9 |
| Total dendritic length (μm)* | 4823 ± 682 | 3285 ± 129 |
| % of total arbor in the On layer* | 88.3 ± 12.5 | 41.8 ± 2.6 |
| Total branch points | 76.0 ± 10.8 | 70.8 ± 3.8 |
| Number of primary dendrites* | 3.9 ± 0.6 | 5.4 ± 0.4 |
*p < 0.001. Values are mean ± SEM.
To determine the visual signals encoded by the large-field Hoxd10–RGCs, we maintained isolated retinas in vitro and targeted GFP+ cell bodies for whole-cell current-clamp recording (see Materials and Methods). We tested their responses to a variety of computer-generated light stimuli and simultaneously filled the recorded cells with intracellular dye to reveal their morphology. All the large-field Hoxd10–RGCs exhibited relatively sustained firing when spots of light were presented within their receptive field center (Fig. 6A), spiking for at least 2 s after stimulus onset (n = 20 cells) and for as long as 7–10 s. However, the light-evoked depolarization gradually decayed, approaching prestimulus baseline after ∼10 s. Spiking invariably ceased <20 s after stimulus onset (n = 3 cells; data not shown). Despite the fact that many large-field Hoxd10–RGCs had some portion of their dendritic arbor in the Off sublamina (Figs. 5E–J, 7C,E; Table 1), we never observed an excitatory Off response when stationary spots of light presented within the center of the receptive field of the cells were extinguished (Fig. 6F). However, some cells exhibited a brief Off hyperpolarization of 3–5 mV (data not shown). When stimulated with spots larger than the receptive field of the cell, moderate surround inhibition and attenuation of the excitatory On response was observed (Fig. 6F); excitatory Off responses were not observed under these conditions either.
These large-field Hoxd10–RGCs were clearly direction selective. The three representative cells shown in Figure 6B–D all exhibited strong directional preferences when tested with drifting high-contrast sinusoidal gratings but preferred different directions. One preferred motion upward in the visual field (Fig. 6B), a second preferred forward motion (Fig. 6C), and the third was activated best by downward motion (Fig. 6D). All recorded large-field Hoxd10–RGCs (n = 30 cells) exhibited such On–DSGC physiology, although the directions preferred and strength of directional selectivity were somewhat variable across cells, with a greater representation of forward (12 of 30) and upward (10 of 30) preferring relative to downward preferring (5 of 30) On–DSGCs. Our analysis (see Materials and Methods) showed that most preferred directions were close to the three canonical directions described for rabbit On–DSGCs (Oyster and Barlow, 1967), but that a few Hoxd10 On–DSGCs recorded showed preference for intermediate directions (3 of 30; Fig. 6E, gray lines). The mean ± SEM DSI of On Hoxd10–RGCs was quite high (0.60 ± 0.04; n = 30 cells; Fig. 6E). Thus, Hoxd10–RGCs include three subtypes of On–DSGCs.
The On–DSGCs in these mice preferred gratings of relatively low spatial frequency and moving at slow speeds (∼0.1 cycles/° at ∼3°/s; Fig. 6G,H). In response to stationary spots of white light, they preferred stimuli ∼320 μm in diameter and showed moderate surround inhibition when spots were large enough to extend beyond the receptive field center (Fig. 6F). We noted that, consistent with previous work on other DSGCs (Yang and Masland, 1992), the orientation of the dendritic morphology of the recorded Hoxd10–RGCs did not predict their preferred direction (see reconstructions in Fig. 6B–D), nor did the intensity of GFP expression in individual cells have a relationship to their preferred tuning (data not shown).
Identification of a subtype of forward-preferring On–Off DSGCs projecting to the mouse AOS
During our survey of Hoxd10–RGCs, we also encountered a second ganglion cell type that was morphologically and physiologically distinct from On–DSGCs. These cells comprised ∼32% of Hoxd10–GFP+ cells (Table 1), had considerably smaller dendritic fields than On–DSGCs, and were bistratified in the On and Off sublamina of the IPL (mean dendritic field diameter for On–Off Hoxd10–RGCs, 192.4 ± 2.9 μm, n = 23 cells; Fig. 7A–E; Table 1). These Hoxd10–RGCs had ∼60% of their dendritic arbor in the Off cholinergic band, in which they cofasciculated with the processes of Off cholinergic amacrine cells. The remaining ∼40% of their arbor costratified and cofasciculated with the processes of On cholinergic amacrine cells (Fig. 7C,E; Table 1). These morphological characteristics are signature features of On–Off DSGCs (Weng et al., 2005; Demb, 2007; Huberman et al., 2009; Kay et al., 2011; Rivlin-Etzion et al., 2011; Trenholm et al., 2011).
Targeted recordings of the bistratified Hoxd10–RGCs functionally confirmed that they were On–Off DSGCs: they responded to both the onset and offset of light stimuli and were direction selective (Fig. 8A–C). Strikingly, all of these cells responded strongest to motion in the temporal-to-nasal (forward) direction in the visual field (Fig. 8B,C; n = 17 cells). On–Off DSGCs are thought to comprise four distinct directional subtypes, preferring forward, backward, upward, or downward motion (Oyster and Barlow, 1967; for review, see Borst and Euler, 2011; Vaney et al., 2012). Three of these subtypes have been selectively labeled in other transgenic mouse lines (backward/posterior: Huberman et al., 2009; Rivlin-Etzion et al., 2011; downward/inferior: Kay et al., 2011; Trenholm et al., 2011; upward/superior: Kay et al., 2011), but to our knowledge, the Hoxd10–GFP mouse is the first with genetically labeled forward-preferring On–Off DSGCs.
Figure 8.

Hoxd10 On–Off RGCs are forward tuned and respond to slow velocities. A, Example whole-cell current-clamp recording from an On–Off RGC labeled in the Hoxd10–GFP mouse line shows transient firing in response to the onset and offset of a 5 s step of light (168 μm spot aligned to the receptive field center of the cell). B, C, Recordings demonstrate that On–Off Hoxd10–RGCs have relatively weak directional preference for temporal-to-nasal (forward) motion in visual space. This is illustrated by the example polar plot of evoked firing rate as a function of grating drift direction (B) and the population data of DSI magnitude and direction (C, n = 17 cells), plotted as in Figure 6E. Observe that the magnitude of DSI is <0.5 for all the cells tested under these conditions (compare with plot in Fig. 6E). Morphology of the recorded cell in B is shown to the right of the polar plot (black, On sublamina; red, Off sublamina of IPL). D–F, Hoxd10 On–Off RGCs prefer small spots and show robust response to slow moving gratings. Summary of preferred spot diameter (D; note that spikes evoked by light onset only were counted), spatial frequency (E), and drift speed (F) of grating drifted at the predetermined preferred direction of each cell. Mean ± SEM peak spot diameter, spatial frequency, and speed values were 163.8 ± 9.9 μm (n = 6 cells), 0.11 ± 0.01 cycles/° (n = 10 cells), and 7.7 ± 1.2°/s, respectively (n = 7). Histograms demonstrating the range of values observed are shown as inset plots in D–F. Scale bar, 50 μm.
To our surprise, Hoxd10 On–Off DSGCs differed in several respects from all previously genetically identified On–Off DSGCs in the mouse. First, their directional tuning was relatively weak (mean DSI, 0.33 ± 0.02; n = 17; approximately one-third that of posterior/backward preferring On–Off DSGCs in Drd4-GFP mice; Huberman et al., 2009). Second, they preferred relatively slow drifting gratings (Fig. 8F; 7.7 ± 1.2°/s; n = 7 cells). This was significantly faster (p < 0.01) than the mean values for Hoxd10 On–DSGCs (Fig. 6H; 3.20 ± 0.40°/s; n = 10) but still dramatically slower than the speed values reported for other On–Off DSGC subtypes in mice and rabbits (Oyster et al., 1972; Sivyer et al., 2010; Weng et al., 2005; up to 60°/s).
The forward-preferring On–Off DSGCs projecting to the AOS do not express Cart, a previously reported marker of On–Off DSGCs in mice
Kay et al. (2011) reported that cocaine- and amphetamine- regulated transcript (Cart), is a molecular marker for backward, downward and upward preferring On–Off DSGCs. We tested for the presence of this marker in Hoxd10–RGCs, expecting that it would be expressed by the On–Off DSGC subtype and perhaps even by the On–DSGCs. To our surprise, most Hoxd10–RGCs lacked Cart immunoreactivity; only 11 ± 1% were Cart+ (Fig. 9G–I,M; n = 4 retinas from 2 mice). The forward-preferring On–Off DSGCs described above comprise ∼32% of all Hoxd10–RGCs, making it unlikely that the ∼11% of Hoxd10–RGCs that express Cart include all those that are On–Off DSGCs. To rigorously test this possibility, we filled On–Off Hoxd10–RGCs, and then stained them for Cart. One such cell is shown in Figure 9N–P; this cell lacks Cart expression. Furthermore, as positive control, we assessed colocalization of Cart and GFP in two other mouse lines, Drd4–GFP and Trhr–GFP, which each express GFP selectively in backward-preferring On–Off DSGCs (Huberman et al., 2009; Kay et al., 2011; Rivlin-Etzion et al., 2011). As expected, virtually all the GFP+ RGCs in these mice express Cart (Drd4–GFP RGCs, 95 ± 2% Cart+, n = 4 retinas from 2 mice; Trhr–GFP RGCs, 100 ± 0% Cart+, n = 4 retinas from 2 mice; Fig. 9A–F,M). In contrast, genetically tagged Off α RGCs (which are not directionally tuned) never expressed Cart (0%, n = 4 retinas from 2 mice; Fig. 9J–L,M; Huberman et al., 2008).
Figure 9.

The vast majority of Hoxd10–RGCs do not express Cart, a marker for previously genetically identified On–Off DSGCs. A–F, Virtually all Drd4–GFP RGCs (A–C) and Trhr–GFP RGCs (D–F) (green) express Cart (red), a marker for On–Off DSGCs (Kay et al., 2011). White arrowheads indicate colocalization of GFP and Cart. G–L, The vast majority of Hoxd10–RGCs (G–I) and CB2-RGCs (J–L) do not express Cart. Nuclei are labeled with DAPI (blue) in A–L. Dashed circles indicate lack of Cart overlap with GFP signal. M, The percentage of different RGC subtypes that each coexpress Cart. N–P, Example of a targeted and dye-filled Hoxd10–RGC. This cell is On–Off bistratified and is not immunopositive for Cart. Boxed region indicates cell body location of filled RGCs. Scale bars: L, P, 50 μm.
Together, these data indicate that Hoxd10–RGCs include the three types of On–DSGCs (upward, downward, and forward preferring), as well as one subtype of On–Off DSGC that is selective for forward motion. Third, the On–Off DSGC subtype labeled in the Hoxd10–GFP mouse line appears both functionally and molecularly distinct from other genetically identified On–Off DSGCs, with a unique directional preference, slower speed tuning, and little, if any, Cart immunoreactivity.
Convergent and divergent DSGC projections to different AOS targets revealed by rabies virus circuit tracing
The foregoing results show that, in Hoxd10–GFP mice, two major types of RGCs are labeled, and their combined axonal projections terminate heavily in the AOS. Do the different types of Hoxd10–RGCs send information to the same or different AOS targets within the brain? To address this, we labeled the RGCs projecting to the MTN or NOT by stereotaxically injecting ΔG–RABV–mCherry into one or the other of these targets (MTN, Fig. 10A–C; NOT, Fig. 10G–I). ΔG–RABV infects the presynaptic terminals of neurons projecting to the injection site, resulting in Golgi-like expression of fluorescent reporters throughout the soma, dendrites, and axons of the neurons afferent to the injected structure, but ΔG–RABV does not transynaptically infect other neurons (Wickersham et al., 2007a,b; Osakada et al., 2011). The viral tracing experiments revealed that the Hoxd10–RGCs synapsing in the MTN consisted purely of cells with morphologies typical of On–DSGCs (Fig. 10D–F; n = 6 mice, n = 17 of 17 cells). These findings are consistent with several previous reports in a variety of mammalian species that argued that On–DSGCs are the sole source of retinal input to the MTN (Buhl and Peichl, 1986; Dann and Buhl, 1987; Yonehara et al., 2008, 2009; but see Kay et al., 2011).
Figure 10.
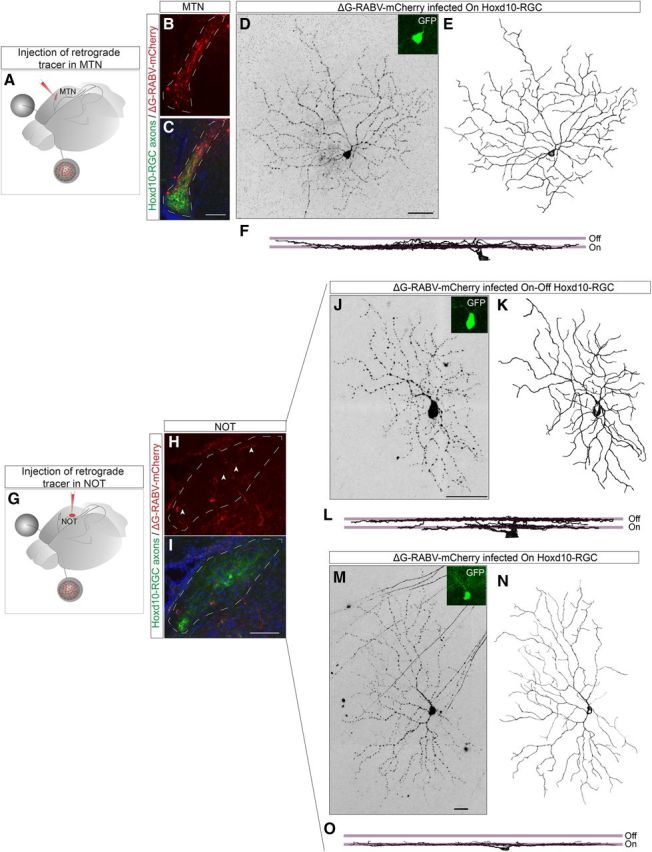
A combination of On–DGSCs and On–Off DGSCs project to the AOS target for horizontal nystagmus but not for the target involved in vertical nystagmus. A, Schematic of retrograde labeling experiments. Modified rabies virus encoding mCherry (ΔG–RABV–mCherry) was made in the MTN of Hoxd10–GFP mice to infect RGCs forming synaptic contacts within the MTN (red, injection site). Double-labeled (mCherry+ and GFP+) RGCs in retinas of injected mice were analyzed. B, C, Example of a site of infection (B, white outline) that is within the MTN. C, Example of an On Hoxd10–RGC retrogradely infected from the MTN. E, En face view (reconstruction) of an RGC shown in D. F, Side view of the dendrites of the Hoxd10–RGC shown in D and E demonstrate that the dendrites are monostratified and reside in the On sublamina of the IPL of the retina. G, Schematic of experimental setup for retrograde labeling from the NOT (similar to A). H, I, mCherry+ axon terminals (arrowheads) were observed within the GFP axon containing domain of the NOT. J, Example On–Off Hoxd10–RGC projecting to the NOT. Side view (L) of the reconstruction (K) demonstrates that the dendrites of the neuron in J stratify in the On and Off sublamina of the IPL. M, Example of an On Hoxd10–RGC forming synaptic contacts in the NOT and en face view of reconstruction (N) of RGC shown in M. O, Side view of the dendrites of the On Hoxd10–RGC.
In contrast, we found that both the On–DSGCs and On–Off DSGCs provide input to the NOT (Fig. 10J–O; n = 3 mice; n = 8 cells, 4 On–DSGCs, 4 On–Off DSGCs). This AOS target, in conjunction with the DTN, detects forward horizontal slip and drives appropriate forward image-stabilizing eye movements (Simpson, 1984; Distler and Hoffmann, 2011); this nicely matches the forward motion preference of the On–Off DSGCs identified here. A large number of RGC axons pass near or traverse through the NOT on their way to the SC. A key advantage of ΔG–RABV–mCherry is that, because it labels neurons by infecting presynaptic terminals, it is immune to incidental labeling of fibers of passage (Wickersham et al., 2007a; our unpublished observations). Consistent with this, we found that only On–DSGCs and On–Off DSGCs exhibited retrograde infection from the NOT; nonspecific labeling of RGC axons at the level of the NOT would have labeled a wide variety of RGC types because, in the mouse, ∼95% of RGCs project to the SC (Dräger and Olsen, 1980). We thus conclude that both On–DSGCs and On–Off DSGCs provide input to the NOT.
Using retrograde tracing, we found that the On–Off Hoxd10–DSGCs, but not the On Hoxd10–DSGCs, project to the SC (Fig. 11; n = 5 mice; n = 7 of 7 cells, On–Off Hoxd10–GFP+). Along with our analysis of GFP+ axonal projections (Fig. 2), these retrograde tracing experiments indicate that (1) GFP-labeled On–DSGCs in the Hoxd10–GFP mouse innervate both the MTN and NOT, and (2) On–Off Hoxd10–RGCs target the NOT as well as the SC.
Figure 11.

Retrograde labeling and anatomical identification of the Hoxd10–RGCs projecting to the SC indicates that they are On–Off DSGCs. A, Schematic of experimental paradigm. CTb–555 was injected in the SC, and double-positive (GFP+ and CTb–555+) Hoxd10–RGCs were analyzed. B, Representative example of collicular injection. Scale bar, 500 μm. C, Summary of injection locations in the SC shown in top view. D, Example On–Off Hoxd10–RGC retrogradely labeled from the SC. Scale bar, 50 μm. E, Reconstruction of retrogradely labeled Hoxd10–RGC shown in D. F, Side view of the same On–Off Hoxd10–RGC demonstrates that the dendrites of the retrogradely labeled RGC are in the On and Off sublamina of IPL of the retina. D, Dorsal; R, rostral; L, lateral.
To determine the percentage of AOS-projecting RGCs that were Hoxd10–GFP+, we retrogradely labeled RGCs from AOS targets by injections of either CTb–555 (n = 2 mice; 635 RGCs examined) or ΔG–RABV–mCherry (n = 3 mice; 38 RGCs examined). Combined (n = 5 mice), 61 ± 4% of the retrogradely labeled RGCs were Hoxd10–GFP+. We assume that a fairly large percentage of the GFP-negative AOS-projecting RGCs belong to the downward-preferring On–DSGCs based on the relative distributions of direction-tuned RGCs represented in Hoxd10–GFP mice (Fig. 6E), but we acknowledge that other RGC subtypes may be included in this group as well.
Behavioral analysis of image-stabilizing eye movements in awake mice
How does the tuning profile of Hoxd10–RGCs relate to the tuning profile of retinal-slip-compensating eye movements? To address this, we quantitatively analyzed reflexive eye movements in awake mice. A mouse was head fixed and surrounded by three computer screens, allowing it a panoramic field of view. A CCD camera captured the image of one eye as visual signals were presented (Fig. 12A). The deflection of the pupil was measured relative to a fixed reflection point on the globe of the eye during the presentation of full-field moving gratings (Fig. 12B,C). The gain of the slip-compensating eye movement, defined as the eye velocity divided by stimulus velocity, was obtained from the responses to presentations of gratings of varying spatial and temporal frequencies (Fig. 12D and Notes). In this configuration, a gain of 1 indicated that the eye velocity matched exactly with the stimulus velocity, whereas a gain of <1 indicated that the eye moved at a slower velocity than the stimulus.
First, we measured the gain evoked by gratings presented at 0.06 cycles/°. We presented this spatial frequency at multiple speeds and found that the peak gain occurred when the mouse was presented with stimuli moving at 0.83–1.67°/s (Fig. 12E; maximal gain, 0.39; n = 5 C57BL/6 wild-type mice). We also measured the gain of the behavioral response to a relatively higher spatial frequency stimulus of 0.16 cycles/°. Again, the gain of the behavioral response was greatest for slow-velocity stimuli, peaking at 1.25°/s (Fig. 12E; maximal gain, 0.73 ± 0.03°/s; n = 5 C57BL/6 wild-type mice; see Notes). When we kept the spatial frequency constant at 0.16 cycles/° but increased the stimulus velocity to 12.5°/s, the gain of the response dropped by ∼50% to 0.35 ± 0.3°/s (Fig. 12E and Notes). The gain dropped further to 0.03 ± 0.004°/s when the same stimulus was presented at 37.5°/s (Fig. 12E and Notes). Numerous studies have shown that horizontal slip-compensating eye movements are driven by activation of neurons in the NOT (monkey, Schiff et al., 1988; rabbit, Collewijn, 1975a,b; cat, Hoffmann and Fischer, 2001; rat, Schmidt et al., 1998; Ferrari et al., 2009). Thus, just as the On–DSGCs and the On–Off DSCGs that are labeled in Hoxd10–GFP mice and that project to the NOT respond best to relatively slow-velocity stimuli, the behavioral output of the NOT measured at the level of horizontal slip-compensating eye movements is tuned to slow velocities.
Discussion
Here we used genetic, viral, and physiological methods to parse the retinal cell types projecting to the AOS in the mouse, which is an increasingly popular model species for studies of visual system structure and function (Huberman and Niell, 2011). Our results confirmed many key elements established by classic studies of the AOS image-stabilization network, but they also revealed several new pieces of information, including the discovery that, in the mouse, forward-preferring On-Off direction-tuned signals from the retina project to specific AOS nuclei. Moreover, we identified a slow-velocity tuned On–Off DSGC that is molecularly distinct from other genetically identified DSGC subtypes in this species.
Architecture of the AOS projections and targets in the mouse
Classic work in rabbits established that each AOS target nucleus encodes retinal slip at velocities precisely matched to the requirements of visually driven image stabilization (Simpson, 1984). They also established that the different AOS nuclei prefer different directions of slip: (1) forward for NOT–DTN; (2) upward for MTN; and (3) downward for the LTN, a structure that, in rabbits, resides along the superior fasciculus of the accessory optic tract. The tuning of neurons in each of these targets is thought to reflect input from the three different subtypes of On–DSGCs. The highly specific GFP expression in the Hoxd10 mouse paints a complete picture of the retinal projections to the mouse AOS, comprising the two subdivisions of the MTN, as well as the NOT and the DTN (Fig. 12F). It is interesting to note that neither we nor other groups have observed evidence of an LTN in mice, regardless of whether RGC axons were labeled by classic (e.g., HRP) or modern (e.g., cholera toxin, GFP) tracers (Pak et al., 1987; Yonehara et al., 2009; this study). This is presumably not because this functional component is lacking in mice but rather because it sits in a slightly different position, within the ventral MTN. Indeed, Yonehara et al. (2009) showed that neurons in the mouse ventral MTN respond to downward stimuli (which matches the tuning of rabbit LTN neurons). Here we showed that (1) downward-tuned On–DSGCs express GFP in Hoxd10 mice (Fig. 6D,E), and (2) both the dorsal and ventral MTN receive dense input from Hoxd10–GFP+ RGC axons. The small size and close apposition of dorsal and ventral MTN make it difficult to selectively target one or the other of these structures for retrograde tracing. In the future, the identification of mice that selectively express Cre in On–DSGCs responding to particular axes of motion should enable fine dissection of these input-target relationships.
Parallel and convergent visual inputs to the mouse AOS
Our data help clarify several previously unresolved aspects of AOS cell types and circuitry. The dominant model for the past three decades was that On–Off DSGCs do not feed the AOS. Initially, Oyster and coworkers proposed that On–Off DSGCs might drive optokinetic nystagmus (Oyster and Barlow, 1967) but then later modified that proposal based on the mismatch between the velocity tuning of optokinetic responses and On–Off DSGCs (Oyster et al., 1972). Here, we demonstrate that, in the mouse, there is an additional stream of visual motion information reaching specific AOS target nuclei. By genetically identifying the RGCs that project to AOS targets in the mouse and by retrograde tracing with rabies viruses, we determined that the NOT, a major component of the AOS serving horizontal image stabilization, receives convergent input from both On–DSGCs and forward-preferring On–Off DSGCs.
Our current results are in general agreement with the finding reported by Kay et al. (2011) that vertically preferring On–Off DSGCs project to the NOT and MTN in the mouse. Interestingly, our results show that forward-preferring Hoxd10 On–Off DSGCs project to the NOT but not to the MTN. Together, these findings raise the question of whether or not postsynaptic neurons in AOS nuclei combine different directional signals from the retina to generate eye movements in a single preferred direction in a manner similar to that proposed by Levick et al. (1969), in which RGCs with different preferred directions are combined in local circuits of central targets to improve direction tuning.
Diversity of DSGC subtypes
To our knowledge, the slow-velocity On–Off DSGCs that are labeled in Hoxd10–GFP mice and that project to the AOS have not been reported previously in mice or in other species. The classic model of direction selectivity posits there are four subtypes of On–Off DSGCs, responding to a different cardinal axis of motion and all tuned for relatively high velocity stimuli when compared with On–DSGCs (for review, see Vaney et al., 2001; Borst and Euler, 2011). Our data reveal the existence of an On–Off DSGC subtype that projects to the AOS and that is tuned for slow-velocity stimuli in the same range within which On–DSGCs respond best. Interestingly, these slow tuned On–Off DSGCs are biased for forward (temporal-to-nasal) motion, and they project their axons to the NOT, the target that drives horizontal optokinetic nystagmus. In this way, they appear optimally designed for a specific category of AOS function. In the future, the identification of mice with this population of RGCs selectively expressing Cre would allow us to test their contributions to various forms of eye-movement/image-stabilization behavior, much in the same way that the functional role of the various subtypes of ipRGCs have been probed (Chen et al., 2011).
Moreover, unlike previously identified On–Off DSGCs in mice representing the other three axes of motion (upward, downward, and backward; Fig. 9; Kay et al., 2011), these forward-preferring slow-tuned Hoxd10 On–Off DSGCs are not immunopositive for the marker Cart. Because ours represents the first genetic identification of any forward-preferring On–Off DSGCs in mice, we do not know whether their lack of Cart expression is related to their directional tuning (forward), their slow-velocity tuning, or some other feature that is not shared with the Cart+ backward-, downward-, and upward-tuned On–Off DSGCs. It remains to be seen whether there are other forward-preferring On–Off DSGC subtypes in the mouse and whether they have velocity and spatial tuning profiles that more closely resemble the previously identified On–Off DSGCs subtypes.
Our data add to a growing body of evidence suggesting that there may be more subtypes of DSGCs than previously thought. For example, there appear to be at least two subtypes of posterior (backward)-tuned On–Off DSGCs in the mouse (Rivlin-Etzion et al., 2011). Also, there appear to be multiple subtypes of rabbit On–DSGCs tuned for the same directions, some transient and some sustained (Hoshi et al., 2011). In addition, Off–DSGCs were reported by Kim et al. (2008). Our data provide additional evidence of DSGC heterogeneity and suggest that the classic model of seven to eight subtypes of DSGCs is likely to be an underestimate. Rather, we hypothesize that both On–DSGCs and On–Off DSGCs contain multiple subtypes tuned for the same axes of motion, with properties (e.g., velocity tuning) that are optimally matched to the function of their specific central targets and downstream circuitry.
Notes
Supplemental material for this article is available at http://www.hubermanlab.com/movies.html. Movies of eye tracking in mice viewing drifting gratings. Each movie represents presentations of stimuli at a spatial frequency of 0.16 cycles/°, presented at different speeds. Movie 1, Stimulus speed, 1.25°/s; average gain of the response, 0.73. Movie 2, Stimulus speed, 12.5°/s; average gain of the response, 0.35. Movie 3, Stimulus speed, 37.5°/s; average gain of the response, 0.03 This material has not been peer reviewed.
Footnotes
This work was supported by The Knights Templar Eye Foundation (O.S.D.), National Institutes of Health Grants F32-EY021994 (M.E.E.), R01-EY012793 (D.M.B.), and R01-EY022157-01 (A.D.H.), and grants from the Glaucoma Research Foundation (A.D.H.), the E. Matilda Ziegler Foundation for the Blind (A.D.H.), the Whitehall Foundation (A.D.H.), the McKnight Foundation (A.D.H.), the Pew Charitable Trusts (A.D.H.), and Vision Core Grant P30 EY019005. We thank Boahua Liu for assistance with the design and assembly of behavioral apparatus and software, Fumitaka Osakada and Ed Callaway for mCherry-tagged glycoprotein-deficient rabies viruses, and Cameron Bates, Michelle Fogerson, Mio Akasako, and Ann Phan for technical assistance. We also thank Dianne and Kimberly Boghossian for animal care and genotyping, Inkyu Kim and Timothy Firman for assistance in analysis of morphological data, and Isaiah Berson, Austin Ha, Shai Sabbah, Jordan Renna, and Bart Borghuis for technical assistance with receptive field stimulus setup and programming.
References
- Ackert JM, Wu SH, Lee JC, Abrams J, Hu EH, Perlman I, Bloomfield SA. Light-induced changes in spike synchronization between coupled ON direction selective ganglion cells in the mammalian retina. J Neurosci. 2006;26:4206–4215. doi: 10.1523/JNEUROSCI.0496-06.2006. [DOI] [PMC free article] [PubMed] [Google Scholar]
- Amthor FR, Takahashi ES, Oyster CW. Morphologies of rabbit retinal ganglion cells with complex receptive fields. J Comp Neurol. 1989;280:97–121. doi: 10.1002/cne.902800108. [DOI] [PubMed] [Google Scholar]
- Barlow HB, Hill RM. Selective sensitivity to direction of movement in ganglion cells of the rabbit retina. Science. 1963;139:412–414. doi: 10.1126/science.139.3553.412. [DOI] [PubMed] [Google Scholar]
- Barlow HB, Hill RM, Levick WR. Retinal ganglion cells responding selectively to direction and speed of image motion in the rabbit. J Physiol. 1964;173:377–407. doi: 10.1113/jphysiol.1964.sp007463. [DOI] [PMC free article] [PubMed] [Google Scholar]
- Beier KT, Borghuis BG, El-Danaf RN, Huberman AD, Demb JB, Cepko CL. Transynaptic tracing with vesicular stomatitis virus reveals novel retinal circuitry. J Neurosci. 2013;33:35–51. doi: 10.1523/JNEUROSCI.0245-12.2013. [DOI] [PMC free article] [PubMed] [Google Scholar]
- Berson DM. Retinal ganglion cell types and their central projections. In: Albright TD, Masland R, editors. The senses: a comprehensive reference, Vol 1, Vision 1. San Diego: Academic; 2008. pp. 491–520. [Google Scholar]
- Berson DM, Castrucci AM, Provencio I. Morphology and mosaics of melanopsin-expressing retinal ganglion cell types in mice. J Comp Neurol. 2010;518:2405–2422. doi: 10.1002/cne.22381. [DOI] [PMC free article] [PubMed] [Google Scholar]
- Borst A, Euler T. Seeing things in motion: models, circuits, and mechanisms. Neuron. 2011;71:974–994. doi: 10.1016/j.neuron.2011.08.031. [DOI] [PubMed] [Google Scholar]
- Buhl EH, Peichl L. Morphology of rabbit retinal ganglion cells projecting to the medial terminal nucleus of the accessory optic system. J Comp Neurol. 1986;253:163–174. doi: 10.1002/cne.902530204. [DOI] [PubMed] [Google Scholar]
- Chen SK, Badea TC, Hattar S. Photoentrainment and pupillary light reflex are mediated by distinct populations of ipRGCs. Nature. 2011;476:92–95. doi: 10.1038/nature10206. [DOI] [PMC free article] [PubMed] [Google Scholar]
- Collewijn H. Oculomoter areas in the rabbit's midbrain and tectum. J Neurobiol. 1975a;6:3–22. doi: 10.1002/neu.480060106. [DOI] [PubMed] [Google Scholar]
- Collewijn H. Direction-selective units in the rabbit's nucleus of the optic tract. Brain Res. 1975b;100:489–508. doi: 10.1016/0006-8993(75)90154-7. [DOI] [PubMed] [Google Scholar]
- Dann JF, Buhl EH. Retinal ganglion cells projecting to the accessory optic system in the rat. J Comp Neurol. 1987;262:141–158. doi: 10.1002/cne.902620111. [DOI] [PubMed] [Google Scholar]
- Demb JB. Cellular mechanisms for direction selectivity in the retina. Neuron. 2007;55:179–186. doi: 10.1016/j.neuron.2007.07.001. [DOI] [PubMed] [Google Scholar]
- Distler C, Hoffmann KP. The optokinetic reflex. In: Liversedge SP, Gilchrist ID, Everling S, editors. The Oxford handbook of eye movements. Oxford: Oxford UP; 2011. pp. 65–83. [Google Scholar]
- Dräger UC, Olsen JF. Origins of crossed and uncrossed retinal projections in pigmented and albino mice. J Comp Neurol. 1980;191:383–412. doi: 10.1002/cne.901910306. [DOI] [PubMed] [Google Scholar]
- Ecker JL, Dumitrescu ON, Wong KY, Alam NM, Chen SK, LeGates T, Renna JM, Prusky GT, Berson DM, Hattar S. Melanopsinexpressing retinal ganglion-cell photoreceptors: cellular diversity and role in pattern vision. Neuron. 2010;67:49–60. doi: 10.1016/j.neuron.2010.05.023. [DOI] [PMC free article] [PubMed] [Google Scholar]
- Estevez ME, Fogerson PM, Ilardi MC, Borghuis BG, Chan E, Weng S, Auferkorte ON, Demb JB, Berson DM. Form and function of the M4 cell, an intrinsically photosensitive retinal ganglion cell type contributing to geniculocortical vision. J Neurosci. 2012;32:13608–13620. doi: 10.1523/JNEUROSCI.1422-12.2012. [DOI] [PMC free article] [PubMed] [Google Scholar]
- Famiglietti EV, Jr, Kolb H. Structural basis for ON- and OFF-center responses in retinal ganglion cells. Science. 1976;194:193–195. doi: 10.1126/science.959847. [DOI] [PubMed] [Google Scholar]
- Faulstich BM, Onori KA, du Lac S. Comparison of plasticity and development of mouse optokinetic and vestibulo-ocular reflexes suggests differential gain control mechanisms. Vision Res. 2004;44:3419–3427. doi: 10.1016/j.visres.2004.09.006. [DOI] [PubMed] [Google Scholar]
- Ferrari R, Fonda S, Corradini M, Biral G. The commissural transfer of the horizontal optokinetic signal in the rat: a c-Fos study. Exp Brain Res. 2009;198:85–94. doi: 10.1007/s00221-009-1935-x. [DOI] [PubMed] [Google Scholar]
- Giolli RA, Blanks RH, Lui F. The accessory optic system: basic organization with an update on connectivity, neurochemistry, and function. Prog Brain Res. 2006;151:407–440. doi: 10.1016/S0079-6123(05)51013-6. [DOI] [PubMed] [Google Scholar]
- He S, Masland RH. ON direction-selective ganglion cells in the rabbit retina: dendritic morphology and pattern of fasciculation. Vis Neurosci. 1998;15:369–375. doi: 10.1017/S095252389815215X. [DOI] [PubMed] [Google Scholar]
- Hoffmann KP, Fischer WH. Directional effect of inactivation of the nucleus of the optic tract on optokinetic nystagmus in the cat. Vision Res. 2001;41:3389–3398. doi: 10.1016/S0042-6989(01)00184-5. [DOI] [PubMed] [Google Scholar]
- Hoshi H, Tian LM, Massey SC, Mills SL. Two distinct types of ON directionally selective ganglion cells in the rabbit retina. J Comp Neurol. 2011;519:2509–2521. doi: 10.1002/cne.22678. [DOI] [PMC free article] [PubMed] [Google Scholar]
- Huberman AD, Niell CM. What can mice tell us about how vision works? Trends Neurosci. 2011;34:464–473. doi: 10.1016/j.tins.2011.07.002. [DOI] [PMC free article] [PubMed] [Google Scholar]
- Huberman AD, Manu M, Koch SM, Susman MW, Lutz AB, Ullian EM, Baccus SA, Barres BA. Architecture and activity-mediated refinement of axonal projections from a mosaic of genetically identified retinal ganglion cells. Neuron. 2008;59:425–438. doi: 10.1016/j.neuron.2008.07.018. [DOI] [PMC free article] [PubMed] [Google Scholar]
- Huberman AD, Wei W, Elstrott J, Stafford BK, Feller MB, Barres BA. Genetic identification of an On-Off direction-selective retinal ganglion cell subtype reveals a layer-specific subcortical map of posterior motion. Neuron. 2009;62:327–334. doi: 10.1016/j.neuron.2009.04.014. [DOI] [PMC free article] [PubMed] [Google Scholar]
- Jeon CJ, Strettoi E, Masland RH. The major cell populations of the mouse retina. J Neurosci. 1998;18:8936–8946. doi: 10.1523/JNEUROSCI.18-21-08936.1998. [DOI] [PMC free article] [PubMed] [Google Scholar]
- Kanjhan R, Sivyer B. Two types of ON direction-selective ganglion cells in rabbit retina. Neurosci Lett. 2010;483:105–109. doi: 10.1016/j.neulet.2010.07.071. [DOI] [PubMed] [Google Scholar]
- Kay JN, De la Huerta I, Kim IJ, Zhang Y, Yamagata M, Chu MW, Meister M, Sanes JR. Retinal ganglion cells with distinct directional preferences differ in molecular identity, structure, and central projections. J Neurosci. 2011;31:7753–7762. doi: 10.1523/JNEUROSCI.0907-11.2011. [DOI] [PMC free article] [PubMed] [Google Scholar]
- Kim IJ, Zhang Y, Yamagata M, Meister M, Sanes JR. Molecular identification of a retinal cell type that responds to upward motion. Nature. 2008;452:478–482. doi: 10.1038/nature06739. [DOI] [PubMed] [Google Scholar]
- Kim IJ, Zhang Y, Meister M, Sanes JR. Laminar restriction of retinal ganglion cell dendrites and axons: subtype-specific developmental patterns revealed with transgenic markers. J Neurosci. 2010;30:1452–1462. doi: 10.1523/JNEUROSCI.4779-09.2010. [DOI] [PMC free article] [PubMed] [Google Scholar]
- Levick WR, Oyster CW, Takahashi E. Rabbit lateral geniculate nucleus: sharpener of directional information. Science. 1969;165:712–714. doi: 10.1126/science.165.3894.712. [DOI] [PubMed] [Google Scholar]
- Marvin JS, Borghuis BG, Tian L, Cichon J, Harnett MT, Akerboom J, Gordus A, Renninger SL, Chen TW, Bargmann CI, Orger MB, Schreiter ER, Demb JB, Gan WB, Hires SA, Looger LL. An optimized fluorescent probe for visualizing glutamate neurotransmission. Nat Methods. 2013;10:162–170. doi: 10.1038/nmeth.2333. [DOI] [PMC free article] [PubMed] [Google Scholar]
- Masland RH. Neuronal cell types. Curr Biol. 2004;14:R497–R500. doi: 10.1016/j.cub.2004.06.035. [DOI] [PubMed] [Google Scholar]
- Osakada F, Mori T, Cetin AH, Marshel JH, Virgen B, Callaway EM. New rabies virus variants for monitoring and manipulating activity and gene expression in defined neural circuits. Neuron. 2011;71:617–631. doi: 10.1016/j.neuron.2011.07.005. [DOI] [PMC free article] [PubMed] [Google Scholar]
- Osterhout JA, Josten N, Yamada J, Pan F, Wu SW, Nguyen PL, Panagiotakos G, Inoue YU, Egusa SF, Volgyi B, Inoue T, Bloomfield SA, Barres BA, Berson DM, Feldheim DA, Huberman AD. Cadherin-6 mediates axon-target matching in a non-image-forming visual circuit. Neuron. 2011;71:632–639. doi: 10.1016/j.neuron.2011.07.006. [DOI] [PMC free article] [PubMed] [Google Scholar]
- Oyster CW, Barlow HB. Direction-selective units in rabbit retina: distribution of preferred direction. Science. 1967;155:841–842. doi: 10.1126/science.155.3764.841. [DOI] [PubMed] [Google Scholar]
- Oyster CW, Takahashi E, Collewijn H. Direction-selective retinal ganglion cells and control of optokinetic nystagmus in the rabbit. Vision Res. 1972;12:183–193. doi: 10.1016/0042-6989(72)90110-1. [DOI] [PubMed] [Google Scholar]
- Oyster CW, Simpson JI, Takahashi ES, Soodak RE. Retinal ganglion cells projecting to the rabbit accessory optic system. J Comp Neurol. 1980;190:49–61. doi: 10.1002/cne.901900105. [DOI] [PubMed] [Google Scholar]
- Pak MW, Giolli RA, Pinto LH, Mangini NJ, Gregory KM, Vanable JW., Jr Retinopretectal and accessory optic projections of normal mice and the OKN-defective mutant mice beige, beige-J, and pearl. J Comp Neurol. 1987;258:435–446. doi: 10.1002/cne.902580311. [DOI] [PubMed] [Google Scholar]
- Pu ML, Amthor FR. Dendritic morphologies of retinal ganglion cells projecting to the nucleus of the optic tract in the rabbit. J Comp Neurol. 1990;302:657–674. doi: 10.1002/cne.903020319. [DOI] [PubMed] [Google Scholar]
- Pu M, Berson DM, Pan T. Structure and function of retinal ganglion cells innervating the cat's genicuate wing: an in vitro study. J Neurosci. 1994;14:4338–4358. doi: 10.1523/JNEUROSCI.14-07-04338.1994. [DOI] [PMC free article] [PubMed] [Google Scholar]
- Remtulla S, Hallett PE. A schematic eye for the mouse, and comparisons with the rat. Vision Res. 1985;25:21–31. doi: 10.1016/0042-6989(85)90076-8. [DOI] [PubMed] [Google Scholar]
- Rivlin-Etzion M, Zhou K, Wei W, Elstrott J, Nguyen PL, Barres BA, Huberman AD, Feller MB. Transgenic mice reveal unexpected diversity of on-off direction-selective retinal ganglion cell subtypes and brain structures involved in motion processing. J Neurosci. 2011;31:8760–8769. doi: 10.1523/JNEUROSCI.0564-11.2011. [DOI] [PMC free article] [PubMed] [Google Scholar]
- Schiff D, Cohen B, Raphan T. Nystagmus induced by stimulation of the nucleus of the optic tract in the monkey. Exp Brain Res. 1988;70:l–14. doi: 10.1007/BF00271841. [DOI] [PubMed] [Google Scholar]
- Schiller PH. Parallel information processing channels created in the retina. Proc Natl Acad Sci U S A. 2010;107:17087–17094. doi: 10.1073/pnas.1011782107. [DOI] [PMC free article] [PubMed] [Google Scholar]
- Schmidt M, van der Togt C, Wahle P, Hoffmann KP. Characterization of a directional selective inhibitory input from the medial terminal nucleus to the pretectal nuclear complex in the rat. Eur J Neurosci. 1998;10:1533–1543. doi: 10.1046/j.1460-9568.1998.00161.x. [DOI] [PubMed] [Google Scholar]
- Simpson JI. The accessory optic system. Annu Rev Neurosci. 1984;7:13–41. doi: 10.1146/annurev.ne.07.030184.000305. [DOI] [PubMed] [Google Scholar]
- Simpson JI, Leonard CS, Soodak RE. The accessory optic system of rabbit. II. Spatial organization of direction selectivity. J Neurophysiol. 1988a;60:2055–2072. doi: 10.1152/jn.1988.60.6.2055. [DOI] [PubMed] [Google Scholar]
- Simpson JI, Leonard CS, Soodak RE. The accessory optic system. Analyzer of self-motion. Ann N Y Acad Sci. 1988b;545:170–179. doi: 10.1111/j.1749-6632.1988.tb19562.x. [DOI] [PubMed] [Google Scholar]
- Sivyer B, van Wyk M, Vaney DI, Taylor WR. Synaptic inputs and timing underlying the velocity tuning of direction-selective ganglion cells in rabbit retina. J Physiol. 2010;588:3243–3253. doi: 10.1113/jphysiol.2010.192716. [DOI] [PMC free article] [PubMed] [Google Scholar]
- Soodak RE, Simpson JI. The accessory optic system of rabbit. I. Basic visual response properties. J Neurophysiol. 1988;60:2037–2054. doi: 10.1152/jn.1988.60.6.2037. [DOI] [PubMed] [Google Scholar]
- Stahl JS. Calcium channelopathy mutants and their role in ocular motor research. Ann N Y Acad Sci. 2002;956:64–74. doi: 10.1111/j.1749-6632.2002.tb02809.x. [DOI] [PubMed] [Google Scholar]
- Stahl JS, van Alphen AM, De Zeeuw CI. A comparison of video and magnetic search coil recordings of mouse eye movements. J Neurosci Methods. 2000;99:101–110. doi: 10.1016/S0165-0270(00)00218-1. [DOI] [PubMed] [Google Scholar]
- Sun L, Han X, He S. Direction-selective circuitry in rat retina develops independently of GABAergic, cholinergic and action potential activity. PLoS One. 2011;6:e19477. doi: 10.1371/journal.pone.0019477. [DOI] [PMC free article] [PubMed] [Google Scholar]
- Sun W, Deng Q, Levick WR, He S. ON direction-selective ganglion cells in the mouse retina. J Physiol. 2006;576:197–202. doi: 10.1113/jphysiol.2006.115857. [DOI] [PMC free article] [PubMed] [Google Scholar]
- Telkes I, Distler C, Hoffmann KP. Retinal ganglion cells projecting to the nucleus of the optic tract and the dorsal terminal nucleus of the accessory optic system in macaque monkeys. Eur J Neurosci. 2000;12:2367–2375. doi: 10.1046/j.1460-9568.2000.00133.x. [DOI] [PubMed] [Google Scholar]
- Trenholm S, Johnson K, Li X, Smith RG, Awatramani GB. Parallel mechanisms encode direction in the retina. Neuron. 2011;71:683–694. doi: 10.1016/j.neuron.2011.06.020. [DOI] [PMC free article] [PubMed] [Google Scholar]
- Vaney DI, Sivyer B, Taylor WR. Direction selectivity in the retina: symmetry and asymmetry in structure and function. Nat Rev Neurosci. 2012;13:194–208. doi: 10.1038/nrn3165. [DOI] [PubMed] [Google Scholar]
- Vaney DI, He S, Taylor WR, Levick WR. Direction-selective ganglion cells in the retina. In: Zanker JM, Zeil J, editors. Motion vision-computational, neural, and ecological constraints. Berlin: Springer; 2001. pp. 13–56. [Google Scholar]
- Wässle H. Parallel processing in the mammalian retina. Nat Rev Neurosci. 2004;5:747–757. doi: 10.1038/nrn1497. [DOI] [PubMed] [Google Scholar]
- Weng S, Sun W, He S. Identification of ON-OFF direction-selective ganglion cells in the mouse retina. J Physiol. 2005;562:915–923. doi: 10.1113/jphysiol.2004.076695. [DOI] [PMC free article] [PubMed] [Google Scholar]
- Wickersham IR, Finke S, Conzelmann KK, Callaway EM. Retrograde neuronal tracing with a deletion-mutant rabies virus. Nat Methods. 2007a;4:47–49. doi: 10.1038/nmeth999. [DOI] [PMC free article] [PubMed] [Google Scholar]
- Wickersham IR, Lyon DC, Barnard RJ, Mori T, Finke S, Conzelmann KK, Young JA, Callaway EM. Monosynaptic restriction of transsynaptic tracing from single, genetically targeted neurons. Neuron. 2007b;53:639–647. doi: 10.1016/j.neuron.2007.01.033. [DOI] [PMC free article] [PubMed] [Google Scholar]
- Xu Z, Zeng Q, Shi X, He S. Changing coupling pattern of the ON-OFF Direction-selective ganglion cells in early postnatal mouse retina. Neuroscience. 2013;250:798–808. doi: 10.1016/j.neuroscience.2013.06.013. [DOI] [PubMed] [Google Scholar]
- Yang G, Masland RH. Direct visualization of the dendritic and receptive fields or directionally selective retinal ganglion cells. Science. 1992;258:1949–1952. doi: 10.1126/science.1470920. [DOI] [PubMed] [Google Scholar]
- Yonehara K, Shintani T, Suzuki R, Sakuta H, Takeuchi Y, Nakamura-Yonehara K, Noda M. Expression of SPIG1 reveals development of a retinal ganglion cell subtype projecting to the medial terminal nucleus in the mouse. PLoS One. 2008;3:e1533. doi: 10.1371/journal.pone.0001533. [DOI] [PMC free article] [PubMed] [Google Scholar]
- Yonehara K, Ishikane H, Sakuta H, Shintani T, Nakamura-Yonehara K, Kamiji NL, Usui S, Noda M. Identification of retinal ganglion cells and their projections involved in central transmission of information about upward and downward image motion. PLoS One. 2009;4:e4320. doi: 10.1371/journal.pone.0004320. [DOI] [PMC free article] [PubMed] [Google Scholar]