

Abstract
Different levels of cholinergic neuromodulatory tone have been hypothesized to set the state of cortical circuits either to one dominated by local cortical recurrent activity (low ACh) or to one dependent on thalamic input (high ACh). High ACh levels depress intracortical but facilitate thalamocortical synapses, whereas low levels potentiate intracortical synapses. Furthermore, recent work has implicated the thalamus in controlling cortical network state during waking and attention, when ACh levels are highest. To test this hypothesis, we used rat thalamocortical slices maintained in medium to generate spontaneous up- and down-states and applied different ACh concentrations to slices in which thalamocortical connections were either maintained or severed. The effects on spontaneous and evoked up-states were measured using voltage-sensitive dye imaging, intracellular recordings, local field potentials, and single/multiunit activity. We found that high ACh can increase the frequency of spontaneous up-states, but reduces their duration in slices with intact thalamocortical connections. Strikingly, when thalamic connections are severed, high ACh instead greatly reduces or abolishes spontaneous up-states. Furthermore, high ACh reduces the spatial propagation, velocity, and depolarization amplitude of evoked up-states. In contrast, low ACh dramatically increases up-state frequency regardless of the presence or absence of intact thalamocortical connections and does not reduce the duration, spatial propagation, or velocity of evoked up-states. Therefore, our data support the hypothesis that strong cholinergic modulation increases the influence, and thus the signal-to-noise ratio, of afferent input over local cortical activity and that lower cholinergic tone enhances recurrent cortical activity regardless of thalamic input.
Introduction
Cholinergic input plays a key role in setting the state of cortical networks and modulating their responses to afferent input. During waking and REM sleep, when acetylcholine (ACh) levels are high (Jasper and Tessier, 1971; Marrosu et al., 1995), cortical cells are depolarized and under constant synaptic bombardment (Steriade et al., 2001). During non-REM (NREM) sleep, when ACh levels are low, the cortex generates the slow oscillation (<1 Hz) consisting of alternating bouts of neuronal depolarization and network activity (up-states) and neuronal hyperpolarization and quiescence (down-states; Steriade et al., 1993a). During the slow oscillation, afferent input can trigger an up-state that propagates across the cortex, whereas during waking, cortical responses are spatially constrained and shorter in duration and amplitude (Wörgötter et al., 1998; Crochet and Petersen, 2006; Ferezou et al., 2006; Civillico and Contreras, 2012).
ACh acts directly on the cortex via diffuse projections from the basal forebrain (Mesulam and Van Hoesen, 1976; Houser et al., 1985) and indirectly via excitation of thalamic relay cells (Hallanger et al., 1987; McCormick and Prince, 1987; McCormick and Pape, 1988). In vitro, application of muscarinic agonists causes presynaptic depression of intracortical synapses (Hasselmo and Bower, 1992; Gil et al., 1997). In part, this has led to the hypothesis that high ACh levels during waking and attention cause cortical activation to become dependent on afferent input, whereas low ACh levels during NREM sleep promote self-generated, synchronized cortical recurrent activity to reactivate memory traces (Wilson and McNaughton, 1994; Steriade et al., 2001; Hasselmo and McGaughy, 2004). In support of this hypothesis, Kuczewski et al. (2005) found in cortical slices that bath application of higher concentrations of ACh depress synaptic transmission whereas lower concentrations cause facilitation. If recurrent cortical feedback is suppressed by high ACh during waking, the thalamus may play a key role in triggering and sustaining cortical activity. Indeed, two recent in vivo studies concluded that the active cortical state observed during waking requires input from primary sensory thalamus (Hirata and Castro-Alamancos, 2010; Poulet et al., 2012).
Here we tested the hypothesis that different concentrations of ACh switch the cortical network state from one in which most activity is generated within local cortical circuits to one in which cortical activity depends on afferent input. We used thalamocortical slices maintained in medium that promotes spontaneous up- and down-states (Sanchez-Vives and McCormick, 2000). We bath applied ACh in a range of concentrations that were previously shown to either facilitate or depress cortical synapses via recruitment of different subsets of muscarinic ACh receptors in vitro in the absence of acetylcholinesterase inhibitors (Kuczewski et al., 2005). We found that cortical network activity is regulated relative to the level of tonic cholinergic modulation. At higher concentrations, ACh reduces the propagation, duration, and amplitude of evoked up-states and the thalamus is required to reliably observe spontaneous up-states. In contrast, at lower concentrations, ACh directly excites the cortex to increase the frequency of spontaneous up-states independently of intact thalamic afferents and does not limit propagation, duration, or amplitude of up-states.
Materials and Methods
Slice preparation.
Sprague Dawley rats (male) at the age of postnatal day 14 (P14)-P21 were anesthetized with 4% isoflurane and then decapitated. Brains were removed and placed in ice-cold artificial CSF (ACSF) bubbled with 95% CO2/5% O2. Slices 450 μm thick were cut on a Vibratome in a plane to preserve thalamocortical connections, according to the method of Land and Kandler (2002), which is modified from the method of Agmon and Connors (1991) for juvenile rats. Slices were taken through primary somatosensory “barrel” cortex. “Nonconnected” slices were either immediately rostral or caudal to connected slices or were connected slices in which the thalamus was cut away during the dissection. ACSF used during the slicing procedure contained the following (in mm): 252 sucrose, 3 KCl, 2 MgSO4, 1.25 NaH2PO4, 26 NaHCO3, 2 CaCl2, and 10 dextrose. Slices were transferred to a submersion holding chamber containing ACSF composed of the following (in mm): 126 NaCl, 3 KCl, 2 MgSO4, 1.25 NaH2PO4, 26 NaHCO3, 2 CaCl2, and 10 dextrose. Slices were incubated in this holding chamber for 1 h at 32°C and then at room temperature until use. All experiments were approved by the University of Pennsylvania Animal Care and Use Committee.
Voltage-sensitive dye staining.
Slices were stained in a static bath (with 95% CO2/5% O2 flowing in a closed chamber) of ACSF containing 50 μg/ml di-3-ANEPPDHQ (Obaid et al. (2004); licensed to Invitrogen) solubilized in ethanol (0.25% ethanol by volume in the bath) for 10 min. Di-3-ANEPPDHQ was chosen due to its low phototoxicity and low internalization (and thus high signal-to-noise ratio; Obaid et al., 2004). After staining, slices were returned to the holding chamber to remove unbound dye before being transferred to an interface recording chamber.
Electrophysiological and optical recordings.
For electrophysiological and optical recordings, slices were transferred to an interface chamber (BSC1; AutoMate Scientific) heated to 35–36°C. Perfusion ACSF in the recording chamber was modified according to the method of Sanchez-Vives and McCormick (2000) to promote recurrent activity and contained the following (in mm): 126 NaCl, 3.5 KCl, 1 MgSO4, 1.25 NaH2PO4, 26 NaHCO3, 1 CaCl2, and 10 dextrose. Slices were allowed to rest for at least 1 h on the interface chamber in the new medium before any recordings began.
Cells were recorded intracellularly using sharp micropipettes filled with 3 m potassium acetate (tip resistances between 75 and 100 MΩ). Pipettes were pulled using a P-97 Flaming/Brown micropipette puller (Sutter Instruments). Electrodes were advanced blindly using a Sutter MPC-200 controller with MP-285 mechanical manipulators mounted on custom-built bases angled at 50–55°. Recordings were made using a bridge amplifier (IR-283; Cygnus Technology) and digitized at 10 kHz using Spike2 (C.E.D.). Current pulses were timed and controlled using a Master-8 stimulator (A.M.P.I.).
To record extracellular potentials, we manufactured bipolar electrodes using tungsten electrodes with an impedance of 0.1 MΩ at 1 kHz (FHC). One pole was placed in layer 1 and the other in layer 5. Signals were recorded with an AM Systems differential AC amplifier filtered between 0.1 Hz and 5 KHz, and digitized at 10 kHz using Spike2 (C.E.D.). The local field potential (LFP) was obtained with a low-pass filter of 10 Hz; single- (SUA) and multiunit (MUA) activity were obtained with a high-pass filter of 250 Hz.
Optical recordings were made with a modified upright microscope (BX51; Olympus). Epi-illumination was provided by a 12 V halogen lamp driven by a stable power supply (Kepco). Excitation light was band-pass filtered between 480 and550 nm and light emitted from the slice was low-pass filtered at 590 nm. The optical signal was collected with a CCD camera (MiCam02; BrainVision) with a sensor size of 2.9 × 2.1 mm2 and 88 × 60 imageable pixels at frame rate of 1 ms/frame. Light was collected with a 4× objective (numerical aperture = 0.28; Olympus) and passed through a 0.25× demagnifier (U-TVO.25XC; Olympus) before reaching the camera, resulting in a pixel size of ∼33 μm2. Optical recording was controlled with MiCam software. All data were collected as single trials with no online processing of dF/F signals. The total recording time for each trial was 1028 ms.
Pharmacology and drug application.
Acetylcholine (ACh; Sigma Aldrich) was stored as a concentrated stock in water at 4°C and protected from light. ACh was added to ACSF made fresh before each experiment.
Electrical stimulation protocol.
To deliver electrical stimuli, we manufactured bipolar electrodes using tungsten electrodes with an impedance of 0.1 MΩ at 1 kHz (FHC). Stimuli consisted of single 100 μs pulses of 80 μA intensity in ventrobasal (VB) thalamus or white matter and 2–6 μA in cortex. Stimulation intensity and duration were controlled with custom routines written in Igor (WaveMetrics) using NI-DAQmx Tools (National Instruments). Command voltages generated from these routines were output via a BNC-2090 (National Instruments) to a Grass Instruments stimulus isolation unit for final current output through the bipolar electrodes.
Electrical stimuli to trigger up-states were performed after measurements were made of up-state frequency and duration, and stimulation times after wash-in of ACh were not different for the 1 mm or 100 μm conditions (556 ± 42 vs 620 ± 37 s; p = 0.29). In the case of 100 μm ACh, the spontaneous up-state frequency slowed over time, which allowed up-states to be evoked without interference from those occurring spontaneously. Up-state frequency was still elevated relative to control before thalamic stimulation (frequency 500 s after wash-in: control = 0.06 ± 0.01 Hz; ACh = 0.20 ± 0.05 Hz; n = 8, p < 0.05). Stimuli were delivered 100 ms after the camera shutter opened and optical recording had begun to provide a baseline for the voltage-sensitive dye (VSD) signal before the stimulation. A set of 20–25 imaging trials was acquired, with 10 s between each trial. Tissue health was assessed by the continued presence of spontaneous or evoked up-states in intracellular recordings or LFPs (or return after washout) and by the ability to evoke up-states that reached peak dF/F amplitudes and durations similar to those recorded at the beginning of the experiment after washout.
Image processing.
Optical data consisted of differential fluorescence divided by a reference image acquired automatically by the MiCam software at the beginning of each trial (dF/F). Individual trials from VSD videos were inspected separately to choose trials for averaging. Trials were screened by inspecting a region of interest (ROI) from the middle of the imaged tissue. Only trials with a stable baseline (the period of 100 ms before stimulation) in which an up-state occurred were chosen for averaging.
Once trials were averaged, the resulting video was postprocessed using the following steps in order. Optical data were debleached by taking a small ROI (3–5 pixels) from white matter near the internal capsule, which was smoothed by a binomial smoothing operation (a Gaussian filter, smooth factor of 50), and then subtracting this signal from the data. A 3 × 3 spatial filter was then applied to the data. Next, for each pixel, the signal was “zeroed” around the baseline through time according to the 100 ms preceding stimulation: an offset was calculated that made the average of dF/F values positive to zero during this time window match the average of dF/F values negative to zero. This offset was calculated for and applied to each pixel individually through time (every frame) to normalize all jitter around baseline across the entire image. Finally, a binomial smoothing operation (smooth factor of 10) was applied to the data to minimize high-frequency and high-amplitude noise peaks.
After postprocessing, the baseline noise was quantified as described previously (Civillico and Contreras, 2005, 2006). In brief, we calculated the SD at each pixel during the 100 ms before the stimulation, plotted the distribution of SDs (which was always unimodal), and chose the peak, which represents the most common SD over the image. Thresholds for signal above baseline noise were set according to this peak and pseudocolor images have a threshold of 3 SDs. The pseudocolor images were superimposed on a grayscale representation of the reference image. Pixels located off the edge of the tissue (including pia) were deleted or blanked for clarity. Finally, Di-3-ANEPPDHQ reports membrane depolarization as a decrease in emitted fluorescence. For clarity and in keeping with convention, we depicted depolarization as a positive change in traces for ROI analyses and warm colors in pseudocolored images in all figures.
Data analysis.
Up-state frequency and average duration measurements were taken from 200 s time-windows: (1) before ACh wash-in, (2) 300 s after switching to ACh medium, and (3) after at least 15 min of washout. In the Results, average values for duration are population means.
ROIs represent the average dF/F signal of the selected area as a function of time. Placement of ROIs was based on measured depth from the surface of the slice and by the layering apparent in the reference image, in the dF/F signals during up-states, and under light microscopy. Peak maps display the peak dF/F amplitude recorded at each pixel from the time of stimulation until the end of the video.
To quantify changes in up-state propagation, we measured the percent area of the imaged cortex reaching a threshold value above baseline noise as a function of time (see Fig. 2B). A polygon was drawn over the imaged area of the cortex and the percentage of pixels under this polygon reaching a set threshold (here, 3 or 7 SDs) was measured every 10 s over the duration of the video.
Figure 2.
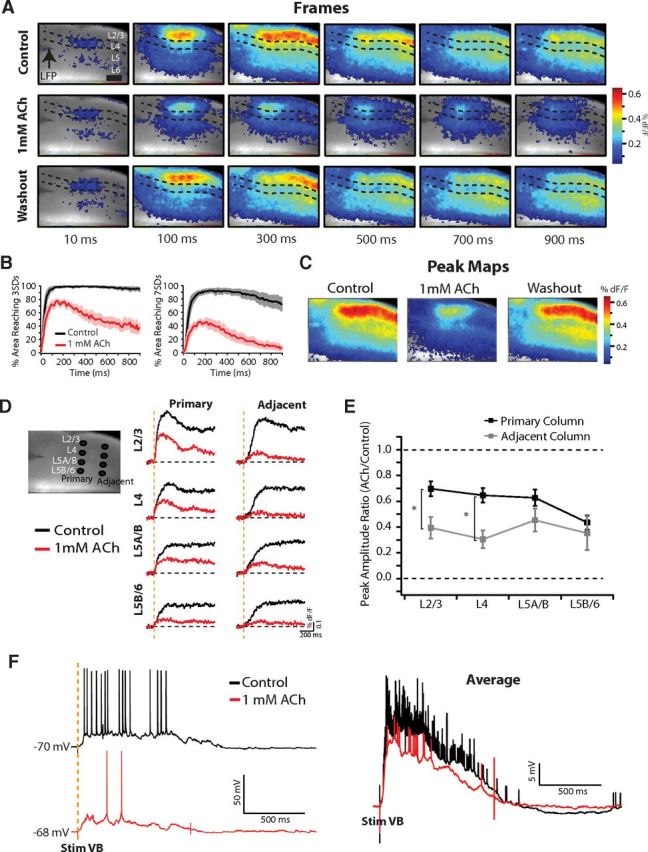
1 mm ACh reduces the spatial spread, duration, and amplitude of up-states. A, VSD movie frames. Dashed lines bracket L4 and the approximate locations of the layers are labeled. Times are after stimulation of VB thalamus. In control medium (top), monosynaptic responses in L4/6 are followed by initiation of an up-state that propagates across the cortex. In 1 mm ACh, the monosynaptic responses are preserved but the up-state does not propagate as far and the dF/F amplitudes are smaller. Washout (bottom) returns the response to control. Scale bar, 500 μm. B, Population quantification (n = 6 slices) of up-state propagation triggered by VB stimulation before (black) and after (red) wash-in of 1 mm ACh. The percentage area of the image reaching 2 thresholds above baseline noise (3 SDs at left, and 7 SDs at right) as a function of time is shown. 1 mm ACh limits the spatial propagation of triggered up-states. C, Peak maps for the slice in A, representing the largest amplitude dF/F signal recorded for each pixel over the duration of the imaging time. D, ROI analysis of up-state amplitudes by layer for two vertical columns. Left, Black circles mark the locations of the ROIs (L2/3, L4, L5A/B, L5B/6), for two columns (primary and adjacent) over a reference image of the slice in A. Right, dF/F signals recorded at each ROI. Note the large reduction in the amplitudes of the signals after 1 mm ACh at each ROI. E, Ratio of the peak dF/F signal between 1 mm ACh and control medium for the population (n = 6 slices). Values <1 signify a reduction in the dF/F amplitude after ACh wash-in. The ratios for all ROIs were significantly <1 (p < 0.01). Reductions in peak dF/F amplitude in L2/3 and L4 in the adjacent column were significantly greater than L2/3 and L4 in the primary column. *p < 0.05 (t test). F, Intracellular recording in L2/3 from a different thalamocortical connected slice. Left, Single trial examples of VB triggered up-state before (black) and after (red) wash-in of 1 mm ACh. Right, Averages of 20 stimulation trials. ACh reduced the number of spikes and level of depolarization during triggered up-states.
To quantify the effect of ACh observed in optical recordings across experiments, we calculated how signals recorded at ROIs changed as a percentage of control conditions after ACh bath application within each experiment. We determined placement of the ROIs by cortical layer in the VSD reference image as described in Wester and Contreras (2012). The time to peak dF/F was recorded and the signal was averaged over a time window of 100 ms centered at this time. We took the ratio of this measurement for the post-ACh signal to the pre-ACh signal as our measure of percentage change from control. If the difference between the post-ACh and pre-ACh measurements was not >2 SDs above baseline noise, the ratio was forced to a value of 1, indicating no statistically significant difference between the signals.
Up-state frequency and duration were determined algorithmically in low-pass-filtered (10 Hz) LFP recordings or intracellular recordings (with spikes cut). A baseline and threshold voltage to detect an up-state was set by visual inspection. Once detected, up-state duration was determined from baseline to baseline as follows. The start was defined as the first point at baseline before crossing threshold. The end was defined as the point at which baseline was crossed but threshold was not recrossed for at least 350 ms. The accuracy of these measurements was confirmed by visual inspection and corrections were made where necessary by comparing multiunit activity to the LFP (in cases of occasional spurious noise in the LFP). Finally, we measured the spike rate per up-state (spontaneous or triggered) from intracellular recordings during 100 s time windows.
All analyses were performed using custom routines written for Igor (WaveMetrics). Comparisons between groups were performed with a t test unless variances were unequal, in which case a Wilcoxon rank test was used. Comparisons against a value of 1 (for normalized ratio data) were performed with a Student's t test. A one-way ANOVA was used to test for differences among control, ACh, and washout; a Tukey Test was used for post hoc analysis. Quantifications are reported as means ± SEM.
Results
Our goal was to test the hypothesis that different concentrations of ACh switch the cortical network state from one in which most activity is generated within local cortical circuits to one in which cortical activity depends on afferent input. Previously, Kuczewski et al. (2005) found (in the absence of acetylcholinesterase inhibitors) that bath-applied ACh in the 20–500 μm range facilitated cortical synaptic transmission, whereas 1 mm ACh caused depression, as observed with muscarinic ACh receptor agonists (even at submicromolar levels; Hasselmo and Bower, 1992; Gil et al., 1997). Synaptic facilitation at lower concentrations occurred due to the recruitment of either M2 or M4 muscarinic ACh receptors (mAChRs), whereas depression at higher concentrations involved the combined recruitment of M1 and M4 mAChRs (Kuczewski et al., 2005). We used spontaneous up- and down-states occurring in slices of rat barrel cortex as an indicator of cortical network excitability because, in vitro, this oscillation is generated by local recurrent cortical network activity and not as a direct response to stimulation. We bath applied ACh at concentrations of 10 μm, 100 μm, or 1 mm and found a concentration-dependent effect on both spontaneous and evoked recurrent cortical network activity in thalamocortical slices. Furthermore, in 1 mm ACh, modulation of spontaneous network activity was dependent on the presence of intact thalamocortical connections.
High ACh (1 mm) increases the frequency but reduces the duration of spontaneous up-states in thalamocortical connected slices
Up-states appear in LFPs as negative deflections and are associated with MUA (Fig. 1A). In the example thalamocortical connected slice shown in Figure 1, spontaneous up-states recorded in LFPs (gray traces) and MUA from L5 (black traces) occurred rhythmically in control with a frequency of 0.08 Hz (Fig. 1A, top). L5 MUA occurred during up-states, but, as reported previously by Sanchez-Vives and McCormick (2000), L5 single-units were commonly observed firing tonically throughout the down-state (see Figs. 1, 3, 6, 8). Bath application of 1 mm ACh (Fig. 1A, middle) had a dramatic effect on the spontaneously occurring up-states and neuron firing: it almost doubled the frequency of up-states (control = 0.08 Hz; ACh = 0.14 Hz) and reduced their mean duration by half (control = 0.9 ± 0.06 s; ACh = 0.45 ± 0.03 s; short up-states indicated by asterisks), as measured from the LFP. ACh completely eliminated long-duration up-states, because the maximum duration was also reduced by half (control = 1.45 s; ACh = 0.68 s).
Figure 1.
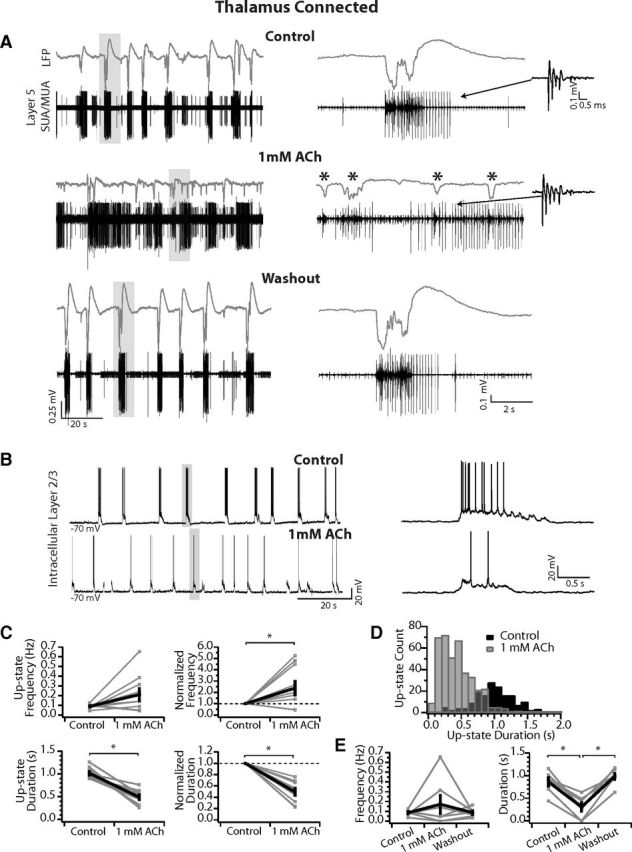
1 mm ACh increases up-state frequency in thalamocortical connected slices but decreases up-state duration. A, LFP (gray) and SUA/MUA in L5 (black) in a thalamocortical connected slice. Top, Up-states occurred rhythmically in control medium. Expansion of an up-state (right) shows a long duration (>1 s) network event. Inset is of an isolated single-unit of an IB neuron that fired in a correlated manner with each up-state. Middle, In 1 mm ACh, up-states occurred more frequently but were much shorter in duration. An expanded time window at right shows four short-duration network events (asterisks). Inset is of the same unit identified in control medium. Note that the firing is no longer correlated with network events. Bottom, After washout, the network state and single-unit firing returned to control conditions. Gray boxes indicates areas expanded at right. B, Spontaneous up-states recorded in a L2/3 neuron in a thalamocortical connected slice in control medium (top) and in 1 mm ACh (bottom). Up-states occur more frequently in ACh but are reduced in duration. Gray boxes indicate example up-states expanded at right. Right, Expansion of two example up-states in control medium (top) and 1 mm ACh (bottom), highlighting the reduction in firing rate. C, Average up-state frequency increases but average duration is reduced. Top, Average up-state frequency (left) and average change in up-state frequency normalized to control within each slice (right). Bottom, Average up-state duration (left) and average change in up-state duration normalized to control within each slice (right). n = 10 slices. Gray, individual slices; black, population mean ± SEM. *p < 0.05. D, Distribution of up-state durations in 100 ms time-bins (same n = 10 slices). In 1 mm ACh, the distribution is shifted such that the long-duration up-states observed in control medium are rare or do not occur. E, Up-state frequency and duration return to control after washout. n = 7 slices. Gray, individual slices; black, population mean ± SEM. *p < 0.01 (Tukey post hoc test).
Figure 3.
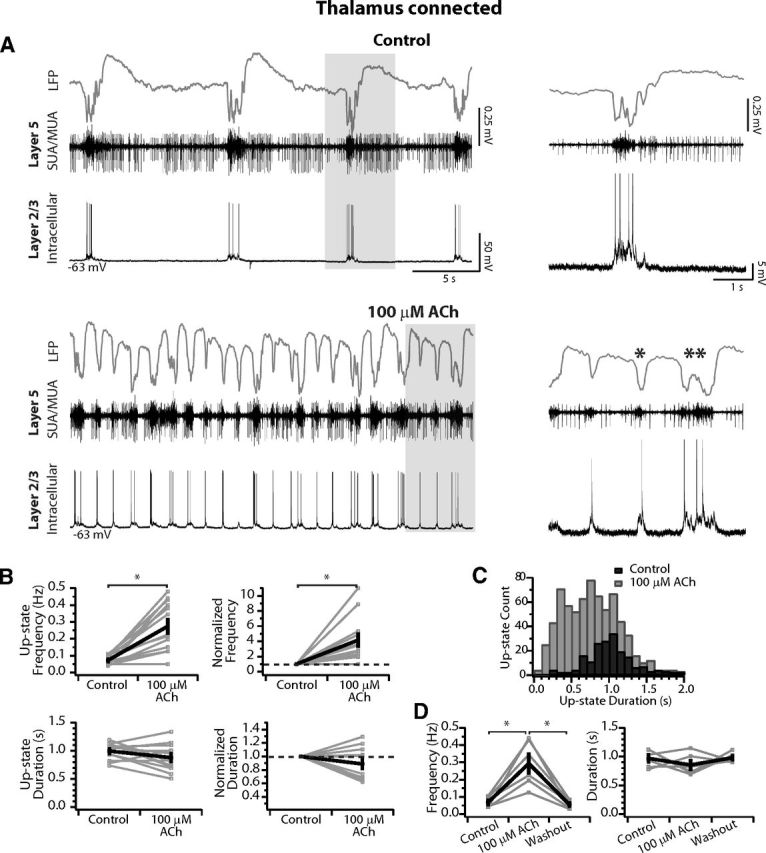
100 μm ACh increases cortical excitability. A, Simultaneous LFP (gray), SUA/MUA in L5 (black), and intracellular recording in L2/3 (black bottom) vertically aligned within a thalamocortical connected slice. Top, Slice in control medium. Bottom, After wash-in of 100 μm ACh, up-state frequency is increased but the duration of up-states is not limited. Single asterisk highlights a short duration up-state and the double asterisk indicates an up-state of control duration and amplitude (compare with example in control medium above). Note the synchrony of the up-states among the recordings in both conditions. Gray boxes indicate areas expanded at right. For the expansions at right, spikes are cut in the intracellular recording to focus on the level of depolarization achieved before and after ACh. B, Average up-state frequency increases but average duration is not changed. Top, Average up-state frequency (left) and average change in up-state frequency normalized to control within each slice (right). Bottom, Average up-state duration (left) and average change in up-state duration normalized to control within each slice (right). n = 13 slices. Gray, individual slices; black, population mean ± SEM. *p < 0.05. C, Distribution of up-state durations in 100 ms time-bins. In 100 μm ACh, up-states are a mixture of short duration events and those that are similar to control, so this concentration does not limit the absolute duration as observed for 1 mm. D, Up-state frequency and duration return to control after washout. n = 6 slices. Gray, individual slices; black, population mean ± SEM. *p < 0.01 (Tukey post hoc test).
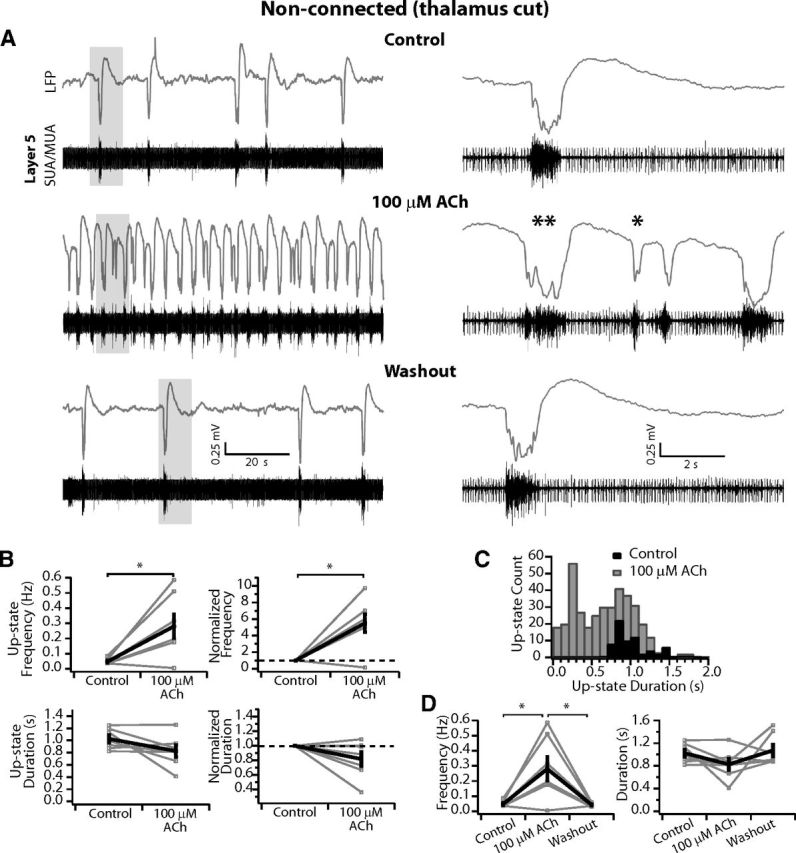
Figure 6.
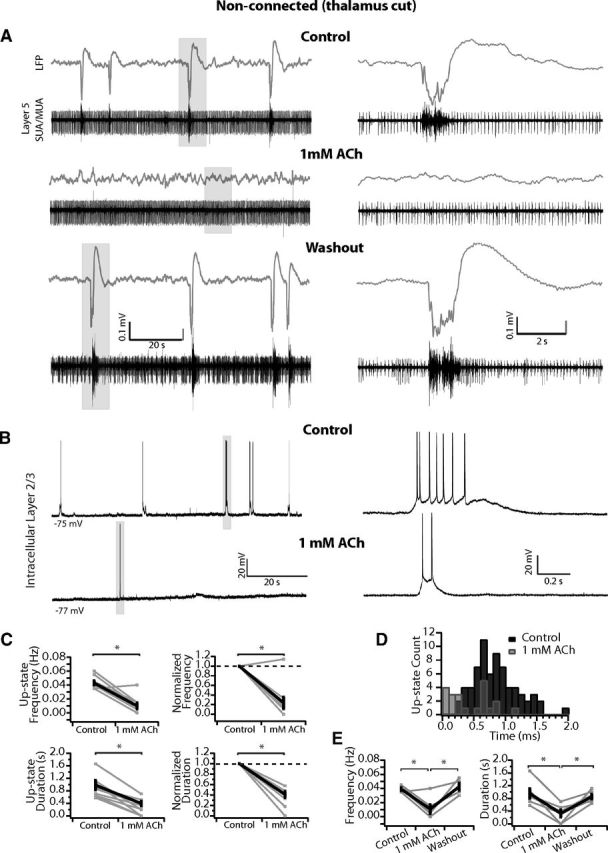
In nonconnected slices, 1 mm ACh greatly reduces or abolishes spontaneous up-states. A, Example nonconnected slice with LFP (gray) and SUA/MUA in L5 (black). The slow oscillation disappears in 1 mm ACh but returns after 20 min of washout. B, Second example nonconnected slice with an intracellular recording in L2/3. Spontaneous up-states are largely absent after 1 mm ACh wash-in. Rarely, short-duration up-states occurred spontaneously (gray box indicates expanded example at right). C, Population quantification of spontaneous network activity in nonconnected slices before and after 1 mm ACh. Average up-state frequency and duration are both reduced. Top, Average up-state frequency (left) and average change in up-state frequency normalized to control within each slice (right). Bottom, Average up-state duration (left) and average change in up-state duration normalized to control within each slice (right). n = 9 slices. Gray, individual slices; black, population mean ± SEM. Population mean for duration includes only slices that produced up-states in ACh (n = 6). *p < 0.01. D, Distribution of up-state durations in 100 ms time bins. In 1 mm ACh, the distribution is shifted such that the long-duration up-states observed in control medium are rare or do not occur. E, Up-state frequency and duration return to control after washout. n = 6 slices. Gray, individual slices; black, population mean ± SEM. *p < 0.05 (Tukey post hoc test).
Figure 8.
100 μm ACh increases cortical network activity in nonconnected slices in a manner comparable to connected slices. A, LFP (gray) and SUA/MUA in L5 (black) of spontaneous activity in a nonconnected slice. Top, Slice in control medium. Middle, After wash-in of 100 μm ACh, up-state frequency is increased but the duration of up-states is not limited, similar to that observed in thalamocortically connected slices. Single asterisk highlights a short duration up-state and the double asterisks indicate an up-state of control duration (compare with example in control medium above). Bottom, After washout, the network state returns to control conditions. Gray boxes indicate areas expanded at right. B, Average up-state frequency increases but average duration is not changed. Top, Average up-state frequency (left) and average change in up-state frequency normalized to control within each slice (right). *p < 0.05. Bottom, Average up-state duration (left) and average change in up-state duration normalized to control within each slice (right). n = 7 slices. Gray, individual slices; black, population mean ± SEM. C, Distribution of up-state durations in 100 ms time bins. There are two peaks in the distribution with 100 μm ACh, because up-states are a mixture of short-duration events and those that are similar to control. D, Up-state frequency and duration return to control after washout. n = 7 slices. Gray, individual slices; black, population mean ± SEM. *p < 0.01 (Tukey post hoc test).
Furthermore, an intrinsically bursting (IB) neuron, defined by its characteristic spike burst with strong sodium inactivation (shown in the inset at right, indicated by arrow in Fig. 1A, middle), fired concurrently with each up-state in control medium but fired tonically and no longer correlated with network events in ACh. In 13/38 slices, a clear single unit was identified in L5 that produced tonic firing in the presence of ACh (regardless of concentration between 1 mm and 100 μm), and 11/13 of these units were classified as IB cells (6/8 of the units returned to baseline conditions after washout). Therefore, L5 IB neurons are strongly excited by ACh, which decouples them from the ongoing network events. Finally, washout returned up-state parameters to control values (frequency = 0.07 Hz; duration = 1.13 ± 0.05 s), and the IB single-unit returned to firing that correlated with up-states (Fig. 1A, bottom).
The changes in spontaneous up-state frequency and duration were also observed in intracellular recordings from L2/3 (Fig. 1B) and further revealed a reduction in depolarization and average firing rate per up-state (from 8.23 ± 0.7 to 2.12 ± 0.25 Hz in this example cell). In L2/3, ACh significantly reduced mean up-state firing rates to 0.34 ± 0.2 of control (n = 4 neurons in 4 slices; p < 0.05), but did not change the resting Vm or the input resistance of L2/3 (n = 5) or L4 neurons (n = 2; mean change from control: 1.85 ± 4.3 MΩ; n = 7). Therefore, the effect of ACh in these superficial neurons was limited to reductions in excitatory drive from within the local network without changes in their biophysical properties. These data are in agreement with previous studies in which cholinergic modulation had only subtle effects on the membrane potential of L2/3 pyramidal neurons in vitro (Gulledge et al., 2009).
Across a population of thalamocortical connected slices (n = 13; measurements pooled from LFP [n = 11] and intracellular recording [n = 2]), spontaneous up-state frequency increased in 7/13 slices, decreased in 3/13 slices, and was abolished in 3/13 slices in 1 mm ACh. In the 10/13 slices in which up-states were still observed, the average up-state frequency had a tendency to increase from 0.09 ± 0.01 to 0.21 ± 0.06 Hz (p = 0.07), but the average up-state duration was significantly decreased (control = 1.02 ± 0.04; ACh = 0.49 ± 0.05 s; p < 0.001; Fig. 1C, left). When measurements were normalized to control within each slice, the average up-state frequency doubled (2.38 ± 0.59; p < 0.05), whereas the average up-state duration decreased by half (0.49 ± 0.06; p < 0.001; Fig. 1C, right). ACh caused a loss of long duration up-states, resulting in a shift in the distribution of up-state durations relative to control (Fig. 1D). Therefore, in thalamocortical connected slices, high ACh could increase the overall network excitability yet always dampened individual network events. In the 3/13 slices in which ACh abolished spontaneous up-states, we hypothesize that connections to cell bodies in the thalamus were severed, in agreement with data from nonconnected slices presented below.
Finally, in a subset of slices (n = 7), we washed out ACh, which returned up-state frequency and duration to control values (Fig. 1E). Although the mean frequency was not different among the control, ACh, and washout groups (one-way ANOVA: F(2,18) = 0.87, p = 0.44), the mean up-state duration before and after washout were both significantly greater than during 1 mm ACh but were not different from each other (one-way ANOVA: F(2,18) = 18.96, p < 0.001; Tukey test: control vs 1 mm ACh: 0.86 ± 0.09 vs 0.31 ± 0.09, p < 0.001; washout vs 1 mm ACh: 0.98 ± 0.09 vs 0.31 ± 0.09, p < 0.001; control vs washout: p = 0.58; Fig. 1E).
Although the up-state amplitude measured from the LFP is clearly decreased in the example shown in Figure 1A, this effect was observed in some but not all slices and the mean maximum spontaneous up-state amplitude was not different across the population (control: −0.53 ± 0.1 mV vs 1 mm ACh: −0.46 ± 0.1 mV; p = 0.35, n = 8). The reduced amplitude in Figure 1A is likely due to the location of the LFP relative to the site of spontaneous up-state initiation. In this example, the LFP was adjacent to the thalamocortical connected barrels (see LFP location in Fig. 2A, same slice as Fig. 1A), and up-state amplitude in 1 mm ACh was likely reduced due to limited propagation, as described below. Importantly, up-state duration was reduced in all slices (Fig. 1C) regardless of the effect on up-state amplitude.
High-concentration ACh (1 mm) limits the spatial propagation, duration, and amplitude of recurrent activity triggered by thalamic input
We used voltage-sensitive dye (VSD) imaging to determine whether the changes in frequency and duration described above were associated with changes in the spatiotemporal properties of up-states. To average across trials to obtain a high signal-to-noise ratio of the fluorescent signal (dF/F), we measured the spatial and temporal propagation of cortical network responses triggered by thalamic stimulation. As described extensively in our previous work (Wester and Contreras (2012); see also Laaris et al. (2000)), a brief (100 μs) electrical stimulus (80 μA) to VB thalamus resulted in monosynaptic responses in layers 4 (L4) and 6 (L6), followed by initiation of an up-state that propagated horizontally across the entire imaged area of the slice (Fig. 2A, top). Bath application of 1 mm ACh did not change monosynaptic responses, but reduced the spatial extent of up-state propagation from the site of initiation and the amplitude of the fluorescent signal (Fig. 2A, middle). Response parameters returned to control values after washout (Fig. 2A, bottom).
To quantify the change in activation pattern, we measured the percent area of the imaged cortex reaching two arbitrary threshold values of dF/F above baseline noise as a function of time: an inclusive low threshold of 3 SDs to capture all changes from baseline membrane potential and a higher threshold of 7 SDs to capture only stronger depolarization during up-states. For the population (n = 6 slices), after thalamic stimulation, 98 ± 0.9% of the imaged area reached 3 SDs within 150 ms with no decrement for the remainder of the imaging in control medium (Fig. 1B, left, black trace). In contrast, in ACh, only 78 ± 4% of the imaged area reached 3 SDs at 150 ms and contracted back to 37 ± 7% by 900 ms (Fig. 2B, left, red trace). An even larger difference was observed at the higher threshold of 7 SDs (Fig. 2B, right; control = 89 ± 3% at 150 ms with minimal decay; ACh = 46 ± 4% at 150 ms and 7 ± 4% at 900 ms).
The reduced spatial spread and signal amplitude of the example slice shown in Figure 2A were dramatically illustrated in peak maps, which represent the maximum value reached by each pixel during the entire recording (Fig. 2C). We note that although the dF/F signal appears largest in L2/3, this is most likely due to the contribution of L5 apical dendrites to the signal originating from this layer. As described previously, evoked up-states require the participation of L5 (Wester and Contreras, 2012) and spontaneous up-states also start in this layer (Sanchez-Vives and McCormick, 2000). To quantify amplitude changes we measured the dF/F from 4 small (∼5 pixels in diameter) ROIs in 2 columns aligned vertically to the pia: a “primary” column in which an up-state was initiated and an “adjacent” column (500 μm away) to which the up-state propagated (Fig. 2D). The layer nomenclature for each ROI is as described previously in Wester and Contreras (2012). For the example experiment (same slice as that in Fig. 2A,C), ACh caused a clear reduction in dF/F signal amplitude from all ROIs in both the primary and adjacent columns (red traces). To obtain population measures, we calculated the ratio of the peak dF/F between ACh and control for each ROI (n = 6 slices; Fig. 2E). ACh caused a significant reduction in dF/F amplitude from control in both the primary column (L2/3 = 0.70 ± 0.06, L4 = 0.64 ± 0.06, L5A/B = 0.63 ± 0.06, L5B/6 = 0.43 ± 0.06; all different from 1, p < 0.01) and the adjacent column (L2/3 = 0.39 ± 0.08, L4 = 0.30 ± 0.07, L5A/B = 0.45 ± 0.09, L5B/6 = 0.35 ± 0.13; all different from 1, p < 0.001). Furthermore, the reductions in dF/F amplitude in L2/3 and L4 of the adjacent column were significantly greater than in the primary column (p < 0.05 for both; Fig. 2E, asterisks). Therefore, with high ACh (1 mm), depolarization is reduced at the site of initiation of the evoked up-state and in regions to which it propagates. Finally, 1 mm ACh also reduced the propagation velocity of the VSD signal (7 SDs above baseline noise) between the primary and adjacent column ROIs in L2/3. In control medium, the signal propagated at 21.2 ± 4.6 mm/s but was significantly reduced to 11.4 ± 3.0 mm/s in 1 mm ACh (p < 0.05, n = 5).
In addition to reductions in optical signal amplitude, intracellular recordings revealed that ACh reduced depolarization and spiking during up-states triggered with thalamic input (similar to that observed for spontaneous up-states above). In the example L2/3 cell, this reduction was clear in a single trial (Fig. 2F, left) and was very robust across 20 trials, as shown in the average (Fig. 2F, right). Therefore, the reduction in duration of spontaneous up-states shown above is concomitant with a reduction in the spatial propagation and amplitude of evoked up-states.
Low-concentration ACh (100 μm) increases cortically generated recurrent activity
The reduction in up-state depolarization and duration shown above may be attributed to muscarinic-receptor-dependent intracortical synaptic depression (Hasselmo and Bower, 1992; Gil et al., 1997). However, Kuczewski et al. (2005) demonstrated that bath concentrations of 20–500 μm ACh resulted in synaptic facilitation rather than depression. Therefore, we tested the hypothesis that 100 μm ACh would increase up-state frequency without limiting the duration or spatial spread of recurrent intracortical activity. In the example shown in Figure 3, up-states occurred synchronously among the LFP (gray trace), L5 multiunit activity (black trace), and a simultaneously recorded L2/3 cell vertically aligned in the column with the extracellular electrode. In agreement with data in vivo (Contreras and Steriade, 1995), the negative waves in the LFP corresponded with the L2/3 cell depolarization and positive waves corresponded with hyperpolarization. In this slice, up-states occurred in control medium with a frequency of 0.11 Hz and had an average duration of 1.12 ± 0.03 s, as measured from the LFP (Fig. 3A, top). After bath application of 100 μm ACh, the frequency of up-states increased dramatically to 0.43 Hz while remaining synchronous between the LFP and L2/3 cell (Fig. 3A, bottom). Spontaneous network activity consisted of short-lasting up-states (Fig. 3A, bottom right, single asterisks) interspersed among up-states of control duration (Fig. 3A bottom right, double asterisks). Indeed, the maximum up-state duration was 1.4 s in control medium and 1.3 s in ACh, whereas the minimum duration in control medium was 0.9 s compared with 0.2 s in ACh. This indicates that 100 μm ACh does not limit the duration of network events, as observed at 1 mm; rather, short duration up-states most likely occur due to initiation in spatial and temporal proximity to the refractory period of a preceding up-state (Civillico and Contreras, 2012). Finally, the depolarization amplitude during up-states in the simultaneously recorded L2/3 neuron was comparable to control (compare details in Fig. 3A, right).
Across the population of thalamocortical connected slices (n = 13), 100 μm ACh increased the average up-state frequency recorded in the LFP from 0.07 ± 0.01 to 0.27 ± 0.04 Hz (p < 0.001; Fig. 3B, top left), which corresponds to a mean increase of 4.15 ± 0.8× when normalize to control within slices (difference from 1, p < 0.01; Fig. 3B, top right). The average duration of up-states in 100 μm ACh was not different from control (control = 1.00 ± 0.04 s vs ACh = 0.88 ± 0.07 s; p = 0.09; Fig. 3B, bottom left), nor when normalized within slices (mean ratio = 0.89 ± 0.06; p = 0.11; Fig. 3B, bottom right). The distribution of up-state durations across the population (Fig. 3C) showed a single peak centered around 1 s in control medium (black bars), whereas in ACh, up-states of this duration were as common as those observed between 300 and 500 ms (gray bars). Therefore, at a concentration of 100 μm, ACh did not limit the duration of up-states with respect to control medium, as observed at 1 mm. Finally, in a subset of slices (n = 6), ACh was washed out and values returned to control (Fig. 3D). As above, population mean of up-state duration was not significantly different among control, 100 μm, and washout (one-way ANOVA: F(2,15) = 1.4, p = 0.27), however, the mean up-state frequency before and after washout were both significantly reduced compared with 1 mm ACh but were not different from each other (one-way ANOVA: F(2,15) = 17.36, p < 0.001; Tukey post hoc: control vs 1 mm ACh: 0.07 ± 0.01 vs 0.29 ± 0.05, p < 0.001; washout vs 1 mm ACh: 0.06 ± 0.01 vs 0.29 ± 0.05, p < 0.001; control vs washout: p = 0.95; Fig. 3D).
Because the duration of spontaneous up-states was not limited, we reasoned that the spatiotemporal properties of thalamically triggered up-states measured using VSDs should not be different from control. As with the high ACh, we measured evoked up-states ∼500 s after wash-in (see Materials and Methods). Thalamic stimulation triggered up-states that were not qualitatively different in control medium (Fig. 4A, top row), after bath application of ACh (Fig. 4A, middle row), or after washout (Fig. 4A, bottom row). We measured the percent area of the imaged cortex reaching two different threshold values above baseline noise as a function of time as above and found propagation in ACh to be comparable to control for both (n = 5; Fig. 4B). Comparable peak dF/F amplitudes across conditions are clearly demonstrated in peak maps (compare Figs. 4C, 2C). Furthermore, the propagation velocity (measured as above for 1 mm ACh) was not affected (control medium: 17.0 ± 4.2 mm/s vs 100 μm ACh: 15.4 ± 3.4 mm/s; p = 0.48, n = 5). Finally, the evoked field potential was also of comparable duration after wash-in of ACh (Fig. 4D, same slice as Fig. 4A,C). Therefore, in contrast to 1 mm, the lower concentration of 100 μm ACh does not limit the duration of spontaneous or evoked up-states that successfully propagate across the entire slice.
Figure 4.

100 μm ACh does not change the spatial spread, duration, or amplitude of up-states. A, VSD movie frames in control medium (top), after wash-in of 100 μm ACh (middle), and after washout (bottom). Dashed lines bracket L4 and the approximate locations of the layers are labeled. Times are after stimulation of VB thalamus. In 100 μm ACh, up-state propagation and amplitude are similar to control and washout. Scale bar, 500 μm. B, Population quantification of up-state propagation triggered by thalamic stimulation as a function of time before (black) and after (red) wash-in of 100 μm ACh for the population (n = 5 slices). The percentage area of the image reaching two thresholds above baseline noise (3 SDs at left and 7 SDs at right) as a function of time is shown. 100 μm ACh does not limit or change spatial propagation. C, VSD peak maps from the slice in A demonstrating that the up-states reach similar dF/F amplitudes across the slice in 100 μm ACh relative to control and after washout. D, LFP of up-states triggered by thalamic stimulation in control medium (black) and after wash-in of 100 μm ACh (red) for the same slice as in A and D. The duration of evoked up-states is not reduced after ACh wash-in. Greater than 10 trials were averaged for each condition; data are shown as mean (solid line) ± SEM.
Thalamocortical connections are necessary to observe increased up-state frequency in high-concentration (1 mm) ACh
Previously, Gil et al. (1997) found that activation of nicotinic AChRs selectively facilitates thalamocortical but not corticocortical synapses. We tested the hypothesis that the source of increased cortical activity in thalamocortical connected slices is mediated by the presence of intact thalamocortical connections, which are enhanced by ACh. We first investigated whether the thalamus plays a role in setting the frequency or duration of spontaneous up-states in control medium. In a large population of slices (n = 46), the up-state frequency was significantly higher in connected (n = 24) versus nonconnected (n = 22) slices (0.08 ± 0.005 vs 0.05 ± 0.005 Hz; p < 0.001; Fig. 5A). Importantly, the average up-state duration was not different, indicating that the health of cortical networks was similar between these two groups (0.99 ± 0.03 s vs 0.93 ± 0.05 s; p = 0.09, Wilcoxon rank test; Fig. 5B). Therefore, intact thalamocortical inputs in rat barrel cortex slices contribute importantly to spontaneous up-state frequency in control medium, in agreement with findings in mouse thalamocortical connected slices (Rigas and Castro-Alamancos, 2007).
Figure 5.

Intact thalamocortical connections increase spontaneous up-state frequency in slices that generate a slow oscillation. A, Average spontaneous up-state frequency is increased in thalamocortical connected slices (n = 24) relative to nonconnected slices (n = 22). Gray, individual slices (separated along the x-axis when overlapping for clarity); black, population mean ± SEM. *p < 0.001 (t test). B, Average spontaneous up-state duration is not different in thalamocortical connected (n = 24) relative to nonconnected (n = 22) slices. Gray, individual slices; black, population mean ± SEM. *p = 0.09 (Wilcoxon rank test).
In all slices in which connections to VB thalamus were severed (see Materials and Methods), 1 mm ACh dramatically reduced or even abolished spontaneous up-states. In the example experiment shown in Figure 6A, the thalamus was cut away during the slicing procedure. Spontaneous up-states occurred with a frequency of 0.04 Hz in control medium (Fig. 6A, top), were abolished in 1 mm ACh (Fig. 6A, middle), and returned after washout (Fig. 6A, bottom). In a second example slice taken immediately rostral to those with intact thalamocortical connections, an intracellular recording in L2/3 also revealed the suppression of spontaneous up-states by 1 mm ACh (Fig. 6B). In this slice, spontaneous up-states of short duration occurred only rarely (see example in Fig. 6B, right).
Across the population of nonconnected slices (n = 9), up-state frequency was greatly reduced (5/9 slices), abolished (3/9 slices), or unchanged (1/9 slices) in 1 mm ACh. Up-state frequency decreased from an average of 0.04 ± 0.003 to 0.01 ± 0.004 Hz (n = 9, p < 0.001) and average up-state duration decreased from 0.98 ± 0.15 to 0.39 ± 0.08 s (population mean of duration excludes slices in which up-states were abolished; n = 6, p < 0.01; Fig. 6C, left). When normalized to control within each slice, up-state frequency and duration decreased significantly (0.24 ± 0.12 and 0.41 ± 0.06 of control, respectively; both p < 0.001; Fig. 6C, right). The distribution of up-state durations revealed a shift toward shorter durations as above for thalamocortical connected slices (Fig. 6D). Finally, in a subset of slices (n = 6), we washed out the ACh. Mean up-state frequency and duration were both significantly reduced during 1 mm ACh but returned to control values after washout (Fig. 6E; frequency, one-way ANOVA: F(2,15) = 14.43, p < 0.01; Tukey post hoc: control vs 1 mm ACh: 0.04 ± 0.002 vs 0.01 ± 0.06, p < 0.01; washout vs 1 mm ACh: 0.04 ± 0.005 vs 0.01 ± 0.06, p < 0.001; control vs washout: p = 0.87; duration, one-way ANOVA: F(2,15) = 7.98, p < 0.01; Tukey post hoc: control vs 1 mm ACh: 0.96 ± 0.16 vs 0.32 ± 0.11, p < 0.01; washout vs 1 mm ACh: 0.85 ± 0.081 vs 0.32 ± 0.11, p < 0.05; control vs washout: p = 0.82). Therefore, we conclude that in high-concentration ACh (1 mm), afferent input (here the thalamus) is necessary to trigger up-states, which are nevertheless shorter in duration.
To confirm that the cortical circuits were still capable of generating up-states even if they ceased to occur spontaneously, we stimulated the white matter below the LFP recording site (Fig. 7A; same slice as shown in Fig. 6A). In control medium, the average triggered up-state duration measured from the LFP was 820 ms (n = 15 trials), but was reduced to 690 ms in ACh (n = 15 trials). Simultaneous VSD imaging revealed that the peak dF/F signal was restricted in a columnar manner to cortex aligned to the stimulation electrode, as demonstrated in peak maps (Fig. 7B). Similarly, for the example slice shown in Figure 6B, stimulation of cortical layer 4 triggered up-states in L2/3 that were shorter in duration and produced fewer spikes in ACh relative to control (Fig. 7C). Therefore, even when spontaneous up-states are reduced or eliminated in the absence of the thalamus, they can still be consistently triggered by a local stimulus, and these triggered up-states have spatiotemporal properties similar to those triggered from the thalamus. These data are consistent with the hypothesis that, under strong cholinergic modulation, afferent input is required to drive activity in local cortical networks.
Figure 7.

Short-duration up-states can be triggered by white matter or local cortical stimulation in nonconnected slices in 1 mm ACh. A, Up-states can be triggered with white matter stimulation (same slice as Fig. 6A). Top, VSD reference image showing locations of LFP and stimulating electrodes. Bottom, LFP of up-states triggered by white matter stimulation before (black) and after (red) wash-in of 1 mm ACh (mean ± SEM; 20 trials). B, VSD peak maps from the same slice as in Figure 6A and 7A. Vertical white dashed lines are drawn to highlight that the strongest depolarization after ACh was aligned to the stimulation electrode. Responses after washout of ACh resemble control. C, Stimulation of L4 triggers up-states of shorter duration with fewer spikes relative to control in a second example slice (same slice as in Fig. 6B). Left, Single-trial examples. Right, Averages of 10 trials for each condition.
100 μm ACh excites local cortical networks directly in the absence of thalamocortical connections
Finally, in stark contrast to findings with 1 mm ACh, the actions of low-concentration ACh (100 μm) on spontaneous up-states did not differ between connected and nonconnected slices. In the example nonconnected slice shown in Figure 8, up-states occurred in control medium with a frequency of 0.05 Hz (Fig. 8A, top), which increased dramatically after bath application of 100 μm ACh to 0.32 Hz (Fig. 8A, middle). As above for connected slices, spontaneous up-states included those of both short duration (Fig. 8A, middle right, single asterisks) and control duration (Fig. 8A middle right, double asterisks). After washout, the network returned to control conditions with a frequency of 0.05 Hz (Fig. 8A, bottom).
For the population of nonconnected slices (n = 7), the average up-state frequency increased from 0.05 ± 0.01 to 0.28 ± 0.08 Hz (p < 0.05) for an average increase of 5.5 ± 1.1× when normalized to control within each slice (p < 0.01; Fig. 8B, top). Furthermore, similar to thalamocortical slices, the average duration did not change significantly (mean duration: 1.03 ± 0.06 vs 0.83 ± 0.1 s; p = 0.1. normalized: 0.82 ± 0.09; p = 0.1; Fig. 8B, bottom). Finally, the distribution of up-state durations revealed that network events similar to control were not eliminated in ACh as found above in thalamocortical slices (compare Figs. 8C, 3C). After washout, up-state frequency returned to control values (one-way ANOVA: F(2,18) = 9.1, p < 0.01; Tukey post hoc: control vs 1 mm ACh: 0.05 ± 0.01 vs 0.28 ± 0.08, p < 0.01; washout vs 1 mm ACh: 0.04 ± 0.004 vs 0.28 ± 0.01, p < 0.01; control vs washout: p = 0.99; Fig. 3D), whereas up-state duration was not different among the groups (one-way ANOVA: F(2,18) = 2.12, p = 0.15; Fig. 8D). Therefore, low-concentration ACh (100 μm) excites cortical networks directly and independently of intact thalamocortical connections in the slice.
Our data are consistent with the hypothesis that lower levels of ACh promote cortical recurrent excitation, thus allowing activity to freely propagate among local networks in the absence of a driving afferent input.
10 μm ACh has only subtle effects on cortical network activity
Finally, to determine a lower limit on the concentration of bath applied ACh necessary to alter cortical network activity, we applied 10 μm ACh to slices disconnected from the thalamus. In the example shown in Figure 9A, the ongoing up-states appear qualitatively similar in control medium, in 10 μm ACh, and after washout. Indeed, up-state frequency in this slice was similar before and during ACh wash-in (0.09 vs 0.08 Hz); however, the mean duration was slightly increased (0.85 ± 0.04 s in control, 1.17 ± 0.07 s in 10 μm ACh), which appeared to be sustained after washout (0.97 ± 0.05 s). Across the population of slices (n = 6), the mean up-state frequency was unchanged (control: 0.08 ± 0.01 Hz vs 10 μm ACh: 0.1 ± 0.01 Hz; p = 0.09; Fig. 9B, top), whereas the mean duration increased significantly from 0.87 ± 0.06 s to 1.04 ± 0.07 (p < 0.01) for a small but significant increase of 1.2 ± 0.04× when normalized to control (p < 0.01; Fig. 9B, bottom). Indeed, a small shift toward longer up-states is apparent in the distribution of up-state durations (Fig. 9C). The increase in duration appeared to be sustained after washout (Fig. 9D); however, due to the subtle nature of the increase, no significant difference was found among the conditions for up-state duration (one-way ANOVA: F(2,15) = 2.24, p = 0.14) or frequency (F(2,15) = 1.24, p = 0.32; Fig. 9D).
Figure 9.
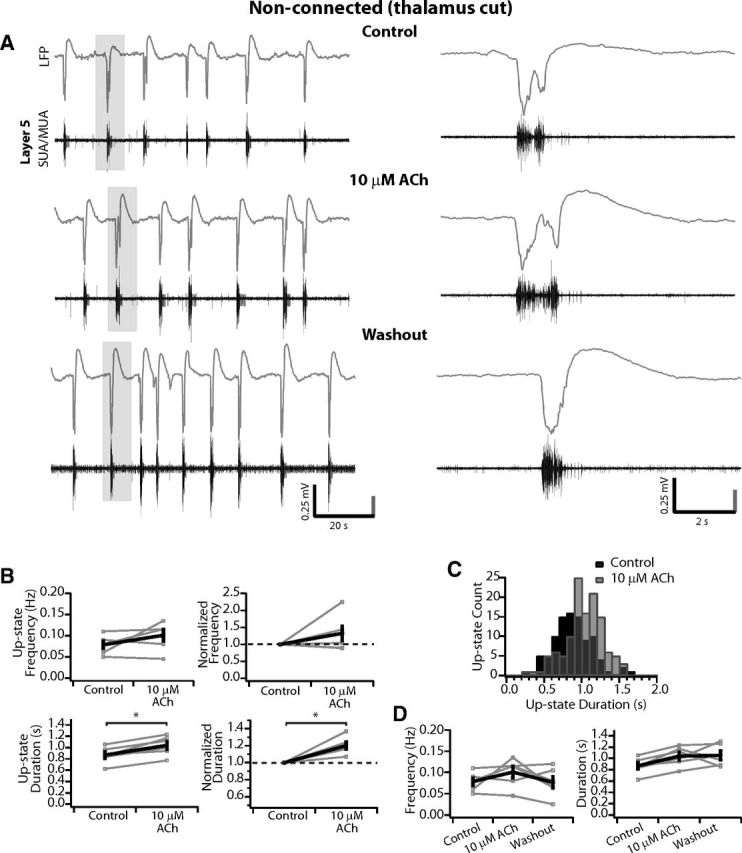
10 μm ACh does not change up-state frequency but may slightly increase up-state duration in nonconnected slices. A, LFP (gray) and SUA/MUA in L5 (black) of spontaneous activity in a nonconnected slice. Up-state frequency and duration are similar in this slice before and after wash-in of 10 μm ACh. Gray boxes indicate areas expanded at right. B, Average up-state frequency is not changed but average duration is increased. Top, Average up-state frequency (left) and average change in up-state frequency normalized to control within each slice (right). Bottom, Average up-state duration (left) and average change in up-state duration normalized to control within each slice (right). *p < 0.05. n = 6 slices. Gray, individual slices; black, population mean ± SEM. C, Distribution of up-state durations in 100 ms time-bins. There is a small tendency to observe more up-states of longer duration in 10 μm ACh. D, Up-state frequency and duration return to control after washout. n = 6 slices. One-way ANOVAs found no significant differences among the control, 10 μm ACh, and washout groups for either average frequency or duration.
We conclude that, at 10 μm, bath-applied ACh no longer has a strong excitatory effect on the cortical network as observed at 100 μm.
Discussion
Acetylcholine not only causes widespread cortical and thalamic depolarization, but alters the weights of intracortical and thalamocortical synapses and may importantly modulate cortical responses to afferent input (Hasselmo and Bower, 1992; Gil et al., 1997; Steriade, 2004; Kuczewski et al., 2005). Our data show that ACh switches thalamocortical network state and responses to afferent input in a concentration-dependent manner. High ACh (1 mm) dampened cortical activity consistent with depression among intracortical synapses: reduced up-state duration, propagation, and intracellular depolarization. Furthermore, cortical activity became dependent on afferent input, because disconnecting the thalamus largely abolished spontaneous up-states. In contrast, lower ACh (100 μm) increased spontaneous up-state frequency independently of intact thalamocortical connections and without changes in duration, propagation, or depolarization. Therefore, different levels of cholinergic modulation can modify the activity of thalamocortical networks in opposite ways. Our data are consistent with the model of Hasselmo and McGaughy (2004) in which high ACh increases the signal-to-noise ratio of afferent input versus local cortical feedback, whereas in low ACh, local cortical activity is dominant.
Volume transmission of ACh in the cortex
Cholinergic input from the basal forebrain (BF) has been hypothesized to operate via volume transmission to provide an ambient level of ACh that influences cortical network state (Descarries et al., 1997; Descarries, 1998; Hasselmo and McGaughy, 2004). This is consistent with the infrequent contact of cholinergic axons with specialized postsynaptic densities (Umbriaco et al., 1994; Yamasaki et al., 2010) and the extrasynaptic distribution of mAChRs along pyramidal cell dendrites (Yamasaki et al., 2010). Identified cholinergic neurons of the BF fire during waking and REM sleep but are silent during NREM sleep (Lee et al., 2005), with concomitant changes in basal cortical ACh levels measured with microdialysis (Jasper and Tessier, 1971; Marrosu et al., 1995). However, cholinergic axons do make traditional synaptic contacts in the cortex and some studies challenge that they represent a minority (Mrzljak et al., 1995; Smiley et al., 1997; Turrini et al., 2001). Furthermore, cortical neurons can respond to transient cholinergic inputs even during tonic muscarinic activation (Gulledge and Stuart, 2005; Gulledge et al., 2007) and ACh concentrations can fluctuate on short timescales correlated with attention (Parikh et al., 2007).
Concentration-dependent effects of ACh on cortical network activity
Previous studies found that cholinergic agonists (even at <1 μm) caused presynaptic depression of intracortical synapses (Hasselmo and Bower, 1992; Gil et al., 1997; Hsieh et al., 2000; Favero et al., 2012). However, our findings are in agreement with those of Kuczewski et al. (2005) showing that application of exogenous ACh at concentrations between 20 and 500 μm facilitates cortical synaptic transmission, whereas a concentration of 1 mm results in depression. Those investigators found that different subsets of mAChRs are recruited in a concentration-dependent manner (M2 or M4 for facilitation, combined M1/M4 in addition to other subtypes for depression), with a nonoverlapping switch occurring somewhere between 500 μm and 1 mm. It is important to note that these concentrations are not those acting at the synapse; when they antagonized acetylcholinesterase, which rapidly degrades ACh (Massoulie et al., 1993), ACh concentrations as low as 5 μm caused depression. Furthermore, in our study, 10 μm ACh did not increase up-state frequency and had only a small effect on up-state duration, indicating reduced efficacy at this concentration. Indeed, microdialysis measurements of in vivo extracellular ACh concentrations are in the subnanomolar range (Marrosu et al., 1995). Therefore, bath application of ACh in vitro simply allowed us to explore synaptic effects that are not observed when mAChRs are saturated (as with agonists), and the true concentration affecting AChRs in our slices is much lower than that in the bath.
We found that low (100 μm) ACh excited the cortical network directly to increase spontaneous up-state frequency independently of thalamic input and did not limit their propagation. In vivo, the slow oscillation is cortically generated (Steriade et al., 1993b) and occurs during NREM sleep, when ACh levels are lowest (Marrosu et al., 1995; Lee et al., 2005). A combination of cortical neuron depolarization (McCormick and Prince (1986) and tonic L5 firing observed in this study, as well as synaptic facilitation (Kuczewski et al., 2005), are likely responsible for this increased cortical network excitability.
In contrast, in high ACh (1 mm) up-states were greatly dependent on thalamic input and limited in their propagation. Presynaptic depression of intracortical synapses is a strong candidate mechanism (Hasselmo and Bower, 1992; Gil et al., 1997; Hsieh et al., 2000). However, ACh also has diverse effects on GABAergic interneurons (Lawrence (2008), which may alter the ratio of inhibition to excitation. Indeed, McCormick and Prince (1986) found that ACh not only depolarized pyramidal neurons but also resulted in barrages of IPSPs from local inhibitory interneurons. nAChRs depolarize interneurons expressing vasoactive intestinal polypeptide (VIP) and cholecystokinin (Porter et al., 1999) and mAChRs depolarize those expressing VIP and somatostatin and those characterized as low-threshold spiking (Kawaguchi, 1997; Xiang et al., 1998). However, in fast-spiking interneurons, a prominent source inhibition in cortex, mAChRs can cause hyperpolarization and suppression of GABA release onto pyramidal cells (Xiang et al., 1998; Kruglikov and Rudy, 2008). Therefore, future work is necessary to investigate the contribution of inhibition to determining the state of cortical networks under different ACh concentrations.
Laminar differences of ACh effects
Intracellular recordings in L2/3 did not reveal changes in Vm or input resistance, but firing rates during up-states were reduced significantly. In contrast, with extracellular recordings in L5, we observed intrinsically bursting neurons that fired tonically in the presence of ACh regardless of concentration. Previously, Gulledge et al. (2009) and Eggermann and Feldmeyer (2009) found that carbachol or focally applied ACh weakly depolarized L2/3 neurons (∼1–2 mV), although this may be due to differences in both the type and method of drug application. Importantly, both groups found that cholinergic modulation most strongly depolarized L5 neurons. Therefore, the tonically firing L5 cells that we observed likely did not reduce their firing rate during up-states due to a depolarized Vm. However, presynaptic depression would reduce their ability to drive the local network. In middle layers (L3 and L4), ACh can hyperpolarize excitatory neurons and suppress activity both in vitro and in vivo (Sillito and Kemp, 1983; Sawaguchi and Matsumura, 1985; Eggermann and Feldmeyer, 2009). Therefore, the reductions in depolarization and firing during up-states that we observed in L2/3 likely reflect reduced input from L4 (due to hyperpolarization and presynaptic depression) and from L5 (due to presynaptic depression). Increased up-state frequency observed in low ACh may reflect depolarization and excitation of L5 neurons, which are largely responsible for spontaneous up-states (Sanchez-Vives and McCormick, 2000; Sakata and Harris, 2009).
Functional implications
Although the spontaneous up-states and down-states in our slices are qualitatively similar to the slow oscillation, the in vivo rhythm is of a faster frequency (0.3–0.9 Hz vs 0.1 Hz here) and requires participation of fully intact corticothalamocortical circuitry (Steriade, 2006). Our goal was to use the in vitro version of this rhythm as an assay for general effects of ACh level on cortical network activity. We cannot conclude here that ACh level alone blocks the slow oscillation during waking or NREM sleep in vivo, but simply that it may increase the influence of afferent input on cortical activity. Indeed, in our nonconnected slices, the frequency of spontaneous up-states was low (∼0.05 Hz) and possibly easy to block. We note, however, that in low ACh, the frequency of spontaneous up-states increased to nearly 0.3 Hz.
In vivo, multiple mechanisms participate in generating the active cortical state characterized by sustained synaptic bombardment and depolarization and spatially and temporally constrained responses to afferent input. Stimulation of brainstem cholinergic nuclei excites multiple thalamic nuclei (Steriade and Glenn, 1982; Hallanger et al., 1987), which in turn can drive cortical activity. Indeed, in barrel cortex, primary sensory thalamus has been proposed to be primarily responsible for the active state (Hirata and Castro-Alamancos, 2010; Poulet et al., 2012). Furthermore, ACh could excite corticocortical inputs from distant cortical areas, which are numerous and may drive activity in other cortical networks (Petreanu et al., 2007; Aronoff et al., 2010; Mao et al., 2011; Zagha et al., 2013). However, a recent study argued that noradrenergic input from locus ceruleus to the cortex produces the activated state and neither cholinergic input nor thalamic drive is necessary (Constantinople and Bruno, 2011). These disparate results may be reconciled by the fact that all of these brain regions share connections to each other and may generate the active state on their own or in cooperation under different conditions (Jones, 2003; Steriade, 2004). For example, in rats, block of mAChRs produces the slow oscillation during quiet waking behavioral states, but not during walking or whisking (Vanderwolf, 1975; Stewart et al., 1984). Recently, Poulet et al. (2012) investigated the effects of thalamic lesion on cortical state during different waking behaviors. After thalamic lesion, the slow oscillation was present during quiet waking, but during whisking, the cortex was completely silenced and spontaneous up-states were suppressed. An intriguing possibility is that higher neuromodulatory tone during whisking suppressed spontaneous cortical activity at the expense of thalamic input, which could be tested with future experiments in vivo.
Footnotes
This work was supported by the National Institutes of Health (Grant R01 EY020765 and “Training in Sleep and Sleep Disorders” Grant T32 HL07953). We thank Gene Civillico for VSD analysis code and Larry Palmer, Dan Denman, and other members of the Contreras laboratory for their helpful discussion of this work.
References
- Agmon A, Connors BW. Thalamocortical responses of mouse somatosensory (barrel) cortex in vitro. Neuroscience. 1991;41:365–379. doi: 10.1016/0306-4522(91)90333-J. [DOI] [PubMed] [Google Scholar]
- Aronoff R, Matyas F, Mateo C, Ciron C, Schneider B, Petersen CC. Long-range connectivity of mouse primary somatosensory barrel cortex. Eur J Neurosci. 2010;31:2221–2233. doi: 10.1111/j.1460-9568.2010.07264.x. [DOI] [PubMed] [Google Scholar]
- Civillico EF, Contreras D. Comparison of responses to electrical stimulation and whisker deflection using two different voltage-sensitive dyes in mouse barrel cortex in vivo. J Membr Biol. 2005;208:171–182. doi: 10.1007/s00232-005-0828-6. [DOI] [PubMed] [Google Scholar]
- Civillico EF, Contreras D. Integration of evoked responses in supragranular cortex studied with optical recordings in vivo. J Neurophysiol. 2006;96:336–351. doi: 10.1152/jn.00128.2006. [DOI] [PubMed] [Google Scholar]
- Civillico EF, Contreras D. Spatiotemporal properties of sensory responses in vivo are strongly dependent on network context. Front Syst Neurosci. 2012;6:25. doi: 10.3389/fnsys.2012.00025. [DOI] [PMC free article] [PubMed] [Google Scholar]
- Constantinople CM, Bruno RM. Effects and mechanisms of wakefulness on local cortical networks. Neuron. 2011;69:1061–1068. doi: 10.1016/j.neuron.2011.02.040. [DOI] [PMC free article] [PubMed] [Google Scholar]
- Contreras D, Steriade M. Cellular basis of EEG slow rhythms: a study of dynamic corticothalamic relationships. J Neurosci. 1995;15:604–622. doi: 10.1523/JNEUROSCI.15-01-00604.1995. [DOI] [PMC free article] [PubMed] [Google Scholar]
- Crochet S, Petersen CC. Correlating whisker behavior with membrane potential in barrel cortex of awake mice. Nat Neurosci. 2006;9:608–610. doi: 10.1038/nn1690. [DOI] [PubMed] [Google Scholar]
- Descarries L. The hypothesis of an ambient level of acetylcholine in the central nervous system. J Physiol Paris. 1998;92:215–220. doi: 10.1016/S0928-4257(98)80013-2. [DOI] [PubMed] [Google Scholar]
- Descarries L, Gisiger V, Steriade M. Diffuse transmission by acetylcholine in the CNS. Prog Neurobiol. 1997;53:603–625. doi: 10.1016/S0301-0082(97)00050-6. [DOI] [PubMed] [Google Scholar]
- Eggermann E, Feldmeyer D. Cholinergic filtering in the recurrent excitatory microcircuit of cortical layer 4. Proc Natl Acad Sci U S A. 2009;106:11753–11758. doi: 10.1073/pnas.0810062106. [DOI] [PMC free article] [PubMed] [Google Scholar]
- Favero M, Varghese G, Castro-Alamancos MA. The state of somatosensory cortex during neuromodulation. J Neurophysiol. 2012;108:1010–1024. doi: 10.1152/jn.00256.2012. [DOI] [PMC free article] [PubMed] [Google Scholar]
- Ferezou I, Bolea S, Petersen CC. Visualizing the cortical representation of whisker touch: voltage-sensitive dye imaging in freely moving mice. Neuron. 2006;50:617–629. doi: 10.1016/j.neuron.2006.03.043. [DOI] [PubMed] [Google Scholar]
- Gil Z, Connors BW, Amitai Y. Differential regulation of neocortical synapses by neuromodulators and activity. Neuron. 1997;19:679–686. doi: 10.1016/S0896-6273(00)80380-3. [DOI] [PubMed] [Google Scholar]
- Gulledge AT, Stuart GJ. Cholinergic inhibition of neocortical pyramidal neurons. J Neurosci. 2005;25:10308–10320. doi: 10.1523/JNEUROSCI.2697-05.2005. [DOI] [PMC free article] [PubMed] [Google Scholar]
- Gulledge AT, Park SB, Kawaguchi Y, Stuart GJ. Heterogeneity of phasic cholinergic signaling in neocortical neurons. J Neurophysiol. 2007;97:2215–2229. doi: 10.1152/jn.00493.2006. [DOI] [PubMed] [Google Scholar]
- Gulledge AT, Bucci DJ, Zhang SS, Matsui M, Yeh HH. M1 receptors mediate cholinergic modulation of excitability in neocortical pyramidal neurons. J Neurosci. 2009;29:9888–9902. doi: 10.1523/JNEUROSCI.1366-09.2009. [DOI] [PMC free article] [PubMed] [Google Scholar]
- Hallanger AE, Levey AI, Lee HJ, Rye DB, Wainer BH. The origins of cholinergic and other subcortical afferents to the thalamus in the rat. J Comp Neurol. 1987;262:105–124. doi: 10.1002/cne.902620109. [DOI] [PubMed] [Google Scholar]
- Hasselmo ME, Bower JM. Cholinergic suppression specific to intrinsic not afferent fiber synapses in rat piriform (olfactory) cortex. J Neurophysiol. 1992;67:1222–1229. doi: 10.1152/jn.1992.67.5.1222. [DOI] [PubMed] [Google Scholar]
- Hasselmo ME, McGaughy J. High acetylcholine levels set circuit dynamics for attention and encoding and low acetylcholine levels set dynamics for consolidation. Prog Brain Res. 2004;145:207–231. doi: 10.1016/S0079-6123(03)45015-2. [DOI] [PubMed] [Google Scholar]
- Hirata A, Castro-Alamancos MA. Neocortex network activation and deactivation states controlled by the thalamus. J Neurophysiol. 2010;103:1147–1157. doi: 10.1152/jn.00955.2009. [DOI] [PMC free article] [PubMed] [Google Scholar]
- Houser CR, Crawford GD, Salvaterra PM, Vaughn JE. Immunocytochemical localization of choline acetyltransferase in rat cerebral cortex: a study of cholinergic neurons and synapses. J Comp Neurol. 1985;234:17–34. doi: 10.1002/cne.902340103. [DOI] [PubMed] [Google Scholar]
- Hsieh CY, Cruikshank SJ, Metherate R. Differential modulation of auditory thalamocortical and intracortical synaptic transmission by cholinergic agonist. Brain Res. 2000;880:51–64. doi: 10.1016/S0006-8993(00)02766-9. [DOI] [PubMed] [Google Scholar]
- Jasper HH, Tessier J. Acetylcholine liberation from cerebral cortex during paradoxical (REM) sleep. Science. 1971;172:601–602. doi: 10.1126/science.172.3983.601. [DOI] [PubMed] [Google Scholar]
- Jones BE. Arousal systems. Front Biosci. 2003;8:s438–451. doi: 10.2741/1074. [DOI] [PubMed] [Google Scholar]
- Kawaguchi Y. Selective cholinergic modulation of cortical GABAergic cell subtypes. J Neurophysiol. 1997;78:1743–1747. doi: 10.1152/jn.1997.78.3.1743. [DOI] [PubMed] [Google Scholar]
- Kruglikov I, Rudy B. Perisomatic GABA release and thalamocortical integration onto neocortical excitatory cells are regulated by neuromodulators. Neuron. 2008;58:911–924. doi: 10.1016/j.neuron.2008.04.024. [DOI] [PMC free article] [PubMed] [Google Scholar]
- Kuczewski N, Aztiria E, Gautam D, Wess J, Domenici L. Acetylcholine modulates cortical synaptic transmission via different muscarinic receptors, as studied with receptor knockout mice. J Physiol. 2005;566:907–919. doi: 10.1113/jphysiol.2005.089987. [DOI] [PMC free article] [PubMed] [Google Scholar]
- Laaris N, Carlson GC, Keller A. Thalamic-evoked synaptic interactions in barrel cortex revealed by optical imaging. J Neurosci. 2000;20:1529–1537. doi: 10.1523/JNEUROSCI.20-04-01529.2000. [DOI] [PMC free article] [PubMed] [Google Scholar]
- Land PW, Kandler K. Somatotopic organization of rat thalamocortical slices. J Neurosci Methods. 2002;119:15–21. doi: 10.1016/S0165-0270(02)00150-4. [DOI] [PubMed] [Google Scholar]
- Lawrence JJ. Cholinergic control of GABA release: emerging parallels between neocortex and hippocampus. Trends Neurosci. 2008;31:317–327. doi: 10.1016/j.tins.2008.03.008. [DOI] [PubMed] [Google Scholar]
- Lee MG, Hassani OK, Alonso A, Jones BE. Cholinergic basal forebrain neurons burst with theta during waking and paradoxical sleep. J Neurosci. 2005;25:4365–4369. doi: 10.1523/JNEUROSCI.0178-05.2005. [DOI] [PMC free article] [PubMed] [Google Scholar]
- Mao T, Kusefoglu D, Hooks BM, Huber D, Petreanu L, Svoboda K. Long-Range Neuronal Circuits Underlying the Interaction between Sensory and Motor Cortex. Neuron. 2011;72:111–123. doi: 10.1016/j.neuron.2011.07.029. [DOI] [PMC free article] [PubMed] [Google Scholar]
- Marrosu F, Portas C, Mascia MS, Casu MA, Fà M, Giagheddu M, Imperato A, Gessa GL. Microdialysis measurement of cortical and hippocampal acetylcholine release during sleep-wake cycle in freely moving cats. Brain Res. 1995;671:329–332. doi: 10.1016/0006-8993(94)01399-3. [DOI] [PubMed] [Google Scholar]
- Massoulié J, Pezzementi L, Bon S, Krejci E, Vallette FM. Molecular and cellular biology of cholinesterases. Prog Neurobiol. 1993;41:31–91. doi: 10.1016/0301-0082(93)90040-Y. [DOI] [PubMed] [Google Scholar]
- McCormick DA, Pape HC. Acetylcholine inhibits identified interneurons in the cat lateral geniculate nucleus. Nature. 1988;334:246–248. doi: 10.1038/334246a0. [DOI] [PubMed] [Google Scholar]
- McCormick DA, Prince DA. Mechanisms of action of acetylcholine in the guinea-pig cerebral cortex in vitro. J Physiol. 1986;375:169–194. doi: 10.1113/jphysiol.1986.sp016112. [DOI] [PMC free article] [PubMed] [Google Scholar]
- McCormick DA, Prince DA. Actions of acetylcholine in the guinea-pig and cat medial and lateral geniculate nuclei, in vitro. J Physiol. 1987;392:147–165. doi: 10.1113/jphysiol.1987.sp016774. [DOI] [PMC free article] [PubMed] [Google Scholar]
- Mesulam MM, Van Hoesen GW. Acetylcholinesterase-rich projections from the basal forebrain of the rhesus monkey to neocortex. Brain Res. 1976;109:152–157. doi: 10.1016/0006-8993(76)90385-1. [DOI] [PubMed] [Google Scholar]
- Mrzljak L, Pappy M, Leranth C, Goldman-Rakic PS. Cholinergic synaptic circuitry in the macaque prefrontal cortex. J Comp Neurol. 1995;357:603–617. doi: 10.1002/cne.903570409. [DOI] [PubMed] [Google Scholar]
- Obaid AL, Loew LM, Wuskell JP, Salzberg BM. Novel naphthylstyryl-pyridium potentiometric dyes offer advantages for neural network analysis. J Neurosci Methods. 2004;134:179–190. doi: 10.1016/j.jneumeth.2003.11.011. [DOI] [PubMed] [Google Scholar]
- Parikh V, Kozak R, Martinez V, Sarter M. Prefrontal acetylcholine release controls cue detection on multiple timescales. Neuron. 2007;56:141–154. doi: 10.1016/j.neuron.2007.08.025. [DOI] [PMC free article] [PubMed] [Google Scholar]
- Petreanu L, Huber D, Sobczyk A, Svoboda K. Channelrhodopsin-2-assisted circuit mapping of long-range callosal projections. Nat Neurosci. 2007;10:663–668. doi: 10.1038/nn1891. [DOI] [PubMed] [Google Scholar]
- Porter JT, Cauli B, Tsuzuki K, Lambolez B, Rossier J, Audinat E. Selective excitation of subtypes of neocortical interneurons by nicotinic receptors. J Neurosci. 1999;19:5228–5235. doi: 10.1523/JNEUROSCI.19-13-05228.1999. [DOI] [PMC free article] [PubMed] [Google Scholar]
- Poulet JF, Fernandez LM, Crochet S, Petersen CC. Thalamic control of cortical states. Nat Neurosci. 2012;15:370–372. doi: 10.1038/nn.3035. [DOI] [PubMed] [Google Scholar]
- Rigas P, Castro-Alamancos MA. Thalamocortical Up states: differential effects of intrinsic and extrinsic cortical inputs on persistent activity. J Neurosci. 2007;27:4261–4272. doi: 10.1523/JNEUROSCI.0003-07.2007. [DOI] [PMC free article] [PubMed] [Google Scholar]
- Sakata S, Harris KD. Laminar structure of spontaneous and sensory-evoked population activity in auditory cortex. Neuron. 2009;64:404–418. doi: 10.1016/j.neuron.2009.09.020. [DOI] [PMC free article] [PubMed] [Google Scholar]
- Sanchez-Vives MV, McCormick DA. Cellular and network mechanisms of rhythmic recurrent activity in neocortex. Nat Neurosci. 2000;3:1027–1034. doi: 10.1038/79848. [DOI] [PubMed] [Google Scholar]
- Sawaguchi T, Matsumura M. Laminar distributions of neurons sensitive to acetylcholine, noradrenaline and dopamine in the dorsolateral prefrontal cortex of the monkey. Neurosci Res. 1985;2:255–273. doi: 10.1016/0168-0102(85)90004-5. [DOI] [PubMed] [Google Scholar]
- Sillito AM, Kemp JA. Cholinergic modulation of the functional organization of the cat visual cortex. Brain Res. 1983;289:143–155. doi: 10.1016/0006-8993(83)90015-X. [DOI] [PubMed] [Google Scholar]
- Smiley JF, Morrell F, Mesulam MM. Cholinergic synapses in human cerebral cortex: an ultrastructural study in serial sections. Exp Neurol. 1997;144:361–368. doi: 10.1006/exnr.1997.6413. [DOI] [PubMed] [Google Scholar]
- Steriade M. Acetylcholine systems and rhythmic activities during the waking-sleep cycle. Prog Brain Res. 2004;145:179–196. doi: 10.1016/S0079-6123(03)45013-9. [DOI] [PubMed] [Google Scholar]
- Steriade M. Grouping of brain rhythms in corticothalamic systems. Neuroscience. 2006;137:1087–1106. doi: 10.1016/j.neuroscience.2005.10.029. [DOI] [PubMed] [Google Scholar]
- Steriade M, Glenn LL. Neocortical and caudate projections of intralaminar thalamic neurons and their synaptic excitation from midbrain reticular core. J Neurophysiol. 1982;48:352–371. doi: 10.1152/jn.1982.48.2.352. [DOI] [PubMed] [Google Scholar]
- Steriade M, Nuñez A, Amzica F. A novel slow (< 1 Hz) oscillation of neocortical neurons in vivo: depolarizing and hyperpolarizing components. J Neurosci. 1993a;13:3252–3265. doi: 10.1523/JNEUROSCI.13-08-03252.1993. [DOI] [PMC free article] [PubMed] [Google Scholar]
- Steriade M, Nuñez A, Amzica F. Intracellular analysis of relations between the slow (< 1 Hz) neocortical oscillation and other sleep rhythms of the electroencephalogram. J Neurosci. 1993b;13:3266–3283. doi: 10.1523/JNEUROSCI.13-08-03266.1993. [DOI] [PMC free article] [PubMed] [Google Scholar]
- Steriade M, Timofeev I, Grenier F. Natural waking and sleep states: a view from inside neocortical neurons. J Neurophysiol. 2001;85:1969–1985. doi: 10.1152/jn.2001.85.5.1969. [DOI] [PubMed] [Google Scholar]
- Stewart DJ, MacFabe DF, Vanderwolf CH. Cholinergic activation of the electrocorticogram: role of the substantia innominata and effects of atropine and quinuclidinyl benzilate. Brain Res. 1984;322:219–232. doi: 10.1016/0006-8993(84)90112-4. [DOI] [PubMed] [Google Scholar]
- Turrini P, Casu MA, Wong TP, De Koninck Y, Ribeiro-da-Silva A, Cuello AC. Cholinergic nerve terminals establish classical synapses in the rat cerebral cortex: synaptic pattern and age-related atrophy. Neuroscience. 2001;105:277–285. doi: 10.1016/S0306-4522(01)00172-5. [DOI] [PubMed] [Google Scholar]
- Umbriaco D, Watkins KC, Descarries L, Cozzari C, Hartman BK. Ultrastructural and morphometric features of the acetylcholine innervation in adult rat parietal cortex: an electron microscopic study in serial sections. J Comp Neurol. 1994;348:351–373. doi: 10.1002/cne.903480304. [DOI] [PubMed] [Google Scholar]
- Vanderwolf CH. Neocortical and hippocampal activation relation to behavior: effects of atropine, eserine, phenothiazines, and amphetamine. J Comp Physiol Psychol. 1975;88:300–323. doi: 10.1037/h0076211. [DOI] [PubMed] [Google Scholar]
- Wester JC, Contreras D. Columnar interactions determine horizontal propagation of recurrent network activity in neocortex. J Neurosci. 2012;32:5454–5471. doi: 10.1523/JNEUROSCI.5006-11.2012. [DOI] [PMC free article] [PubMed] [Google Scholar]
- Wilson MA, McNaughton BL. Reactivation of hippocampal ensemble memories during sleep. Science. 1994;265:676–679. doi: 10.1126/science.8036517. [DOI] [PubMed] [Google Scholar]
- Wörgötter F, Suder K, Zhao Y, Kerscher N, Eysel UT, Funke K. State-dependent receptive-field restructuring in the visual cortex. Nature. 1998;396:165–168. doi: 10.1038/24157. [DOI] [PubMed] [Google Scholar]
- Xiang Z, Huguenard JR, Prince DA. Cholinergic switching within neocortical inhibitory networks. Science. 1998;281:985–988. doi: 10.1126/science.281.5379.985. [DOI] [PubMed] [Google Scholar]
- Yamasaki M, Matsui M, Watanabe M. Preferential localization of muscarinic M1 receptor on dendritic shaft and spine of cortical pyramidal cells and its anatomical evidence for volume transmission. J Neurosci. 2010;30:4408–4418. doi: 10.1523/JNEUROSCI.5719-09.2010. [DOI] [PMC free article] [PubMed] [Google Scholar]
- Zagha E, Casale AE, Sachdev RN, McGinley MJ, McCormick DA. Motor Cortex Feedback Influences Sensory Processing by Modulating Network State. Neuron. 2013 doi: 10.1016/j.neuron.2013.06.008. [DOI] [PMC free article] [PubMed] [Google Scholar]