

Abstract
Background
Insulin-induced hypoglycemia is as a critical barrier in the treatment of type 1 diabetes mellitus patients and may lead to unconsciousness, brain damage, or even death. Clinically, glucagon is used as a rescue drug to treat severe hypoglycemic episodes. More recently, in a bihormonal closed-loop glucose control, glucagon has been used subcutaneously along with insulin for protection against hypoglycemia. In this context, small doses of glucagon are frequently administered. The efficacy and safety of such systems, however, require precise information on the pharmacokinetics of the glucagon transport from the administrative site to the circulation, which is currently lacking. The goal of this work is to address this need by developing and validating a mathematical model of exogenous glucagon transport to the plasma.
Materials and Methods
Eight pharmacokinetic models with various levels of complexity were fitted to nine clinical datasets. An optimal model was chosen in two consecutive steps. At Step 1, all models were screened for parameter identifiability (discarding the unidentifiable candidates). At Step 2, the remaining models are compared based on Bayesian information criterion.
Results
At Step 1, two models were removed for higher parameter fractional SDs. Another three were discarded for location of their optimal parameters on the parameter search boundaries. At Step 2, an optimal model was selected based on the Bayesian information criterion. It has a simple linear structure, assuming that glucagon is injected into one compartment, from where it enters a pool for a slower release into a third, plasma compartment. In the first and third compartments, glucagon is cleared at a rate proportional to its concentration.
Conclusions
A linear kinetic model of glucagon intervention has been developed and validated. It is expected to provide guidance for glucagon delivery and the construction of preclinical simulation testing platforms.
Introduction
Though the cornerstone of type 1 diabetes mellitus (T1DM) glycemic control in current clinical practice, insulin treatment can, and often does, lead to hypoglycemia, which may be harmful to patients and has been recognized as a major barrier to tight glycemic control.1 In health, hypoglycemia is prevented by glucagon secretion from the pancreatic α-cells; glucagon is secreted reciprocally to insulin and opposes its action in the liver by stimulating the hepatic glucose production. In T1DM patients, endogenous glucagon response to insulin-induced hypoglycemia is impaired,2 which increases the risk of severe hypoglycemia and requires use of exogenous glucagon injections as a rescue treatment in the most severe cases. More recently, glucagon has also been used in bihormonal artificial pancreas (AP) systems, where insulin and glucagon are both injected using subcutaneous (SC) pumps and dosed based on model prediction from continuous glucose monitoring data and history of injections. Castle et al.3 were the first to perform such a study and demonstrate that glucagon interventions can be successfully added to an AP system as a protection against hypoglycemia. Further studies were carried by El-Khatib et al.4 and Ward et al.,5 as well as the most recent randomized crossover trial by Haidar et al.,6 which also showed improvement of glucose control against hypoglycemia with nocturnal glucagon plus insulin closed-loop strategy over open-loop insulin infusion.
As research interest and implementation of glucagon intervention in the treatment of T1DM patients grow,3–9 especially in the field of modeling predictive AP systems, it becomes necessary to establish a robust and easily identifiable pharmacokinetic model of exogenous glucagon transport. In addition, such a model will provide the foundation for designing bihormonal strategies in AP systems,10 leading to an easier regulatory pathway to clinical trials as well as accelerated system design and optimization. Historically, only the pharmacodynamics of glucagon have been included in comprehensive metabolism models, such as Sorensen's model,11 revisions of the Sorensen model,12,13 and, more recently, the Padova meal model.14 However, there is no publication yet on pharmacokinetic modeling of exogenous glucagon. Thus, several glucagon transport mathematical models are proposed and compared in this work. The amount of injected glucagon in the SC space is considered as the “input,” and the glucagon concentration in plasma is considered as the “output” of these models. The “best” representation of exogenous glucagon transport is chosen based on the criteria of accuracy and identifiability. Thereafter, the parameters of the model may provide a quantitative way to depict the efficiency of glucagon delivery in various T1DM subjects and contribute to control strategy design.
Experimental Methods
Datasets
Clinical data for this study were kindly provided by Dr. E.R. Damiano's group (Boston University, Boston, MA), which were collected in a bihormonal closed-loop clinical trial.4 The data were obtained from 11 adults with T1DM (age, 40±16 years; weight, 83±13 kg; body mass index, 28±3 kg/m2; diabetes duration, 23±13 years; and hemoglobin A1c, 7.3±0.8%). The patients were studied for 27 h, during which they were given three regular carbohydrate-rich meals. Some patients enrolled twice and were studied with a separation of at least 5 months, leading to 13 datasets available for analysis. Frequent doses of insulin and glucagon were injected and monitored to maintain glucose levels based on the AP system described in El-Khatib et al.4 No glucagon was injected immediately preceding the data collection. Venous glucose concentrations were obtained every 5 min (GlucoScout™; International Biomedical, Austin, TX) as a reference for the closed-loop control algorithm; the concentrations of insulin and glucagon in plasma were measured every 10 min initially, changing to 30-min intervals for insulin and 20-min intervals for glucagon thereafter.
Data analysis
In four of the 13 datasets, exogenous glucagon alone was not able to prevent the hypoglycemia, which was treated with glucose administration. Although the endogenous glucagon response to hypoglycemia is impaired as discussed in the literature, there was still some evidence of glucagon secretion. (We address this in Discussion.) In order to establish a model focused on exogenous glucagon transport, the datasets of these four subjects were excluded from modeling optimization. At the end, nine datasets from seven subjects were used for model fitting and identification. The number of data samples in each of these nine datasets ranges from 59 to 162, which is large enough for the fitting process.
During fitting, the basal glucagon concentrations were considered equal to endogenous secretion. The basal glucagon concentration (xbasal) was estimated as an average from segments prior to the first glucagon injection and/or from segments with at least 90 min between glucagon injections.
These pharmacokinetic models of exogenous glucagon were represented by a series of ordinary differential equations and solved by Matlab® software (The MathWorks, Natick, MA).
Local clearance and transport saturation
We observed that a simple one-compartment model cannot explain the experimental data without imposing nonphysiological values of its parameters. This justifies the need to consider more complex model structures, which include clearance at the injection site and saturation of the transport. Indeed, in the experiments, exogenous glucagon entered the SC space and traveled to the plasma. If one assumes that all of the injected glucagon will appear in plasma and be cleared from there following an order 1 dynamic (proportional to the plasma concentration),15 then the following equation holds:
 |
(1) |
where GCG(t) and GCG′(t) represent the concentration of glucagon and its changing rate in plasma, respectively; kc represents the clearance rate of glucagon in plasma; u(t) represents the delivered amount of exogenous glucagon; and Vd represents the volume of glucagon distribution. It is also assumed that the experiment starts at t1 in a basal state, and it is given enough time until t2 for glucagon concentration in plasma to return to the basal value after injection, such that GCG(t1)=GCG(t2) (and therefore the left-hand side of the equation is equal to 0). Thus, the Vd may be determined by the following equation:
 |
(2) |
An example from the datasets is demonstrated in Figure 1 (kc is assumed equal to 0.12 min−1 just for this illustration), which describes the relationship between the injected glucagon amount [∑u(t)] and the Vd. Because the clearance rate in plasma (kc, min−1) is defined in the range of 0.01–0.5 for model fitting and the volume of plasma is about 38.5 mL/kg, the nominal volume of plasma, Vp, for this subject (body weight, 73.0 kg) is about 2,810.5 mL, which is much smaller than the Vd in the plot. This observation suggests that the glucagon transport model should account for either (or both):
FIG. 1.

Volume of distribution (Vd) with respect to the amount of glucagon injected in a subject with type 1 diabetes mellitus.
A local clearance or sequestration of a significant amount of the injected glucagon in the SC space, creating a “pool” for a much slower release, or
A saturation of transport with respect to the injected amount (a nonlinearity), possibly resulting from glucagon conformational transition through aggregation16,17
These mechanisms are represented as local clearance and transport saturation in the proposed models.
Pharmacokinetics Models
Structures and identification of glucagon transport models
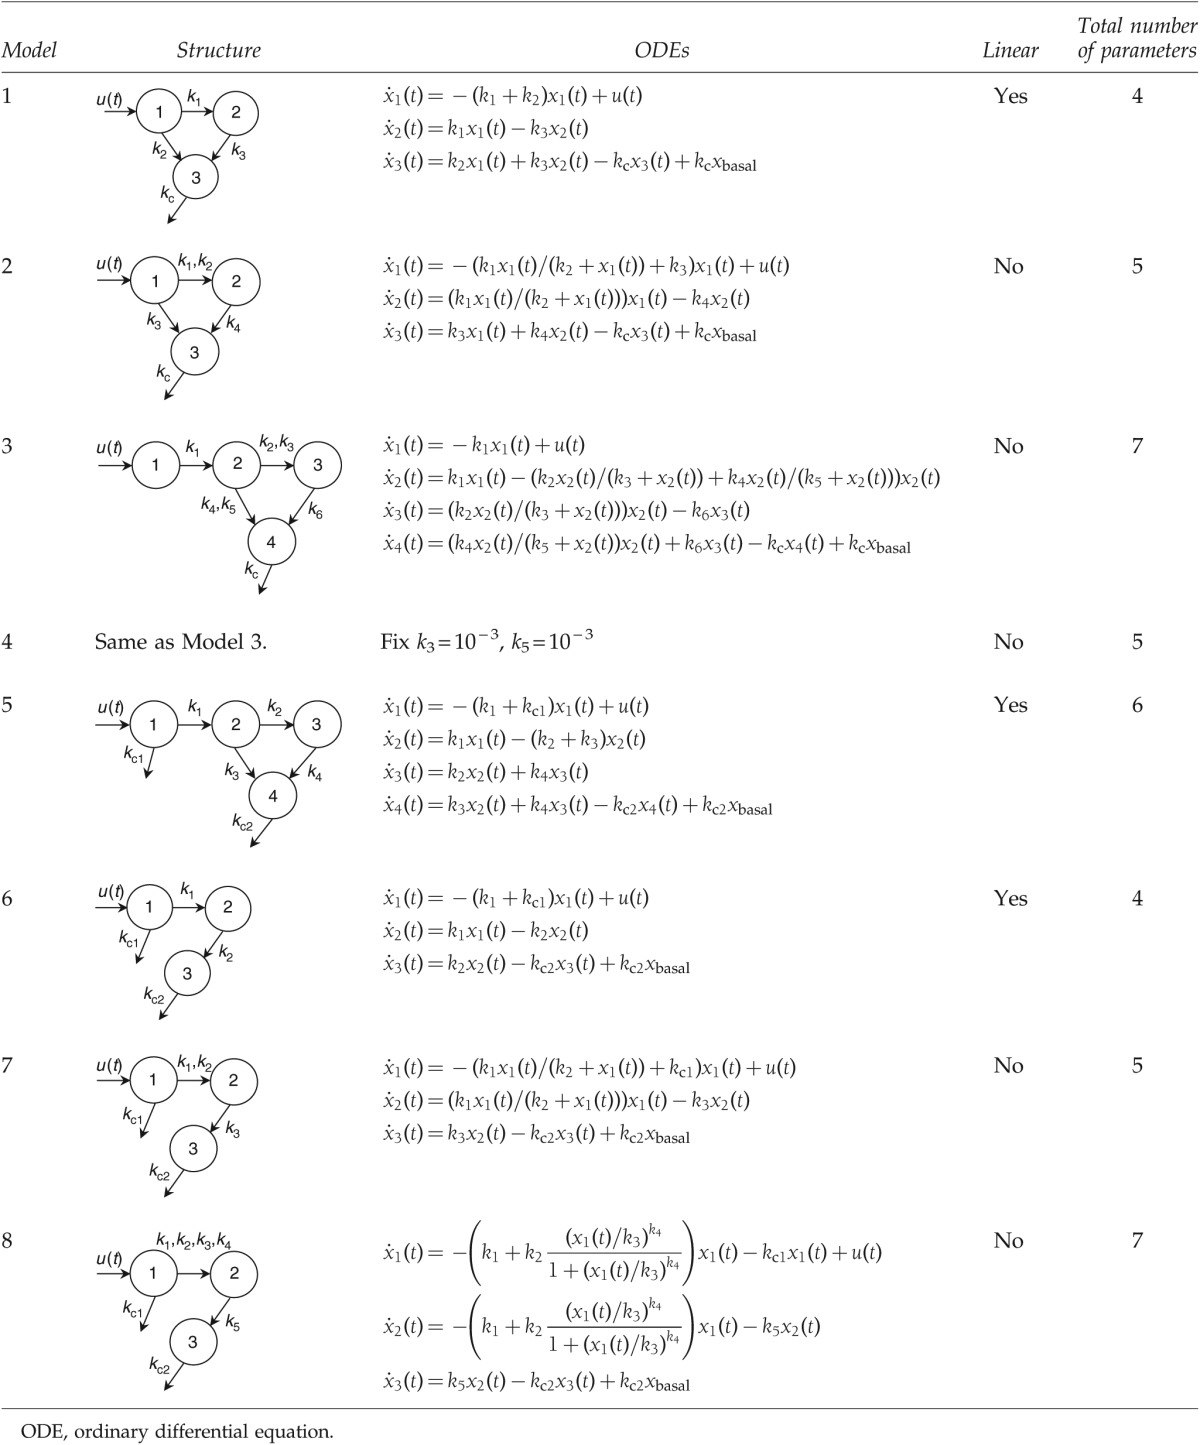
We studied eight models of increasing complexity to represent the SC transport of exogenous glucagon (Table 1). Among them, the structures of four models do not apply local clearance at the administrative depot (Models 1–4), whereas the other four models do (Models 5–8). The system input is defined as u(t) (mg), representing the frequent glucagon injection in the datasets. Fitting is performed using the forcing function methodology [u(t) is such a function], which allows for potential glucagon stacking in each compartment without loss of generality. In addition, this methodology is particularly suitable to the intended use of these models (i.e., simulation platforms and control design). Some models may have identical structures; however, some of their parameters are defined as constants in order to improve parameter identification and reduce parameter correlation.
Table 1.
Structures of Models
 |
Description of the models
Model graphical representations are presented in Table 1. In all models xbasal values are determined as described previously in Experimental Methods, Data analysis.
Model 1, the simplest linear model representation with a pool compartment (compartment 2), follows the structure of the previously developed SC insulin delivery model.18,19 Exogenous glucagon is injected at compartment 1, part of which may enter the pool for a slower release, whereas the rest may directly enter the plasma (compartment 3). Glucagon in plasma is cleared at a rate of kc (min−1). The rates between compartments are linear to the amount of remaining glucagon.
Model 2 adopts a Michaelis–Menten function to introduce the possibility of the transport process depending saturably on the concentration from the administrative site (compartment 1) to the intermediate compartment (compartment 2). The parameters of Michaelis–Menten function are given as the maximal transport rate k1 (mg/min) and the half-saturation amount k2 (mg).
Model 3 adds an additional compartment (compartment 2) to create a delay in the transport pathway between the site of administration (compartment 1) and the pool compartment (compartment 3). The transport rates from this compartment (compartment 2) to the pool compartment (compartment 3) and the plasma (compartment 4) are represented by two Michaelis–Menten functions. The parameters are given as the maximal transport rates k2 and k4 (mg/min) and the half-saturation amounts k3 and k5 (mg).
Model 4 has a structure identical to Model 3. However, the parameters of half-saturation glucagon amounts are fixed as constants of 10−3 (k3 [mg], from compartment 2 to compartment 3, and k5 [mg], from compartment 2 to compartment 4). The values are fixed because of the detected correlation during fitting of Model 3.
Model 5 also has an additional diffusion compartment like Models 3 and 4. However, glucagon clearance is introduced at the injection area (compartment 1) with a time constant of k5 (min−1).
Model 6 has similar compartments to Models 1 and 2 and incorporates local clearance of k3 (min−1) at compartment 1. The intermediate compartment is represented by compartment 2 in the model. This model does not have a fast pathway from compartment 1 to the plasma (compartment 3).
Model 7 has the same structure as Model 6 and replaces the linear transport from compartment 1 to compartment 2 with a Michaelis–Menten function (saturation at high doses). The Michaelis–Menten parameters are the maximal transport rate k2 (mg/min) and the half-saturation amount k3 (mg). The rates of glucagon absorption are given by kc1 (min−1) at the administrative site (compartment 1) and kc2 (min−1) in the plasma (compartment 3).
Model 8 has a similar structure to Model 7. However, the nonlinear transport part leaving from the administrative site (compartment 1) is assumed to be a sigmoid function given by
 |
(3) |
where k1 (min−1) and k2 (min−1) represent the minimal and maximal transport rates, respectively; k3 (mg) represents the half-saturation amount; k4 (dimensionless) represents the changing slope of the transport rate curve; and k6 (min−1) represents the clearance rate of glucagon at compartment 1.
Fitting procedure
All of the nine datasets (without glucose interventions as described before) were used to fit each candidate of the proposed models. The lower boundaries for transport between compartments are set as 0.001, accounting for the fact that glucagon injection is promptly cleared from the circulation, and the upper boundaries are set as 0.05, functionally determined to avoid rapid spikes in the model output that are not present in the clinical data. The lower boundaries of clearance compartment(s) are set as 0.01 (a half-life of 70 min), and the upper boundaries are set as 0.5 (a half-life of 1.39 min) considering the physiology range of glucagon half-life in plasma (around 3–7 min).20,21
The method of least squares was adopted for data fitting, which was implemented in Matlab via the function of lsqnonlin. These models were represented by a series of ordinary differential equations solved numerically by Matlab. The cost function of optimization was defined as the sum of squared errors between the simulation output of the model and the clinical data at the sampled time points (the first datum point at time 0 was excluded). The optimal parameters of each patient were obtained when the cost function achieved its minimal value.
Model selection based on model identifiability
Thereafter, the parameter values were analyzed for model identifiability by first using the method of fractional SD (FSD) such that, for a specific parameter in the model, if the ratio of the SD of the estimated parameter divided by its mean value across the population does not exceed 100%, this parameter is designated as identifiable.22 In a second phase of the model identifiability analysis, a model was deemed unidentifiable if one or more of its optimal parameters were located on the parameter search boundaries.
Model selection based on information criteria comparison
The Bayesian information criterion (BIC), calculated from information on fitting accuracy, the number of parameters to be determined, and the number of sample data points, was adopted to determine which model has the a better performance over the other candidates. It is given by the following equation:
 |
(4) |
where N represents the count of sample points (the first data point at time 0 is excluded), k represents the number of parameters in the proposed model, and RSS represents the residual sum of squared errors. For each model candidate, BIC values are obtained through all the datasets and compared among the various models. A smaller value of BIC represents a better performing model.
Results
The values of model parameters were obtained by achieving the minimal cost function value for every dataset. For the analysis of model selection, the FSD values for parameter identifiability are presented in Table 2. The FSD values are adopted as the first step of model selection. As shown in Table 2, Models 2 and 5 have parameters whose FSD values are greater than 100%, which means that these corresponding parameters may not be identifiable. Thus, Models 2 and 5 were removed from the subsequent analysis.
Table 2.
Identifiability of Parameters
| |
|
Fractional SD of estimation (%) |
||||||
|---|---|---|---|---|---|---|---|---|
| Model | Identifiability | k1 | k2 | k3 | k4 | k5 | k6 | k7 |
| 1 | Yes | 29.43 | 70.62 | 0.70 | 0.091 | — | — | — |
| 2 | No | 22.90 | 108.35 | 57.26 | 117.56 | 10.82 | — | — |
| 3 | Yes | 83.65 | 37.67 | 54.43 | 43.24 | 26.72 | 0.90 | 0.96 |
| 4 | Yes | 25.82 | 54.90 | — | 40.27 | — | 0.046 | 6.2e–3 |
| 5 | No | 42.63 | 52.00 | 211.09 | 60.48 | 54.29 | 18.79 | — |
| 6 | Yes | 46.60 | 43.82 | 42.84 | 31.20 | — | — | — |
| 7 | Yes | 29.32 | 18.12 | 38.57 | 19.36 | 36.85 | — | — |
| 8 | Yes | 60.93 | 58.55 | 39.91 | 65.43 | 69.18 | 75.54 | 72.55 |
Second, whether optimal results are located on the search boundary of parameters is another criterion of model selection. In Table 2, there are small FSD values found in Models 1 (k3 and kc), 3 (k6 and kc), and 4 (k6 and kc), which means these results may hit the search boundary caused by a nonfeasible structure design. Thus, these parameters are not identifiable. For example, in Model 1, most k3 values in these subjects are located on the lower boundary (0.001). This value represents a half-life time of about 11.6 h. A longer half-life time (smaller transport rate) may not be observed in the current experimental settings. When a much slower glucagon release is required by data, the optimization of this model may keep hitting the lower boundaries. On the other hand, most of the optimal values of clearance rate in plasma (kc) are located on the upper boundary, which is set at 0.5 min−1 (corresponding to a lower boundary of half-life of 1.39 min). Therefore, these models may not be identifiable and are removed from the analysis in the next step.
Lastly, the model selection among the remaining candidates (Models 6–8) was performed by comparing their BIC values through the datasets (Table 3). Model 6 outperforms Model 7 for all BIC values and achieves about 70% improvements of the individual datasets over Model 8. Plus, Model 6 has the smallest sum of BIC values among them. Therefore, Model 6 (simple three compartments; glucagon cleared at both the administrative site and the plasma) is considered as the best choice of the proposed models.
Table 3.
Bayesian Information Criterion in Models 6–8
| Dataset | Model 6 | Model 7 | Model 8 | Model 6 vs. Model 7 | Model 6 vs. Model 8 |
|---|---|---|---|---|---|
| 1 | 336.10 | 339.08 | 326.65 | Better | Worse |
| 2 | 382.04 | 383.44 | 387.31 | Better | Better |
| 3 | 496.74 | 500.84 | 507.92 | Better | Better |
| 4 | 1069.56 | 1069.86 | 1041.85 | Better | Worse |
| 5 | 529.50 | 538.59 | 508.86 | Better | Worse |
| 6 | 475.11 | 476.81 | 483.87 | Better | Better |
| 7 | 418.24 | 435.06 | 438.68 | Better | Better |
| 8 | 372.34 | 381.45 | 389.62 | Better | Better |
| 9 | 1049.30 | 1094.13 | 1079.93 | Better | Better |
| Total | 5128.93 | 5219.26 | 5164.70 | Better | Better |
Discussion
The main goal of the current modeling effort is to develop a model that could operate within a simulation platform and be applied for the testing and design of dual-hormone glucose control strategies. It is therefore paramount that the model accurately represents the time course of plasma glucagon after frequent variable SC injections. We have proposed a series of candidate models with increasing complexity (in both parameter number and nonlinearity) and determined which model offered the best balance between complexity and accurate description of the data.
Of the proposed models, the simplest model (Model 1) has the structure of a widely applied SC insulin delivery model,18,19 whereas the more complex model candidates include additional diffusion compartments, clearance from the injection site, and/or nonlinear transport. It may be observed in Model 1 that the simple structure and the constraint on clearance in plasma result in poor identification such that most estimated values of k3 are located at the search boundary of 0.001 and values of kc are located at the boundary of 0.5. Similar results are observed in Models 3 and 4. This shows that glucagon removal in plasma is not compatible with the injection amount and that a slower transport from the administrative site may be required. However, under the current experimental settings as well as the overall duration of the study, such slow time constants (less than 0.001) are very imprecisely identified, and because of the absence of readily available physiological explanations, we consider that model structures necessitating such slow processes are likely inadequate.
Other methods exist to limit the transport rate, the most common of which is the use of Michaelis–Menten kinetics. Nonetheless, the use of Michaelis–Menten kinetics did not, in our analysis, improve the optimal results without an additional clearance at the administrative site as shown in Models 2–4 (Michaelis–Menten transport without local clearance; larger BIC values).
We therefore concluded that the inclusion of a clearance term (or deterioration of the molecule) was the optimal modeling solution to explain the observed data, a conclusion that was validated by smaller BIC values in the models including this term (Models 5–8). Moreover, some of the datasets demonstrate a possible nonlinear relation between the size of glucagon dose and its appearance in plasma, which may be the result of conformational change of glucagon aggregation.16,17 Thus, nonlinear forms of transport (Michaelis–Menten and sigmoid functions) are introduced in Models 7 and 8. However, these nonlinear representations were not able to improve the fitting.
Finally, Model 6 is chosen as the best representation of the glucagon transport. It includes three compartments: the injection site, an intermediate pool, and the plasma compartment. The underlying mechanisms of the local clearance and the intermediate transport are unclear at this stage. Nonetheless, we conjecture that they may be at least in part mediated by conformational transitions through aggregation as mentioned in Experimental Methods. Its parameter values demonstrate log-normal distributions (data not shown). The parameter kc represents the half-life of glucagon in plasma (5.21±1.77 min). Compared with the reported information from the pharmaceutical company (3–6 min)20 and the literature (6.6±0.5 min),21 the optimal parameters reside in the physiological range.
There are some limitations of this study due to the way data were collected: AP study versus pharmacokinetics/pharmacodynamics study. For example, in an AP trial, endogenous glucagon secretion is not inhibited and may confound the analysis. In addition, glucagon doses are delivered when the control algorithm detects risk for hypoglycemia, and, although glucagon counterregulation is impaired in T1DM,23 we cannot exclude the possibility of some endogenous secretion. Therefore, patients experiencing hypoglycemia during the study were removed from the analysis; nonetheless, some endogenous glucagon secretion was still detected in the remaining subjects. For example, in the second admission of subject 121, exogenous glucagon was not delivered before t=600 min; however, glucagon concentrations fluctuations were easily observed before the intervention, which indicates varying secretion around the basal state (a similar phenomenon found in the other subjects). Moreover, discrepancies in model fit and data also emerge around glucagon peak concentrations (subject 122, the second admission, at t=200 and 1,600 min). These discrepancies may be related to the concentrations of glucose and insulin, which may bring disturbances to endogenous glucagon secretion and affect the model fit. The correlation analysis of absolute values of simulation errors and concentrations of glucose and insulin in these two examples (121-2 and 122-2) shows that the absolute values of fitting errors may not have a significant correlation with insulin in both subjects (which agrees with the physiology because insulin levels are low in the pancreas of T1DM patients and have limited influence on glucagon secretion), whereas a significant positive relation exists between the errors and glucose concentrations (the significant P values are 0.051 and approximately 0, respectively). The correlation of fitting errors and glucose or insulin may be further investigated in a future study. It should be noted that it cannot be definitely shown that this is due to secretion and not model structure. Indeed, glucagon injection is driven by an algorithm informed by glucose measurements and historical insulin injection, triggering SC injection and therefore sharp glucagon concentration increases under conditions where an unimpaired regulatory system would secrete glucagon. In addition, the central nervous system also modulates glucagon secretion,24,25 which increases the complexity and difficulties of identifying a transport model. Efforts to limit these factors, although warranted for appropriate modeling, could also create nonphysiological experimental conditions (e.g., hyperinsulinemic clamp), which have their own pitfalls. A careful assessment of identical model structures in both physiological and nonphysiological conditions would lead to a deeper understanding of the influence of these factors on the fitted parameters and provide a better quantification of the parameters' distribution in the T1DM population. Moreover, glucagon inhibitors, such as octreotide or somatostatin, may be used in future studies to mitigate the confounding effect of endogenous glucagon secretion.
These conclusions are based on the analysis of a limited number of subjects. Although sufficient for model fitting and evaluation, this dataset is hardly representative of the entire T1DM population. Therefore, the parameter distributions are likely rough estimates of the true population variability. Future analysis of a larger number of patients will allow remediation of this limitation. Finally, a transport model is only one of the pieces needed for appropriate integration of glucagon within an automated system: a pharmacodynamics model of glucagon action, representing its stimulation effects on endogenous glucose production, would need to be combined with the proposed transport model. Studies using clamped insulin levels, stable tracers, or radiolabeled glucose can be performed to directly measure endogenous glucose production and link exogenous glucagon delivery to glucagon action. Such models are currently being developed for endogenous glucagon, and preliminary results have been reported by Dalla Man et al.26
Conclusions
In this article, we have proposed several pharmacokinetic models of exogenous glucagon transport from the administrative site to plasma and have selected the optimal model in terms of both data fit and parameter identifiability. This model may provide guidance for the time and amount of glucagon delivery for prevention of hypoglycemia in practice. Also, this model may be combined with other metabolic models (e.g., an insulin delivery model) to establish bihormonal closed-loop control for the maintenance of euglycemia in T1DM patients. This work will advance both algorithm design and preclinical simulations (in silico testing) in view of clinical implementations. This model (and an ad hoc in silico population generated from this work) has now been added to the University of Virginia–Padova T1DM simulation platform, which is accepted by the Food and Drug Administration as replacement for preclinical data supporting AP systems.
Acknowledgments
The authors thank Drs. E.R. Damiano from Boston University and S.J. Russell from Harvard Medical School for providing the data. This work was supported in part by JDRF grant 17-2011-273, NIH NIDDK grants RO1 DK082805 and R21 DK085641, and University of Virginia grant VICTR.
Author Disclosure Statement
No competing financial interests exist.
References
- 1.Cryer PE. The barrier of hypoglycemia in diabetes. Diabetes. 2008;57:3169–3176. doi: 10.2337/db08-1084. [DOI] [PMC free article] [PubMed] [Google Scholar]
- 2.Taborsky GJ., Jr The physiology of glucagon. J Diabetes Sci Technol. 2010;4:1338–1344. doi: 10.1177/193229681000400607. [DOI] [PMC free article] [PubMed] [Google Scholar]
- 3.Castle JR. Engle JM. El Youssef J. Massoud RG. Yuen KC. Kagan R. Ward WK. Novel use of glucagon in a closed-loop system for prevention of hypoglycemia in type 1 diabetes. Diabetes Care. 2010;33:1282–1287. doi: 10.2337/dc09-2254. [DOI] [PMC free article] [PubMed] [Google Scholar]
- 4.El-Khatib FH. Russell SJ. Nathan DM. Sutherlin RG. Damiano ER. A bihormonal closed-loop artificial pancreas for type 1 diabetes. Sci Transl Med. 2010;2:27. doi: 10.1126/scitranslmed.3000619. [DOI] [PMC free article] [PubMed] [Google Scholar]
- 5.Ward WK. Castle JR. El Youssef J. Safe glycemic management during closed-loop treatment of type 1 diabetes: the role of glucagon, use of multiple sensors, and compensation for stress hyperglycemia. J Diabetes Sci Technol. 2012;5:1373–1380. doi: 10.1177/193229681100500608. [DOI] [PMC free article] [PubMed] [Google Scholar]
- 6.Haidar A. Legault L. Dallaire M. Alkhateeb A. Coriati A. Messier V. Cheng P. Millette M. Boulet B. Rabasa-Lhoret R. Glucose-responsive insulin and glucagon delivery (dual-hormone artificial pancreas) in adults with type 1 diabetes: a randomized crossover controlled trial. CMAJ. 2013;185:297–305. doi: 10.1503/cmaj.121265. [DOI] [PMC free article] [PubMed] [Google Scholar]
- 7.Cryer PE. Hypoglycemia risk reduction in type 1 diabetes. Exp Clin Endocrinol Diabetes. 2001;109(Suppl 2):S412–S423. doi: 10.1055/s-2001-18599. [DOI] [PubMed] [Google Scholar]
- 8.Cryer PE. Hypoglycemia: still the limiting factor in the glycemic management of diabetes. Endocr Pract. 2008;14:750–756. doi: 10.4158/EP.14.6.750. [DOI] [PubMed] [Google Scholar]
- 9.Heptulla RA. Rodriguez LM. Bomgaars L. Haymond MW. The role of amylin and glucagon in the dampening of glycemic excursions in children with type 1 diabetes. Diabetes. 2005;54:1100–1107. doi: 10.2337/diabetes.54.4.1100. [DOI] [PubMed] [Google Scholar]
- 10.Kovatchev BP. Breton M. Dalla Man C. Cobelli C. In silico preclinical trials: a proof of concept in closed-loop of type 1 diabetes. J Diabetes Sci Technol. 2009;3:44–55. doi: 10.1177/193229680900300106. [DOI] [PMC free article] [PubMed] [Google Scholar]
- 11.Sorensen J. Cambridge, MA: Massachusetts Institute of Technology; 1985. A physiological model of glucose metabolism in man, its use to design, assess improved insulin therapies for diabetes [PhD thesis] [Google Scholar]
- 12.Markakis MG. Mitsis GD. Marmarelis VZ. Computational study of an augmented minimal model for glycaemia control. Conf Proc IEEE Eng Med Biol Soc. 2008;2008:5445–5448. doi: 10.1109/IEMBS.2008.4650446. [DOI] [PubMed] [Google Scholar]
- 13.Marmaerlis VZ. Modeling methodology for nonlinear physiological systems. Ann Biomed Eng. 1997;25:239–251. doi: 10.1007/BF02648038. [DOI] [PubMed] [Google Scholar]
- 14.Dalla Man C. Rizza RA. Cobelli C. Meal simulation model of the glucose-insulin system. IEEE Trans Biomed Eng. 2007;54:1740–1749. doi: 10.1109/TBME.2007.893506. [DOI] [PubMed] [Google Scholar]
- 15.Fisher M. Sherwin RS. Hendler R. Felig P. Kinetics of glucagon in man: effects of starvation. Proc Natl Acad Sci U S A. 1976;73:1735–1739. doi: 10.1073/pnas.73.5.1735. [DOI] [PMC free article] [PubMed] [Google Scholar]
- 16.Swann J. Hammes G. Self-association of glucagon. Equilibrium studies. Biochemistry. 1969;8:41–58. doi: 10.1021/bi00829a001. [DOI] [PubMed] [Google Scholar]
- 17.Chou P. Fasman G. The conformation of glucagon: predictions and consequences. Biochemistry. 1975;14:2536–2541. doi: 10.1021/bi00682a037. [DOI] [PubMed] [Google Scholar]
- 18.Nucci G. Cobelli C. Models of subcutaneous insulin kinetics. A critical review. Comput Methods Programs Biomed. 2000;62:249–257. doi: 10.1016/s0169-2607(00)00071-7. [DOI] [PubMed] [Google Scholar]
- 19.Dalla Man C. Raimondo DM. Rizza RA. Cobelli C. GIM, simulation software of meal glucose-insulin model. J Diabetes Sci Technol. 2007;1:323–330. doi: 10.1177/193229680700100303. [DOI] [PMC free article] [PubMed] [Google Scholar]
- 20.www.rxmed.com/b.main/b2.pharmaceutical/b2.1.monographs/CPS-%20Monographs/CPS-%20(General%20Monographs-%20G)/GLUCAGON%20INJECTION.html. [Jan 6;2013 ]. www.rxmed.com/b.main/b2.pharmaceutical/b2.1.monographs/CPS-%20Monographs/CPS-%20(General%20Monographs-%20G)/GLUCAGON%20INJECTION.html
- 21.Alford FP. Bloom SR. Nabarro JDN. Glucagon metabolism in man. Studies on the metabolic clearance rate and the plasma acute disappearance time of glucagon in normal and diabetic subjects. J Clin Endocrinol Metab. 1976;42:830–838. doi: 10.1210/jcem-42-5-830. [DOI] [PubMed] [Google Scholar]
- 22.Bergman RN. Ziya Ider Y. Bowden CR. Cobelli C. Quantitative estimation of insulin sensitivity. Am J Physiol. 1979;236:E667–E677. doi: 10.1152/ajpendo.1979.236.6.E667. [DOI] [PubMed] [Google Scholar]
- 23.Lorenzi M. Bohannon N. Tsalikian E. Karam JH. Duration of type 1 diabetes affects glucagon and glucose responses to insulin-induced hypoglycemia. West J Med. 1984;141:467–471. [PMC free article] [PubMed] [Google Scholar]
- 24.Taborsky G., Jr Mundinger T. Minireview: the role of the autonomic nervous system in mediating the glucagon response to hypoglycemia. Endocrinology. 2012;153:1055–1062. doi: 10.1210/en.2011-2040. [DOI] [PMC free article] [PubMed] [Google Scholar]
- 25.Beall C. Ashford ML. McCrimmon RJ. The physiology and pathophysiology of the neural control of the counterregulatory response. Am J Physiol Regul Integr Comp Physiol. 2012;302:R215–R223. doi: 10.1152/ajpregu.00531.2011. [DOI] [PubMed] [Google Scholar]
- 26.Micheletto F. Dalla Man C. Kovatchev BP. Cobelli C. The updated University of Virginia/Padova type 1 diabetes simulator [abstract A94] J Diabetes Sci Technol. 2012;7:281–284. [Google Scholar]