

Summary
Mithramycin and chromomycin A3 are two structurally related antitumour compounds, which differ in the glycosylation profiles and functional group substitutions of the sugars. Chromomycin contains two acetyl groups, which are incorporated during the biosynthesis by the acetyltransferase CmmA in Streptomyces griseus ssp. griseus. A bioconversion strategy using an engineered S. griseus strain generated seven novel acetylated mithramycins. The newly formed compounds were purified and characterized by MS and NMR. These new compounds differ from their parental compounds in the presence of one, two or three acetyl groups, attached at 3E, 4E and/or 4D positions. All new mithramycin analogues showed antitumour activity at micromolar of lower concentrations. Some of the compounds showed improved activities against glioblastoma or pancreas tumour cells. The CmmA acetyltransferase was located in the cell membrane and was shown to accept several acyl‐CoA substrates. All these results highlight the potential of CmmA as a tool to create structural diversity in these antitumour compounds.
Introduction
Mithramycin 1 (Fig. 1) is an antitumour compound of the aureolic acid family produced by Streptomyces argillaceus (Rohr et al., 1999), which was discovered in 1961 and approved for use as anticancer drug in 1970 (Newman and Cragg, 2007). It has been used clinically for the treatment of several types of cancer, including testicular carcinoma, chronic myeloid leukaemia and acute myeloid leukaemia and also for the control of hypercalcaemia in patients with malignant diseases (Remers, 1979; Skarbek and Speedie, 1981). More recently, renewed interest for 1 is growing because of its potential new applications. It has been found that 1 could be used in combination with bevacizumab, a neutralizing antibody against VEGF (Vascular Endothelial Growth Factor), as a novel antiangiogenic therapy for pancreatic cancer and other cancers (Jia et al., 2007). Moreover, 1 has revealed to be a neuroprotective drug, possessing potential application as neurological therapeutics, and for the alleviation of symptoms underlying β‐thalassaemia and sickle cell anaemia due to its activity as inducer of erythrocitic cell differentiation (Chatterjee et al., 2001; Fibach et al., 2003). The antitumour properties of 1 are due to its inhibitory effects on replication and transcription processes during macromolecular biosynthesis by interacting, in the presence of Mg2+, with GC‐rich nucleotide sequences located in the minor groove of DNA (Sastry and Patel, 1993; Sastry et al., 1995; Barcelo et al., 2007). As a consequence it blocks the binding of proteins to GC‐rich sequences in gene promoters, and inhibits transcription of genes regulated by these factors, such as those regulated by the Sp1 family of transcription factors (Miller et al., 1987; Ray et al., 1989; Blume et al., 1991; Snyder et al., 1991).
Figure 1.
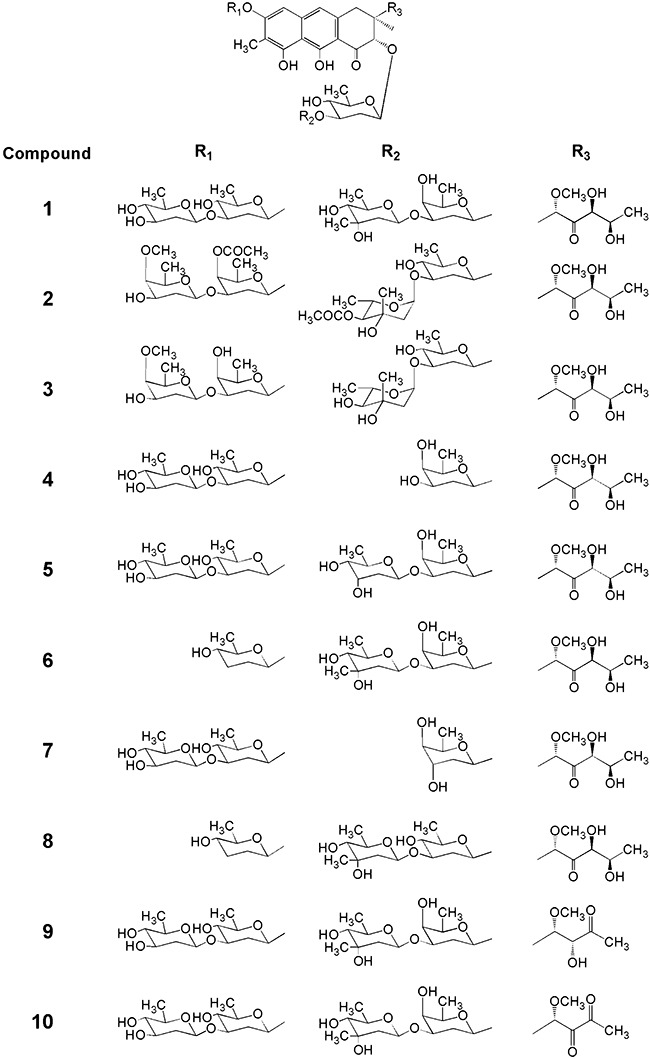
Chemical structures of compounds used as substrates in this work: mithramycin 1, Chromomycin A32, 4A,4E‐O‐dideacetyl‐chromomycin A33, demycarosyl‐mithramycin 4, demycarosyl‐3D‐β‐d‐digitoxosyl‐mithramycin 5, dideolivosyl‐6‐β‐d‐amicetosyl‐mithramycin 6, deoliosyl‐demycarosyl‐3C‐β‐d‐boivinosyl‐mithramycin 7, dideolivosyl‐6‐β‐d‐amicetosyl‐deoliosyl‐3C‐β‐d‐olivosyl‐mithramycin 8, mithramycin SK 9 and mithramycin SDK 10.
Chromomycin A32 (Fig. 1) is an antitumour compound structurally related to 1, but differing in the glycosylation pattern. Mithramycin contains a trisaccharide of d‐olivose, d‐oliose and d‐mycarose, and a disaccharide of d‐olivose, while 2 contains a trisaccharide of d‐olivose, d‐olivose and 4‐O‐acetyl‐l‐chromose B, and a disaccharide of 4‐O‐acetyl‐d‐oliose and 4‐O‐methyl‐d‐oliose attached at positions 2 and 6 of the aglycone respectively. These differences in the stereochemistry and functional group substitutions of the sugars are expressed in the binding properties of these compounds to DNA (Majee et al., 1997; Mir et al., 2003). Thus, the acetoxy groups in d‐oliose (sugar A) and l‐chromose B (sugar E) in 2 provide additional H‐bonds with the 2‐amino groups of G‐bases and thus adding more specificity to the DNA binding (Silva and Kahne, 1993; Silva et al., 1993; Majee et al., 1997; Chakrabarti et al., 2001). This is also shown in their antitumour activities, where 2 is approximately 10 times more active than 1 against several tumour cell lines (Menéndez et al., 2004a; Pérez et al., 2008). We have cloned and characterized the gene cluster involved in the biosynthesis of 2 (Menéndez et al., 2004a,b; 2006; 2007). It contains the cmmA gene, which encodes the acetyltransferase responsible for transferring both acetyl groups to d‐oliose and l‐chromose B during 2 biosynthesis (Menéndez et al., 2004b). Inactivation of cmmA leads to the accumulation of 4A,4E‐O‐dideacetyl‐chromomycin A3 (3) (Fig. 1), which differs from the parental compound by lacking the two acetyl groups, and being approximately 100 times less active, which confirms the importance of the acetyl groups for the antitumour activity of 2 (Menéndez et al., 2004b).
In this article we report the use of CmmA to increase the structural diversity of mithramycins and to generate novel mithramycins with antitumour activity. We also show that CmmA is located in the cell membrane and exhibits substrate flexibility using different acyl‐CoAs as donor substrates.
Results and discussion
Generation of acetylated analogues of mithramycin by bioconversion
Two sugars (l‐chromose B and one d‐oliose) in 2 are acetylated at the C4 hydroxyl groups (Fig. 1). These acetyl groups are incorporated into the molecule by the chromomycin acetyltransferase CmmA (Menéndez et al., 2004b). Since these groups greatly increase the antitumour activity of 2, we decided to use CmmA in order to generate acetylated derivatives of 1 with high antitumour activity. To achieve this, we performed a bioconversion experiment by growing the wild‐type strain Streptomyces griseus ssp. griseus (chromomycin A3 producer) that was subsequently fed with 1. These cultures were then extracted and analysed by HPLC‐MS. In addition to 1, a new peak was detected showing the same absorption spectrum than 1, but with higher retention time and an m/z value in positive mode of 1128 (data not shown). This is in agreement with compound 1 with one acetyl group attached. We also tested if this acetylation event was CmmA‐dependent by running a bioconversion experiment using S. griseus C10A as host (cmmA‐ mutant). No acetylated mithramycin was obtained in these conditions confirming that CmmA is required for this acetylation process (data not shown). This result showed that CmmA was flexible enough to be able to acetylate 1. The bioconversion efficiency using the wild‐type strain was rather low (approximately 14%). Most probably this was due to the fact that the acetyltransferase CmmA has more affinity to its genuine substrate and/or was mainly committed to the biosynthesis of 2. With the aim of improving the production of acetylated derivatives of 1, we tested the bioconversion efficiencies as biocatalysts of different mutant strains of S. griseus affected in biosynthesis of 2. These mutants (C60GI, C10GII, G10GIII and G10GIV; Fig. 2) expressed the acetyltransferase CmmA but were blocked in glycosylation steps taking place before the acetylation of sugars, and therefore preventing the synthesis of potential natural substrates for CmmA. When any of these mutants was used in bioconversion experiments with 1 as substrate, higher production of monoacetylated mithramycin 11 was obtained. Since S. griseus C10GIV was more efficient than the other mutant strains in the bioconversion experiments (35% of conversion, Fig. 3A), it was selected as biocatalyst for further experiments.
Figure 2.
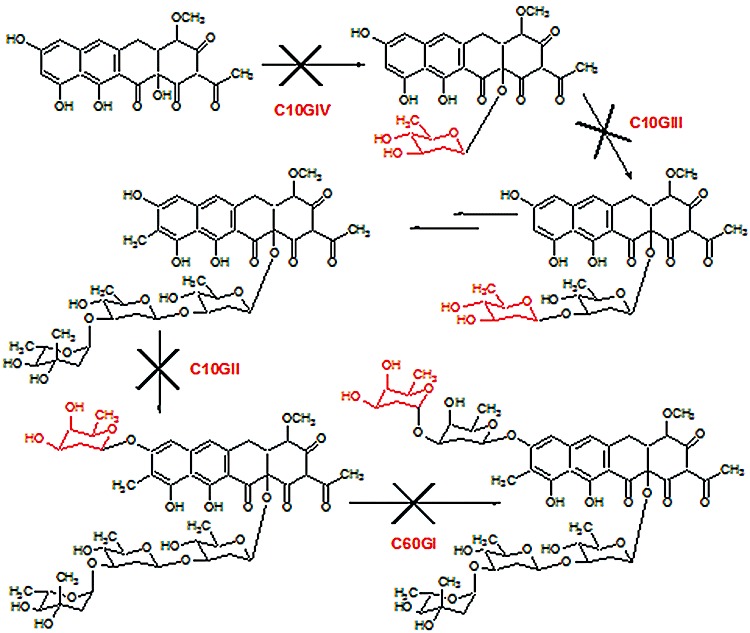
Scheme showing the glycosylation steps blocked during chromomycin biosynthesis in mutants S. griseus C60GI, C10GII, C10GIII and C10GIV.
Figure 3.
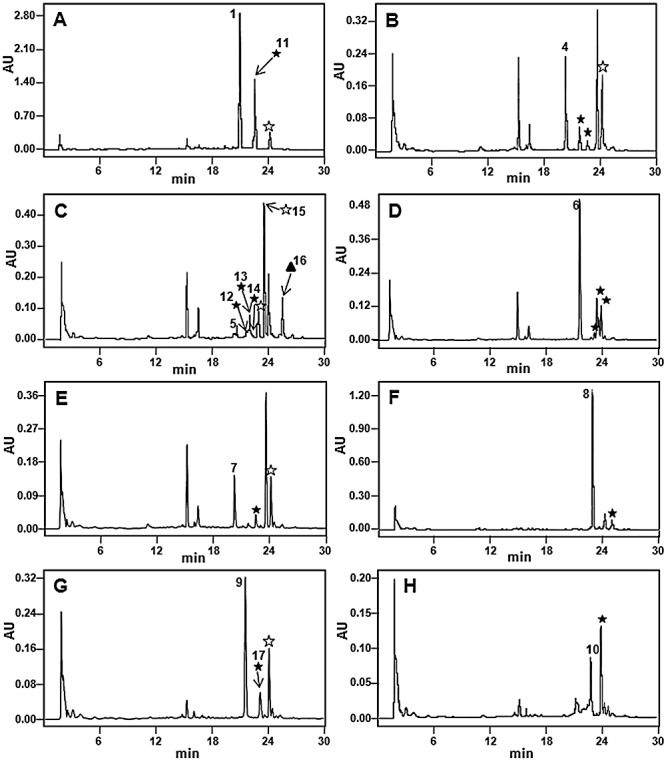
HPLC analyses of cultures of S. griseus C10GIV fed with: (A) mithramycin 1; (B) demycarosyl‐mithramycin 4; (C) demycarosyl‐3D‐β‐d‐digitoxosyl‐mithramycin 5; (D) dideolivosyl‐6‐β‐d‐amicetosyl‐mithramycin 6; (E) deoliosyl‐demycarosyl‐3C‐β‐d‐boivinosyl‐mithramycin 7; (F) dideolivosyl‐6‐β‐d‐amicetosyl‐deoliosyl‐3C‐β‐d‐olivosyl‐mithramycin 8; (G) mithramycin SK 9; and (H) mithramycin SDK 10. Acetylated derivatives with one (★), two ( ) or three (▴) acetyl groups. Compounds 11 to 17 are bioconversion products and were purified and characterized (see Fig. 4 for chemical structures).
Our next goal was to generate acetylated derivatives of different analogues of 1, which differ from 1 either in the glycosylation pattern (Fig. 1, compounds 4 to 8) or in the structure of the aglycone side‐chain (Fig. 1, compounds 9 and 10). Streptomyces griseus C10GIV was fed with all these compounds independently and the cultures were analysed by HPLC and HPLC‐MS (Fig. 3B–H). In all the cases new peaks were detected which corresponded to monoacetylated derivatives, as deduced from the higher retention times and masses of the novel compounds, differing in 42 units in comparison with the respective substrates. These mass changes are consistent with the incorporation of a single acetyl group to the compound. Bioconversions with some compounds led to the formation of several derivatives with the same mass (monoacetylated), but with different retention times (compounds 4, 5 and 6 shown in Fig. 3B, C and D), suggesting that acetylations took place in different positions of the substrates. Moreover, bioconversions with compounds 4, 5, 7 and 9, and also 1 resulted in the generation of compounds with mass differing in 84 units from the corresponding substrates, being consistent with the generation of derivatives with two acetyl groups attached (Fig. 3A, C, E and G). Also, an analogue of compound 5 was obtained with an m/z value in positive mode of 1197 (peak 16 in Fig. 3C), which is consistent with the incorporation of three acetyl groups to compound 5.
Isolation and structure elucidation of selected compounds
Some acetylated compounds were selected for purification and further characterization. Selection was mainly based on the antitumour activity of the parental compounds, but also considering the yields and the possible structural diversity of the acetylated derivatives. In total we purified seven compounds: one derivative from 1 (compound 11, Fig. 3A), five from 5 (compounds 12 to 16, Fig. 3C) and one from 9 (compound 17, Fig. 3G). These compounds were purified by preparative HPLC from cultures of S. griseus C10GIV fed with the corresponding substrates. The acetylated compounds were initially identified by HPLC‐MS analyses by comparing the UV absortion spectrum and analysing the mass of the molecular ion. For the new derivative obtained from 1 (compound 11) a molecular formula of C54H78O25 (m/z: 1128) was deduced, indicating the incorporation of one acetyl group into the trisaccharide moiety. Similarly, mass spectra of the five derivatives isolated from 5 revealed three monoacetylated derivatives (compounds 12 to 14) with a molecular formula of C53H76O25 (m/z: 1114), one diacetylated derivative (compound 15) with a molecular formula of C56H80O25 (m/z: 1156) and one triacetylated derivative (compound 16) with a molecular formula of C58H82O26 (m/z: 1198), all of them acetylated in the trisaccharide chain. The compound 17 isolated from 9 showed a molecular formula of C53H76O24 (m/z: 1098), indicating the presence of one acetyl group in the trisaccharide chain again. Final identification of the novel compounds was carried out by 1H mono‐ and bidimensional NMR experiments (COSY, TOCSY) (see Supporting information). The acetylated positions in the novel analogues were identified by comparing the corresponding spectra with those previously described for compounds 1, 5 and 9 (Wohlert et al., 1999; Remsing et al., 2003; Baig et al., 2008). The chemical structures of the isolated compounds are shown in Fig. 4.
Figure 4.
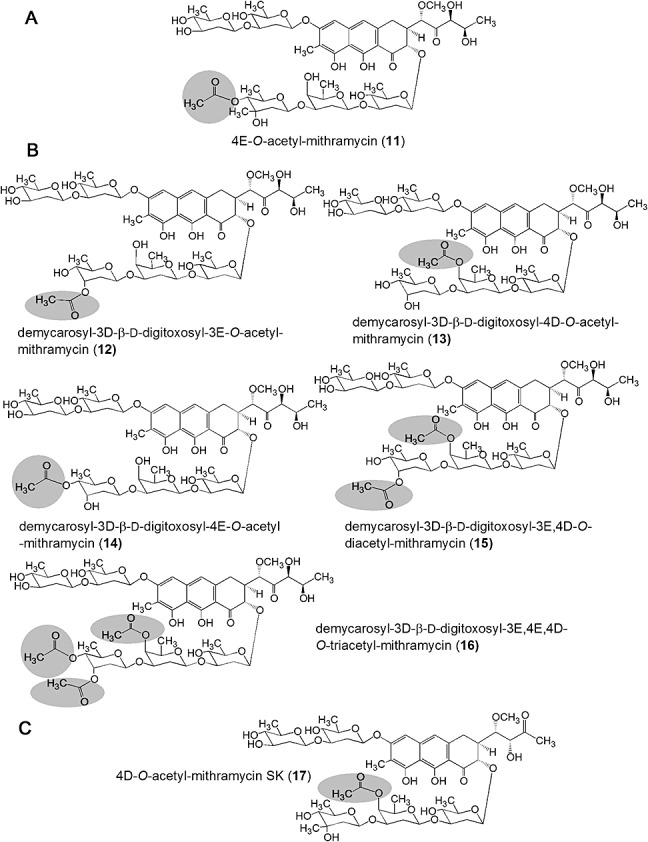
Chemical structures of new acetylated derivatives of (A) mithramycin 1, (B) demycarosyl‐3D‐β‐d‐digitoxosyl‐mithramycin 5 and (C) mithramycin SK (9). Acetyl groups are highlighted with circles.
These new compounds differ from the parental compounds in the presence of one, two or three acetyl groups attached at specific positions of different sugars of the saccharide chains. Three different hydroxyl groups in mithramycins were susceptible of being acetylated by CmmA, those located at C3 and C4 of sugar E and the one at position C4 of sugar D. Acetylation at 3E occurred when d‐digitoxose was the distal sugar of the trisaccharide chain instead of d‐mycarose, as it happens in 5; it is likely that the presence of the C‐methyl group at C3 in d‐mycarose prevents the access of CmmA to that position. In chromomycins, the 4E hydroxyl group is the most common acetylated position. On the contrary, no chromomycin has been identified yet with an acetyl group at 3E (Menéndez et al., 2004b; 2006). Most probably, the existence of a C‐methyl group at C3 in l‐chromose B (sugar E) in 2 would prevent the acetylation event. On the other hand, 4D position is susceptible to acetylation in mithramycins but not in chromomycins. This could be explained because sugar D in mithramycins is a d‐oliose while in chromomycins is a d‐olivose. These two sugars only differ in the configuration of the hydroxyl group at C4, axial in the former and equatorial in the latter, which highlights the importance of the configuration of that hydroxyl group to be acetylated. On the contrary, no compound was produced with acetyl groups in the disaccharide chain of 1 or its derivatives. This is in contrast to what happens in 2 where the 4A position is normally acetylated, and the 3A and 4B positions are occasionally acetylated (Menéndez et al., 2004b). These differences could be also explained by the different sugar configuration of the disaccharide chain in both compounds, consisting of d‐olivoses in 1 and in some analogues, and d‐olioses in 2. In summary, based on the structures of known chromomycins and acetylated mithramycin compounds reported in this article, it seems that CmmA has preference for hydroxyl groups in axial configuration and not for those in equatorial configurations, unless these are located at the third sugar of the trisaccharide chain; approximately 59% of acetylated mithramycin compounds obtained by bioconversion are acetylated at hydroxyl groups in axial configuration, versus 39% in equatorial configuration.
The generation of different types of acetylated mithramycins indicates that CmmA shows substrate acceptor flexibility, both regarding the position and type of sugar acetylated and also regarding the structure of the side‐chain of the aglycone. In this respect, we were able to generate acetylated derivatives of mithramycins independently of the structure and length of their side‐chain.
Antitumour activity
The antitumour activity of the new mithramycin analogues was tested against four tumour cell lines (Table 1). Compilation of the average GI50 (50% of growth inhibition) values showed that all of the compounds were active at micromolar concentrations and most of them were also active at 0.1 µM or lower. In general, all compounds were less active against glioblastoma cancer cells. This was particularly noticeable for compounds 12 and 15. This different behaviour could be ascribed to differences in gene expression patterns that are specific to each cell line (Ertel et al., 2006). Compound 12 showed improved activity against colon cancer cells (about five times higher activity than the parent compound 5). Moreover, compound 14 was particularly active against glioblastoma cancer cells in relation to its parent compound (activity up to five times higher than that of compound 5 from which it derives), and compounds 12, 13 and 16 were better against pancreas tumour cells (about five times more active than the parent compound 5). This could be particularly important since glioblastoma is one of the most common tumours of the central nervous system, and despite many efforts to overcome this aggressive disease the median survival for patients with glioblastoma is only 1 year (Shrieve et al., 1999). On the other hand, the treatment of pancreatic cancer remains elusive; in spite of treatment, < 5% of patients remain alive after 5 years (Chua and Zalcberg, 2008). Therefore, development of new compounds with high activity against pancreatic tumours is currently most demanding Interestingly, most of those mithramycins with improved activities bear one acetyl group (e.g. compounds 12, 13, 14), but there were other compounds with two or three acetyl groups (e.g. compound 16). This indicates that apparently there is no correlation between the number of acetyl groups and the antitumour activity.
Table 1.
Antitumour activity of compounds.
| Tumour cell lines | GI50 (µM) | |||||||||
|---|---|---|---|---|---|---|---|---|---|---|
| 1 | 11 | 5 | 12 | 13 | 14 | 15 | 16 | 9 | 17 | |
| Glioblastoma T98G | 0.35 | 0.22 | 0.36 | 1.81 | 0.34 | 0.07 | 1.59 | 0.31 | 0.35 | 0.52 |
| NSCL A549 | 0.03 | 0.05 | 0.06 | 0.03 | 0.04 | 0.03 | 0.03 | 0.03 | 0.02 | 0.05 |
| Colon H116 | 0.02 | 0.01 | 0.05 | 0.01 | 0.03 | 0.03 | 0.03 | 0.02 | 0.02 | 0.01 |
| Pancreas PSN1 | 0.02 | 0.05 | 0.05 | 0.01 | 0.01 | 0.02 | 0.02 | 0.01 | 0.02 | 0.05 |
GI50, 50% growth inhibition; NSCL, non‐small cell lung.
Localization and in vitro assay of CmmA
In order to in vitro assay CmmA, its coding gene was subcloned in pEM4T under the control of the erythromycin resistance promoter (ermE*p) and expressed in Streptomyces albus. Correct expression of cmmA in this strain (S. albus pEM4TCmmA) was verified by carrying out a bioconversion experiment using as substrate 4A,4E‐O‐dideacetylchromomycin A33, its natural substrate. This was readily converted into 2, while a S. albus strain containing an empty vector was unable to carry out that bioconversion (data not shown). Next, localization of CmmA in the hyphae was attempted. Mycelia from S. albus pEM4TCmmA and S. albus pEM4T (as control) were fractionated into soluble and membrane fractions and the fractions were analysed by Western blotting using anti‐CmmA serum. No positive signals were shown in fractions from S. albus pEM4T (Fig. 5A). However, positive signals were detected in the membrane fractions but not in the soluble fraction of S. albus pEM4TCmmA (Fig. 5A), which is consistent with the location of CmmA in the cell membrane. These fractions were also tested for acetyltransferase activity using an in vitro assay. Again, fractions from the control strain did not shown acetyltransferase activity (data not shown). However, cell‐free extracts and membrane but not soluble fractions from S. albus pEM4TCmmA were able to acetylate 3 generating 2, in the presence of acetyl‐CoA (Fig. 5B). In this reaction two other compounds were also produced that could correspond to monoacetylated derivatives of 3, since their masses were consistent with the incorporation of a single acetyl group to 3. These results clearly demonstrate that CmmA is located and active in the cell membrane. This location is consistent with the idea that in the biosynthesis pathway of chromomycin A3 acetylation of sugars is one of the latest biosynthesis steps, taking place in close relation to its secretion.
Figure 5.
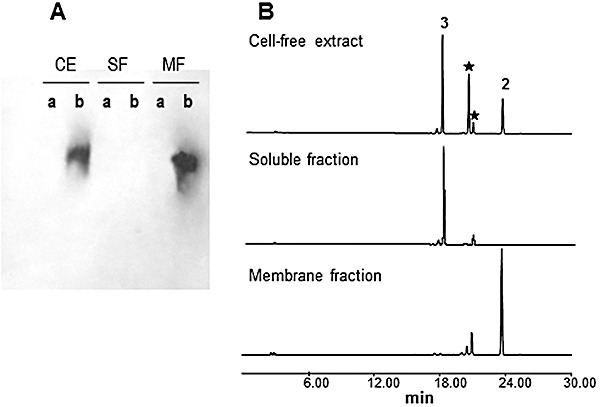
Localization and in vitro assay of CmmA. A. Western analysis of cell‐free extracts (CE), soluble fraction (SF) and membrane fraction (MF) using anti‐CmmA serum. a, control S. albus (pEM4T); b, S. albus (pEM4TcmmA). B. Analysis by HPLC of products from in vitro assays using acetyl‐CoA and 4A,4E‐O‐dideacetyl‐chromomycin A3 as substrates and cell‐free extract, soluble fraction and membrane fraction of S. albus (pEM4TcmmA) as a source of CmmA. 2, chromomycin A3; 3, 4A,4E‐O‐dideacetyl‐chromomycin A3; (★) monoacetylated derivatives of 3.
We also tested the possibility of CmmA to use different donor substrates. We screened short straight‐ and branched‐chain acyl‐CoAs (C3 and C4). Of all acyl‐CoA donors tested only C3 chain acyl‐CoAs (isobutyryl‐ and propionyl‐CoA) were utilized by CmmA, whereas longer‐chain‐length acyl‐CoAs (isovaleryl‐, isobutyryl‐CoA and β‐methylcrotonyl‐CoA) were not. When isobutyryl‐CoA was used, a new peak with a higher retention time and an m/z value in positive mode of 1169 was produced (Fig. 6A), which is consistent with the incorporation of an isobutyryl group to 3. When the donor substrate was propionyl‐CoA, two new compounds were produced that showed higher retention times than 3 (Fig. 6B), and with m/z values in positive mode of 1155 and 1211. These masses were consistent with the incorporation of one and two propionyl groups to 3 respectively. Propionyl‐ and Isobutiryl‐CoA were not used with the same efficiency by CmmA, being the former better substrate than the latter. As shown in Fig. 6, the use of propionyl‐CoA in the reaction led to the complete acylation of compound 3, with the generation of derivatives with one and two propionyl groups. However, when isobutiryl‐CoA was used approximately half of compound 3 remained non‐acylated and only one derivative with one isobutiryl group was generated. Isobutiryl‐CoA differs from propionyl‐CoA by the presence of a methyl group at C2, which makes it bulkier and thus probably interfering in its interaction with the active site of the enzyme. These experiments demonstrate that CmmA has some tolerance towards its donor substrate. CmmA shows similarity to other acyltransferases involved in tailoring steps of antibiotics biosynthesis. Some of these acyltransferases (MdmB, AcyA and Asm19) have also shown considerable substrate tolerance for the acyl donor, but they were quite specific towards the acceptor substrate (Hara and Hutchinson, 1992; Arisawa et al., 1994; Moss et al., 2002). On the contrary, CmmA is also able to acylate different substrates and at different positions, showing broader acceptor substrate flexibility. This highlights the potential of CmmA as a tool to create structural diversity and therefore to generate novel antitumour compounds.
Figure 6.
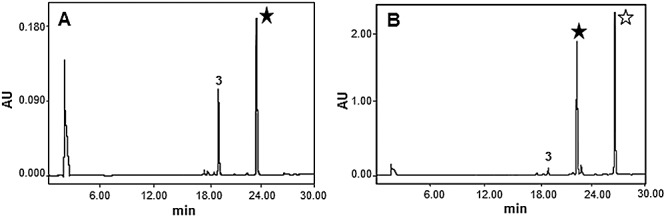
In vitro assays of CmmA using different acyl‐CoA donors. Analysis by HPLC of reaction products using membrane fraction, 4A,4E‐O‐dideacetyl‐chromomycin A33, and (A) isobutyryl‐CoA or (B) propionyl‐CoA as acyl‐CoA donor substrates. 4A,4E‐O‐dideacetyl‐chromomycin A3 derivatives with one (★) or two ( ) acyl groups.
Experimental procedures
Strains, culture conditions, plasmids and DNA manipulation
Several strains were used as biocatalysts for bioconversion experiments: S. griseus ssp. griseus ATCC 13273, chromomycin A3 producer, and the S. griseus mutant strains C60GI, C10GII, G10GIII and G10GIV, each one affected in a glycosyltransferase gene of the chromomycin biosynthesis gene cluster (Fig. 2) (Menéndez et al., 2006). Streptomyces albus J1074 (ilv‐1, sal‐2; Kieser et al., 2000) was used as host for expression of cmmA. Several S. griseus and S. argillaceus recombinant strains were used to prepare substrates for bioconversion experiments and enzyme assays (see Fig. 1): S. griseus C10A to produce 3 (Menéndez et al., 2004b); S. argillaceus ATCC12956 for 1; S. argillaceus (pMP3*BII) for 4 and 5; S. argillaceus (pFL845) for 6; S. argillaceus (pMP1*BII) for 7; S. argillaceus M7U1 (pFL845) for 8 (Baig et al., 2008; Pérez et al., 2008); and S. argillaceus M7W1 for 9 and 10 (Remsing et al., 2003; Albertini et al., 2006). For sporulation on solid medium, the organisms were grown at 30°C on plates containing A medium (Fernández et al., 1998), supplemented with 25 µg ml−1 thiostrepton when appropriate. For growth in liquid medium, the organisms were grown either in TSB medium (trypticase soya broth; Oxoid) or in R5A medium (Fernández et al., 1998), supplemented with 5 µg ml−1 thiostrepton when appropriate. pEM4T was used for expressing genes in Streptomyces (Menéndez et al., 2006). Escherichia coli DH10B (Invitrogen) was used as a host for subcloning. Plasmid pQE60CmmA was used as source of cmmA (N. Menéndez, unpublished). DNA manipulations were performed according to standard techniques for E. coli (Sambrook and Russell, 2001) and Streptomyces (Kieser et al., 2000).
PCR amplification and gene expression
For amplification of cmmA, pQE60cmmA was used as DNA template and the following oligoprimers: 5′‐GGACTAGTCCTAGGGGACGAAAGAGGCAGGATG‐3′ (SpeI and AvrII sites underlined) and 5′‐GCTCTAGATCAGTGGTGGTGGTGGTGGTG‐3′ (XbaI site underlined). PCR conditions were as follows: 100 ng of template DNA was mixed with 30 pmol of each primer and 1.25 units of Pfx DNA polymerase (Invitrogen) in a total reaction volume of 50 µl containing 2 µM each dNTP, 10 mM KCl, 10 mM (NH4)2SO4, 20 mM Tris‐HCl (pH 8.8), 2 mM MgSO4 and 0.1% Triton X‐100. The polymerization reaction was performed in a thermocycler (MiniCycler; MJ Research) under the following conditions: an initial denaturation of 2 min at 94°C; 30 cycles of 15 s at 94°C, 30 s at 55°C and 1 min at 68°C; after the 30 cycles, an extra extension step of 5 min at 68°C and another of 15 min at 4°C were added. After PCR amplification, the amplicon containing cmmA was digested with SpeI and XbaI, treated with Klenow polymerase and subcloned into the EcoRI site pre‐treated with Klenow polymerase of pEM4T. In the resultant plasmid (pEM4TcmmA), cmmA is under the control of the ermE*p.
Bioconversion experiments
Streptomyces griseus wild type or the appropriate mutant strain was cultivated in TSB liquid medium with shaking at 30°C for 24 h. One hundred microlitres of the resultant cultures were used as pre‐inoculum to inoculate Erlenmeyer flasks containing 5 ml of R5A liquid medium. After 24 h of incubation, 15 µg per ml of the substrate (final concentration) was added, and further incubation was carried out for 24 h. In the case of mutants S. griseus C10GIII and S. griseus C10GIV, cultures were supplemented with 2 µg ml−12 (final concentration) in order to induce expression of chromomycin biosynthesis genes (Menéndez et al., 2006). After incubation, samples (1 ml) were extracted with 1 volume of ethyl acetate: formic acid (100:1). Organic extracts were dried under vacuum, and residues were eventually dissolved in a small volume of methanol before HPLC analysis.
HPLC analysis and purification of novel compounds
Chromatographic analyses were performed by HPLC‐MS as previously described (Olano et al., 2009), except that bidimensional chromatograms were extracted at 280 nm. Acetylated derivatives were obtained in bioconversion experiments in R5A medium supplemented with 15 µg ml−1 of the precursor molecule. Approximately 1.2 l of culture was prepared to obtain 4E‐O‐acetyl‐mithramycin 11, whereas the derivatives of 5 were obtained from 5 l of culture. In both cases, the cultures were centrifuged and the supernatants were filtered and applied to a solid‐phase extraction cartridge (Sep‐Pak Vac C18, 10 g, Waters). The retained material was eluted with a mixture of methanol and 0.05% trifluoroacetic acid (TFA) in water. A linear gradient from 0 to 100% methanol in 60 min, at 10 ml min−1, was used. Fractions were taken every 5 min and analysed by UPLC. Fractions containing the desired compounds were neutralized with 3 ml of 0.1 M phosphate buffer (pH 7.0) and evaporated in vacuo. The resulting extracts were redissolved in a small volume of a mixture of DMSO and methanol (50:50) and the products were purified by preparative HPLC using a SunFire C18 column (10 × 250 mm, Waters). Compounds were chromatographed with mixtures of acetonitrile or methanol and 0.05% TFA in water, in isocratic conditions optimized for each peak, at 7 ml min−1. During all purification steps, the peaks were collected on 0.1 M phosphate buffer (pH 7.0). The solutions obtained were partially evaporated in rotavapour to reduce the concentration of the organic solvent and then applied to a solid‐phase extraction cartridge (Sep‐Pak Vac C18, Waters), washed with water to remove salts, eluted with methanol and finally lyophilized.
An alternative method was carried out for the purification of 4D‐O‐acetyl‐mithramycin SK 17. In this case, 2 l of R5A medium for the bioconversion experiment was supplemented with 50 µg ml−1 of the precursor molecule. The culture was centrifuged and the supernatant was filtered and solid‐phase extracted (Sep‐Pak Vac C18, 10 g, Waters). A linear gradient of methanol and water (0–100% methanol during 60 min at 10 ml min−1) was applied for elution of the retained material. Fractions obtained were analysed by HPLC and those containing the acetylated derivative were pooled and dried in vacuo. The extract was redissolved in 5 ml of methanol and the purification procedure was carried out in a preparative column (XBridgeTM Prep C18, 5 µm, 30 × 150 mm, Waters) with isocratic elution using MeCN and 0.1% TFA in water (45:55), at 20 ml min−1. As TFA was used in the mobile phase of the purification, the peak was collected on 0.1 M potassium phosphate buffer (pH 7.0) and diluted fourfold with water to be desalted and concentrated by solid‐phase extraction, being finally lyophilized. The yields for the different compounds were as follows: 3.1 mg of 11; 1.7 mg of 12; 4.6 mg of 13; 1.0 mg of 14; 1.8 mg of 15; 2.5 mg of 16; and 5.2 mg of 17.
Structure elucidation and characterization of new mithramycin derivatives
The structures of the new mithramycin analogues were elucidated by NMR spectroscopy, employing 1D 1H, 13C and homonuclear 2D 1H COSY/TOCSY experiments. All NMR data were recorded in acetone‐d6 at 298 K using a Bruker Avance Ultrashield Plus 600 spectrometer (600 MHz for 1H, 150 MHz for 13C experiments). Typical parameters for 2D experiments were: COSY/TOCSY, 256 and 2048 points in F1 and F2, respectively, 48 transients each. NMR experiments were processed using the program Topspin 1.3 (Bruker GmbH, Karlsruhe, Germany).
Determination of antitumour activity
The antitumour activity of the mithramycin derivatives was tested against four tumour cell lines. Quantitative measurement of cell growth and viability was carried out using the MTT tetrazolium assay (Mosmann, 1983). Values correspond to the average of three independent assays.
Cell fractionation
To determine the location of the CmmA protein, S. albus pEM4TcmmA was grown in TSB medium at 30°C with orbital shaking for 48 h. Cultures were centrifuged and the mycelium was washed twice with 50 mM Tris‐HCl (pH 7.5), 1 mM EDTA and 20% glycerol. The mycelium was disrupted by two passes through a French press at a pressure of 10.3 MPa. DNA was broken by ultrasound (six pulses of 15 s each with intermittent cooling on ice water) in a MSE ultrasonic disintegrator at 150 watts and 50 kHz. Unbroken cells and debris were removed by centrifugation at 12 000 g for 30 min. Samples were collected from the resultant supernatant and were named ‘cell‐free extracts’. The supernatant was further centrifuged at 69 000 g for 1 h. The resulting supernatant was designated ‘soluble fraction’. The pellet containing the cell membranes was resuspended in a small volume of the above‐mentioned buffer and was named ‘membrane fraction’. Protein estimation in the different samples was carried out by measurement of absorbance at 540 nm by a protein‐dye binding assay using bovine serum albumin as standard (Bradford, 1976).
Polyacrylamide gel electrophoresis and Western analysis
Protein analysis was carried out by polyacrylamide gel electrophoresis in the presence of SDS (Laemmli, 1970). Western blotting was performed as described (Burnette, 1981), using the developing kit ECL plus Western Blotting Detection System (Amersham Biosciences). A peptide (ARPGDSTRSFYRRC) corresponding to the second predicted cytoplasmic loop of CmmA was synthesized to produce anti‐CmmA serum (SigmaGenosys).
In vitro assays of CmmA
Acetylation assays were conducted in a total volume of 50 µl in Tris‐HCl 50 mM pH 8, EDTA 1 mM and glycerol 20%, including 100 µM 3, 130 µg of protein from the membrane fraction (or the corresponding cell fraction to be tested) and 500 µM acetyl‐CoA. After incubation at 30°C for 2 h, the reaction products were extracted twice with 50 µl of ethyl acetate acidified with 3 µl of 0.4 N HCl. After phase separation, the organic phase was recovered, the solvent evaporated and the residue were suspended in 50 µl of methanol prior analysed by HPLC. Assays were also carried out using other acyl‐CoA donors (2 mM final concentration): isovaleryl‐CoA, isobutyryl‐CoA, β‐methylcrotonyl‐CoA, propionyl‐CoA and succinyl‐CoA.
Acknowledgments
This work was supported by grants (to C.M.) from the Spanish Ministry of Education and Science (BIO2005‐04115 and PET2005‐0401) and from the Spanish Ministry of Science and Innovation (BIO2008‐00269). B.G. was the recipient of a predoctoral fellowship from the Spanish Ministry of Science and Innovation. Instituto Biomar S.A. is acknowledged for helping us with the antitumour assays.
Supporting Information
Additional Supporting Information may be found in the online version of this article:
Fig. S1.1H‐NMR full chart for 4E‐O‐acetyl‐mithramycin (11) in acetone‐d6. (600 MHz)
Fig. S2.1H‐NMR expanded chart for 4E‐O‐acetyl‐mithramycin (11) in acetone‐d6. (600 MHz)
Fig. S3.13C‐NMR chart for 4E‐O‐acetyl‐mithramycin (11) in acetone‐d6. (150 MHz)
Fig. S4. COSY chart for 4E‐O‐acetyl‐mithramycin (11) in acetone‐d6 (256 points for F1 and F2, 48 transients)
Fig. S5. TOCSY chart for 4E‐O‐acetyl‐mithramycin (11) in acetone‐d6 (2048 points for F1 and F2, 48 transients)
Fig. S6.1H‐NMR full chart for demycarosyl‐3D‐b‐D‐digitoxosyl‐3E‐O‐acetyl‐mithramycin (12) in acetone‐d6. (600 MHz)
Fig. S7.1H‐NMR expanded chart for demycarosyl‐3D‐b‐D‐digitoxosyl‐3E‐O‐acetyl‐mithramycin (12) in acetone‐d6. (600 MHz)
Fig. S8. COSY chart for demycarosyl‐3D‐b‐D‐digitoxosyl‐3E‐O‐acetyl‐mithramycin (12) in acetone‐d6 (256 points for F1 and F2, 48 transients)
Fig. S9. TOCSY chart for demycarosyl‐3D‐b‐D‐digitoxosyl‐3E‐O‐acetyl‐mithramycin (12) in acetone‐d6 (2048 points for F1 and F2, 48 transients)
Fig. S10.1H‐NMR full chart for demycarosyl‐3D‐b‐D‐digitoxosyl‐4D‐O‐acetyl‐mithramycin (13) in acetone‐d6. (600 MHz)
Fig. S11.1H‐NMR expanded chart for demycarosyl‐3D‐b‐D‐digitoxosyl‐4D‐O‐acetyl‐mithramycin (13) in acetone‐d6. (600 MHz)
Fig. S12. COSY chart for demycarosyl‐3D‐b‐D‐digitoxosyl‐4D‐O‐acetyl‐mithramycin (13) in acetone‐d6 (256 points for F1 and F2, 48 transients)
Fig. S13. TOCSY chart for demycarosyl‐3D‐b‐D‐digitoxosyl‐4D‐O‐acetyl‐mithramycin (13) in acetone‐d6 (2048 points for F1 and F2, 48 transients)
Fig. S14.1H‐NMR full chart for demycarosyl‐3D‐b‐D‐digitoxosyl‐4E‐O‐acetyl‐mithramycin (14) in acetone‐d6. (600 MHz)
Fig. S15.1H‐NMR expanded chart for demycarosyl‐3D‐b‐D‐digitoxosyl‐4E‐O‐acetyl‐mithramycin (14) in acetone‐d6. (600 MHz)
Fig. S16. COSY chart for demycarosyl‐3D‐b‐D‐digitoxosyl‐4E‐O‐acetyl‐mithramycin (14) in acetone‐d6 (256 points for F1 and F2, 48 transients)
Fig. S17. TOCSY chart for demycarosyl‐3D‐b‐D‐digitoxosyl‐4E‐O‐acetyl‐mithramycin (14) in acetone‐d6 (2048 points for F1 and F2, 48 transients)
Fig. S18.1H‐NMR full chart for demycarosyl‐3D‐b‐D‐digitoxosyl‐3E, 4D‐O‐diacetyl‐mithramycin (15) in acetone‐d6. (600 MHz)
Fig. S19.1H‐NMR expanded chart for demycarosyl‐3D‐b‐D‐digitoxosyl‐3E, 4D‐O‐diacetyl‐mithramycin (15) in acetone‐d6. (600 MHz)
Fig. S20. COSY chart for demycarosyl‐3D‐b‐D‐digitoxosyl‐3E, 4D‐O‐diacetyl‐mithramycin (15) in acetone‐d6 (256 points for F1 and F2, 48 transients)
Fig. S21. TOCSY chart for demycarosyl‐3D‐b‐D‐digitoxosyl‐3E, 4D‐O‐diacetyl‐mithramycin (15) in acetone‐d6 (2048 points for F1 and F2, 48 transients)
Fig. S22.1H‐NMR full chart for demycarosyl‐3D‐b‐D‐digitoxosyl‐3E, 4E, 4D‐O‐triacetyl‐mithramycin (16) in acetone‐d6. (600 MHz)
Fig. S23.1H‐NMR expanded chart for demycarosyl‐3D‐b‐D‐digitoxosyl‐3E, 4E, 4D‐O‐triacetyl‐mithramycin (16) in acetone‐d6. (600 MHz)
Fig. S24. COSY chart for demycarosyl‐3D‐b‐D‐digitoxosyl‐3E, 4E, 4D‐O‐triacetyl‐mithramycin (16) in acetone‐d6 (256 points for F1 and F2, 48 transients)
Fig. S25. TOCSY chart for demycarosyl‐3D‐b‐D‐digitoxosyl‐3E, 4E, 4D‐O‐triacetyl‐mithramycin (16) in acetone‐d6 (2048 points for F1 and F2, 48 transients)
Fig. S26.1H‐NMR full chart for 4D‐O‐acetyl‐mithramycin SK (17) in acetone‐d6. (600 MHz)
Fig. S27.1H‐NMR expanded chart for 4D‐O‐acetyl‐mithramycin SK (17) in acetone‐d6. (600 MHz)
Fig. S28.13C‐NMR chart for 4D‐O‐acetyl‐mithramycin SK (17) in acetone‐d6. (150 MHz)
Fig. S29. COSY chart for 4D‐O‐acetyl‐mithramycin SK (17) in acetone‐d6 (256 points for F1 and F2, 48 transients)
Fig. S30. TOCSY chart for 4D‐O‐acetyl‐mithramycin SK (17) in acetone‐d6 (2048 points for F1 and F2, 48 transients)
Table S1. NMR data for 4E‐O‐acetyl‐mithramycin (11) in acetone‐d6. (1H, 600 MHz; 13C, 150 MHz).
Table S2. NMR data for demycarosyl‐3D‐β‐d‐digitoxosyl‐3E‐O‐acetyl‐mithramycin (12) in acetone‐d6. (1H, 600 MHz).
Table S3. NMR data for demycarosyl‐3D‐β‐d‐digitoxosyl‐4D‐O‐acetyl‐mithramycin (13) in acetone‐d6. (1H, 600 MHz).
Table S4. NMR data for demycarosyl‐3D‐β‐d‐digitoxosyl‐4E‐O‐acetyl‐mithramycin (14) in acetone‐d6. (1H, 600 MHz).
Table S5. NMR data for demycarosyl‐3D‐β‐d‐digitoxosyl‐3E,4D‐O‐diacetyl‐mithramycin (15) in acetone‐d6. (1H, 600 MHz).
Table S6. NMR data for demycarosyl‐3D‐β‐d‐digitoxosyl‐3E,4E,4D‐O‐triacetyl‐mithramycin (16) in acetone‐d6. (1H, 600 MHz).
Table S7. NMR data for 4D‐O‐acetyl‐mithramycin SK (17) in acetone‐d6. (1H, 600 MHz; 13C, 150 MHz).
Please note: Wiley-Blackwell are not responsible for the content or functionality of any supporting materials supplied by the authors. Any queries (other than missing material) should be directed to the corresponding author for the article.
References
- Albertini V., Jain A., Vignati S., Napoli S., Rinaldi A., Kwee I. Novel GC‐rich DNA‐binding compound produced by a genetically engineered mutant of the mithramycin producer Streptomyces argillaceus exhibits improved transcriptional repressor activity: implications for cancer therapy. Nucleic Acids Res. 2006;34:1721–1734. doi: 10.1093/nar/gkl063. et al. [DOI] [PMC free article] [PubMed] [Google Scholar]
- Arisawa A., Kawamura N., Takeda K., Tsunekawa H., Okamura K., Okamoto R. Cloning of the macrolide antibiotic biosynthesis gene acyA, which encodes 3‐O‐acyltransferase, from Streptomyces thermotolerans and its use for direct fermentative production of a hybrid macrolide antibiotic. Appl Environ Microbiol. 1994;60:2657–2660. doi: 10.1128/aem.60.7.2657-2660.1994. [DOI] [PMC free article] [PubMed] [Google Scholar]
- Baig I., Perez M., Braña A.F., Gomathinayagam R., Damodaran C., Salas J.A. Mithramycin analogues generated by combinatorial biosynthesis show improved bioactivity. J Nat Prod. 2008;71:199–207. doi: 10.1021/np0705763. et al. [DOI] [PMC free article] [PubMed] [Google Scholar]
- Barcelo F., Scotta C., Ortiz‐Lombardía M., Méndez C., Salas J.A., Portugal J. Entropically‐driven binding of mithramycin in the minor groove of C/G‐rich DNA sequences. Nucleic Acids Res. 2007;35:2215–2226. doi: 10.1093/nar/gkm037. [DOI] [PMC free article] [PubMed] [Google Scholar]
- Blume S.W., Snyder R.C., Ray R., Thomas S., Koller C.A., Miller D.M. Mithramycin inhibits SP1 binding and selectively inhibits transcriptional activity of the dihydrofolate reductase gene in vitro and in vivo. J Clin Invest. 1991;88:1613–1621. doi: 10.1172/JCI115474. [DOI] [PMC free article] [PubMed] [Google Scholar]
- Bradford M.M. A rapid and sensitive method for the quantitation of microgram quantities of protein utilizing the principle of protein‐dye binding. Anal Biochem. 1976;72:248–254. doi: 10.1006/abio.1976.9999. [DOI] [PubMed] [Google Scholar]
- Burnette W.N. ‘Western blotting’: electrophoretic transfer of proteins from sodium dodecyl sulphate‐polyacrylamide gels to unmodified nitrocellulose and radiographic detection with antibody and radioiodinated protein A. Anal Biochem. 1981;112:195–203. doi: 10.1016/0003-2697(81)90281-5. [DOI] [PubMed] [Google Scholar]
- Chakrabarti S., Bhattacharyya D., Dasgupta D. Structural basis of DNA recognition by anticancer antibiotics, chromomycin A(3), and mithramycin: roles of minor groove width and ligand flexibility. Biopolymers. 2001;56:85–95. doi: 10.1002/1097-0282(2000)56:2<85::AID-BIP1054>3.0.CO;2-7. [DOI] [PubMed] [Google Scholar]
- Chatterjee S., Zaman K., Ryu H., Conforto A., Ratan R.R. Sequence‐selective DNA binding drugs mithramycin A and chromomycin A3 are potent inhibitors of neuronal apoptosis induced by oxidative stress and DNA damage in cortical neurons. Ann Neurol. 2001;49:345–354. [PubMed] [Google Scholar]
- Chua Y.J., Zalcberg J.R. Pancreatic cancer – is the wall crumbling? Ann Oncol. 2008;19:1224–1230. doi: 10.1093/annonc/mdn063. [DOI] [PubMed] [Google Scholar]
- Ertel A., Verghese A., Byers S.W., Ochs M., Tozeren A. Pathway‐specific differences between tumor cell lines and normal and tumor tissue cells. Mol Cancer. 2006;5:55. doi: 10.1186/1476-4598-5-55. [DOI] [PMC free article] [PubMed] [Google Scholar]
- Fernández E., Weibbach U., Sánchez Reillo C., Braña A.F., Méndez C., Rohr J., Salas J.A. Identification of two genes from Streptomyces argillaceus encoding two glycosyltransferases involved in the transfer of a disaccharide during the biosynthesis of the antitumor drug mithramycin. J Bacteriol. 1998;180:4929–4937. doi: 10.1128/jb.180.18.4929-4937.1998. [DOI] [PMC free article] [PubMed] [Google Scholar]
- Fibach E., Bianchi N., Borgatti M., Prus E., Gambari R. Mithramycin induces fetal hemoglobin production in normal and thalassemic human erythroid precursor cells. Blood. 2003;102:1276–1281. doi: 10.1182/blood-2002-10-3096. [DOI] [PubMed] [Google Scholar]
- Hara O., Hutchinson C.R. A macrolide 3‐O‐acyltransferase gene from the midecamycin‐producing species Streptomyces mycarofaciens. J Bacteriol. 1992;174:5141–5144. doi: 10.1128/jb.174.15.5141-5144.1992. [DOI] [PMC free article] [PubMed] [Google Scholar]
- Jia Z., Zhang J., Wei D., Wang L., Yuan P., Le X. Molecular basis of the synergistic antiangiogenic activity of bevacizumab and mithramycin A. Cancer Res. 2007;67:4878–4885. doi: 10.1158/0008-5472.CAN-06-3494. et al. [DOI] [PubMed] [Google Scholar]
- Kieser T., Bibb M.J., Buttner M.J., Chater K.F., Hopwood D.A. The John Innes Foundation; 2000. [Google Scholar]
- Laemmli U.K. Cleavage of structural proteins during the assembly of the head of bacteriophage T4. Nature. 1970;227:680–685. doi: 10.1038/227680a0. [DOI] [PubMed] [Google Scholar]
- Majee S., Sen R., Guha S., Bhattacharyya D., Dasgupta D. Differential interactions of the Mg2+ complexes of chromomycin A3 and mithramycin with poly(dG‐dC) × poly(dC‐dG) and poly(dG) × poly(dC) Biochemistry. 1997;36:2291–2299. doi: 10.1021/bi9613281. [DOI] [PubMed] [Google Scholar]
- Menéndez N., Mohammad N., Braña A.F., Rohr J., Salas J.A., Méndez C. Biosynthesis of the antitumor chromomycin A3 in Streptomyces griseus: analysis of the gene cluster and rational design of novel chromomycin analogues. Chem Biol. 2004a;11:21–32. doi: 10.1016/j.chembiol.2003.12.011. [DOI] [PubMed] [Google Scholar]
- Menéndez N., Nur‐e‐Alam M., Braña A.F., Rohr J., Salas J.A., Méndez C. Tailoring modification of deoxysugars during biosynthesis of the antitumor drug chromomycin A3 by Streptomyces griseus subsp. griseus. Mol Microbiol. 2004b;53:903–915. doi: 10.1111/j.1365-2958.2004.04166.x. [DOI] [PubMed] [Google Scholar]
- Menéndez N., Nur‐e‐Alam M., Fischer C., Braña A.F., Salas J.A., Rohr J., Méndez C. Deoxysugar transfer during chromomycin A3 biosynthesis in Streptomyces griseus subsp. griseus: new derivatives with antitumor activity. Appl Environ Microbiol. 2006;72:67–77. doi: 10.1128/AEM.72.1.167-177.2006. [DOI] [PMC free article] [PubMed] [Google Scholar]
- Menéndez N., Braña A.F., Salas J.A., Méndez C. Involvement of a chromomycin ABC transporter system in secretion of a deacetylated precursor during chromomycin biosynthesis. Microbiology. 2007;153:3061–3070. doi: 10.1099/mic.0.2007/007922-0. [DOI] [PubMed] [Google Scholar]
- Miller D.M., Polansky D.A., Thomas S.D., Ray R., Campbell V.W., Sanchez J., Koller C.A. Mithramycin selectively inhibits transcription of G‐C containing DNA. Am J Med Sci. 1987;294:388–394. doi: 10.1097/00000441-198711000-00015. [DOI] [PubMed] [Google Scholar]
- Mir M.A., Majee S., Das S., Dasgupta D. Association of chromatin with anticancer antibiotics, mithramycin and chromomycin A3. Bioorg Med Chem. 2003;11:2791–2801. doi: 10.1016/s0968-0896(03)00211-6. [DOI] [PubMed] [Google Scholar]
- Mosmann T. Rapid colorimetric assay for cellular growth and survival: Application to proliferation and cytotoxicity assay. J Immunol Methods. 1983;65:55–63. doi: 10.1016/0022-1759(83)90303-4. [DOI] [PubMed] [Google Scholar]
- Moss S.J., Bai L., Toelzer S., Carroll B.J., Mahmud T., Yu T.W., Floss H.G. Identification of asm19 as an acyltransferase attaching the biologically essential ester side chain of ansamitocins using N‐desmethyl‐4,5‐desepoxymaytansinol, not maytansinol, as its substrate. J Am Chem Soc. 2002;124:6544–6545. doi: 10.1021/ja020214b. [DOI] [PubMed] [Google Scholar]
- Newman J., Cragg G.M. Natural products as sources of new drugs over the last 25 years. J Nat Prod. 2007;70:461–477. doi: 10.1021/np068054v. [DOI] [PubMed] [Google Scholar]
- Olano C., Gómez C., Pérez M., Palomino M., Pineda‐Lucena A., Carbajo R.J. Deciphering biosynthesis of the RNA polymerase inhibitor streptolydigin and generation of glycosylated derivatives. Chem Biol. 2009;16:1031–1044. doi: 10.1016/j.chembiol.2009.09.015. et al. [DOI] [PubMed] [Google Scholar]
- Pérez M., Baig I., Braña A.F., Salas J.A., Rohr J., Méndez C. Generation of new derivatives of the antitumor antibiotic mithramycin by altering the glycosylation pattern through combinatorial biosynthesis. Chembiochem. 2008;9:2295–2304. doi: 10.1002/cbic.200800299. [DOI] [PMC free article] [PubMed] [Google Scholar]
- Ray R., Snyder R.C., Thomas S., Koller C.A., Miller D.M. Mithramycin blocks protein binding and function of the SV40 early promoter. J Clin Invest. 1989;83:2003–2007. doi: 10.1172/JCI114110. [DOI] [PMC free article] [PubMed] [Google Scholar]
- Remers W.A. Vol. 1. Wiley‐Interscience; 1979. [Google Scholar]
- Remsing L.L., González A.M., Nur‐e‐Alam M., Fernández‐Lozano M.J., Braña A.F., Rix U. Mithramycin SK, a novel antitumor drug with improved therapeutic index, mithramycin SA, and demycarosyl‐mithramycin SK: three new products generated in the mithramycin producer Streptomyces argillaceus through combinatorial biosynthesis. J Am Chem Soc. 2003;125:5745–5753. doi: 10.1021/ja034162h. et al. [DOI] [PMC free article] [PubMed] [Google Scholar]
- Rohr J., Méndez C., Salas J.A. The biosynthesis of aureolic acid group antibiotics. Bioorg Chem. 1999;27:41–54. [Google Scholar]
- Sambrook J., Russell D.W. 3rd. Cold Spring Harbor Laboratory; 2001. [Google Scholar]
- Sastry M., Patel D.J. Solution structure of the mithramycin dimer–DNA complex. Biochemistry. 1993;32:6588–6604. doi: 10.1021/bi00077a012. [DOI] [PubMed] [Google Scholar]
- Sastry M., Fiala R., Patel D.J. Solution structure of mithramycin dimers bound to partially overlapping sites on DNA. J Mol Biol. 1995;251:674–689. doi: 10.1006/jmbi.1995.0464. [DOI] [PubMed] [Google Scholar]
- Shrieve D.C., Alexander E., 3rd, Black P.M., Wen P.Y., Fine H.A., Kooy H.M., Loeffler J.S. Treatment of patients with primary glioblastoma multiforme with standard postoperative radiotherapy and radiosurgical boost: prognostic factors and long‐term outcome. J Neurosurg. 1999;90:72–77. doi: 10.3171/jns.1999.90.1.0072. [DOI] [PubMed] [Google Scholar]
- Silva D.J., Kahne D.E. Studies of the 2:1 chromomycin A3‐Mg2+ complex in methanol: role of the carbohydrates in complex formation. J Am Chem Soc. 1993;115:7962–7970. [Google Scholar]
- Silva D.J., Goodnow R., Jr, Kahne R. The sugars in chromomycin A3 stabilize the Mg(2+)–dimer complex. Biochemistry. 1993;32:463–471. doi: 10.1021/bi00053a010. [DOI] [PubMed] [Google Scholar]
- Skarbek J.D., Speedie M.K. Antitumor antibiotics of the aureolic acid group: chromomycin A3, mithramycin A, and olivomycin A. In: Aszalos A., editor. CRC Press; 1981. pp. 191–235. [Google Scholar]
- Snyder R.C., Ray R., Blume S., Miller D.M. Mithramycin blocks transcriptional initiation of the c‐myc P1 and P2 promoters. Biochemistry. 1991;30:4290–4297. doi: 10.1021/bi00231a027. [DOI] [PubMed] [Google Scholar]
- Wohlert S.E., Künzel E., Machinek R., Méndez C., Salas J.A., Rohr J. The structure of mithramycin reinvestigated. J Nat Prod. 1999;62:119–121. doi: 10.1021/np980355k. [DOI] [PubMed] [Google Scholar]
Associated Data
This section collects any data citations, data availability statements, or supplementary materials included in this article.
Supplementary Materials
Fig. S1.1H‐NMR full chart for 4E‐O‐acetyl‐mithramycin (11) in acetone‐d6. (600 MHz)
Fig. S2.1H‐NMR expanded chart for 4E‐O‐acetyl‐mithramycin (11) in acetone‐d6. (600 MHz)
Fig. S3.13C‐NMR chart for 4E‐O‐acetyl‐mithramycin (11) in acetone‐d6. (150 MHz)
Fig. S4. COSY chart for 4E‐O‐acetyl‐mithramycin (11) in acetone‐d6 (256 points for F1 and F2, 48 transients)
Fig. S5. TOCSY chart for 4E‐O‐acetyl‐mithramycin (11) in acetone‐d6 (2048 points for F1 and F2, 48 transients)
Fig. S6.1H‐NMR full chart for demycarosyl‐3D‐b‐D‐digitoxosyl‐3E‐O‐acetyl‐mithramycin (12) in acetone‐d6. (600 MHz)
Fig. S7.1H‐NMR expanded chart for demycarosyl‐3D‐b‐D‐digitoxosyl‐3E‐O‐acetyl‐mithramycin (12) in acetone‐d6. (600 MHz)
Fig. S8. COSY chart for demycarosyl‐3D‐b‐D‐digitoxosyl‐3E‐O‐acetyl‐mithramycin (12) in acetone‐d6 (256 points for F1 and F2, 48 transients)
Fig. S9. TOCSY chart for demycarosyl‐3D‐b‐D‐digitoxosyl‐3E‐O‐acetyl‐mithramycin (12) in acetone‐d6 (2048 points for F1 and F2, 48 transients)
Fig. S10.1H‐NMR full chart for demycarosyl‐3D‐b‐D‐digitoxosyl‐4D‐O‐acetyl‐mithramycin (13) in acetone‐d6. (600 MHz)
Fig. S11.1H‐NMR expanded chart for demycarosyl‐3D‐b‐D‐digitoxosyl‐4D‐O‐acetyl‐mithramycin (13) in acetone‐d6. (600 MHz)
Fig. S12. COSY chart for demycarosyl‐3D‐b‐D‐digitoxosyl‐4D‐O‐acetyl‐mithramycin (13) in acetone‐d6 (256 points for F1 and F2, 48 transients)
Fig. S13. TOCSY chart for demycarosyl‐3D‐b‐D‐digitoxosyl‐4D‐O‐acetyl‐mithramycin (13) in acetone‐d6 (2048 points for F1 and F2, 48 transients)
Fig. S14.1H‐NMR full chart for demycarosyl‐3D‐b‐D‐digitoxosyl‐4E‐O‐acetyl‐mithramycin (14) in acetone‐d6. (600 MHz)
Fig. S15.1H‐NMR expanded chart for demycarosyl‐3D‐b‐D‐digitoxosyl‐4E‐O‐acetyl‐mithramycin (14) in acetone‐d6. (600 MHz)
Fig. S16. COSY chart for demycarosyl‐3D‐b‐D‐digitoxosyl‐4E‐O‐acetyl‐mithramycin (14) in acetone‐d6 (256 points for F1 and F2, 48 transients)
Fig. S17. TOCSY chart for demycarosyl‐3D‐b‐D‐digitoxosyl‐4E‐O‐acetyl‐mithramycin (14) in acetone‐d6 (2048 points for F1 and F2, 48 transients)
Fig. S18.1H‐NMR full chart for demycarosyl‐3D‐b‐D‐digitoxosyl‐3E, 4D‐O‐diacetyl‐mithramycin (15) in acetone‐d6. (600 MHz)
Fig. S19.1H‐NMR expanded chart for demycarosyl‐3D‐b‐D‐digitoxosyl‐3E, 4D‐O‐diacetyl‐mithramycin (15) in acetone‐d6. (600 MHz)
Fig. S20. COSY chart for demycarosyl‐3D‐b‐D‐digitoxosyl‐3E, 4D‐O‐diacetyl‐mithramycin (15) in acetone‐d6 (256 points for F1 and F2, 48 transients)
Fig. S21. TOCSY chart for demycarosyl‐3D‐b‐D‐digitoxosyl‐3E, 4D‐O‐diacetyl‐mithramycin (15) in acetone‐d6 (2048 points for F1 and F2, 48 transients)
Fig. S22.1H‐NMR full chart for demycarosyl‐3D‐b‐D‐digitoxosyl‐3E, 4E, 4D‐O‐triacetyl‐mithramycin (16) in acetone‐d6. (600 MHz)
Fig. S23.1H‐NMR expanded chart for demycarosyl‐3D‐b‐D‐digitoxosyl‐3E, 4E, 4D‐O‐triacetyl‐mithramycin (16) in acetone‐d6. (600 MHz)
Fig. S24. COSY chart for demycarosyl‐3D‐b‐D‐digitoxosyl‐3E, 4E, 4D‐O‐triacetyl‐mithramycin (16) in acetone‐d6 (256 points for F1 and F2, 48 transients)
Fig. S25. TOCSY chart for demycarosyl‐3D‐b‐D‐digitoxosyl‐3E, 4E, 4D‐O‐triacetyl‐mithramycin (16) in acetone‐d6 (2048 points for F1 and F2, 48 transients)
Fig. S26.1H‐NMR full chart for 4D‐O‐acetyl‐mithramycin SK (17) in acetone‐d6. (600 MHz)
Fig. S27.1H‐NMR expanded chart for 4D‐O‐acetyl‐mithramycin SK (17) in acetone‐d6. (600 MHz)
Fig. S28.13C‐NMR chart for 4D‐O‐acetyl‐mithramycin SK (17) in acetone‐d6. (150 MHz)
Fig. S29. COSY chart for 4D‐O‐acetyl‐mithramycin SK (17) in acetone‐d6 (256 points for F1 and F2, 48 transients)
Fig. S30. TOCSY chart for 4D‐O‐acetyl‐mithramycin SK (17) in acetone‐d6 (2048 points for F1 and F2, 48 transients)
Table S1. NMR data for 4E‐O‐acetyl‐mithramycin (11) in acetone‐d6. (1H, 600 MHz; 13C, 150 MHz).
Table S2. NMR data for demycarosyl‐3D‐β‐d‐digitoxosyl‐3E‐O‐acetyl‐mithramycin (12) in acetone‐d6. (1H, 600 MHz).
Table S3. NMR data for demycarosyl‐3D‐β‐d‐digitoxosyl‐4D‐O‐acetyl‐mithramycin (13) in acetone‐d6. (1H, 600 MHz).
Table S4. NMR data for demycarosyl‐3D‐β‐d‐digitoxosyl‐4E‐O‐acetyl‐mithramycin (14) in acetone‐d6. (1H, 600 MHz).
Table S5. NMR data for demycarosyl‐3D‐β‐d‐digitoxosyl‐3E,4D‐O‐diacetyl‐mithramycin (15) in acetone‐d6. (1H, 600 MHz).
Table S6. NMR data for demycarosyl‐3D‐β‐d‐digitoxosyl‐3E,4E,4D‐O‐triacetyl‐mithramycin (16) in acetone‐d6. (1H, 600 MHz).
Table S7. NMR data for 4D‐O‐acetyl‐mithramycin SK (17) in acetone‐d6. (1H, 600 MHz; 13C, 150 MHz).