

Summary
Streptomycetes have high biotechnological relevance as producers of diverse metabolites widely used in medical and agricultural applications. The biosynthesis of these metabolites is controlled by signalling molecules, γ‐butyrolactones, that act as bacterial hormones. In Streptomyces coelicolor, a group of signalling molecules called SCBs (S. coelicolorbutanolides) regulates production of the pigmented antibiotics coelicolor polyketide (CPK), actinorhodin and undecylprodigiosin. The γ‐butyrolactone synthase ScbA is responsible for the biosynthesis of SCBs. Here we show the results of a genome‐wide transcriptome analysis of a scbA deletion mutant prior to and during the transition to antibiotic production. We report a strong perturbation in the expression of three pigmented antibiotic clusters in the mutant throughout the growth curve, thus providing a molecular explanation for the antibiotic phenotype observed previously. Our study also revealed, for the first time, that the secondary metabolite cluster responsible for synthesis of the siderophore desferrioxamine is under the control of SCB signalling. Moreover, expression of the genes encoding enzymes for primary metabolism pathways, which supply antibiotic precursors and genes for morphological differentiation, was found shifted earlier in time in the mutant. In conclusion, our time series analysis demonstrates new details of the regulatory effects of the γ‐butyrolactone system in Streptomyces.
Introduction
Signalling molecules in bacteria play key functions in the intraspecies regulation of processes like differentiation, antibiotic production, biofilm formation and pathogenicity (Camilli and Bassler, 2006), and also contribute to interspecies communication (Subramoni and Venturi, 2009). The molecules act at a very low concentration, and therefore are often referred to as microbial hormones. The discovery of these molecules has opened a new research area and has important applications in biotechnology, for instance related to biofilm formation (Landini et al., 2010).
Streptomyces are biotechnologically important bacteria and well known for their ability to produce numerous secondary metabolites, including anticancer agents, immunosuppressants and most importantly antibiotics, of which they are the major producer. The best‐characterized signalling molecule in Streptomyces is A‐factor, the γ‐butyrolactone of Streptomyces griseus (Khokhlov et al., 1967). The key enzyme in the synthesis of A‐factor has been shown by in vitro synthesis to be AfsA (Kato et al., 2007). Other γ‐butyrolactones that have been characterized are the virginiae butanolides (VBs) from Streptomyces virginiae. The afsA homologue in S. virginiae is barX; its deletion causes a deficiency in VBs and virginiamycin production (Lee et al., 2010). It has recently been reported that addition of VBs to a barX null mutant restores the wild‐type phenotype with respect to virginiamycin production (Lee et al., 2010), confirming its enzymatic activity. Also, BarX stabilizes interaction between BarA and the barB promoter (Kawachi et al., 2000), suggesting a regulatory function beside the enzymatic role.
In Streptomyces coelicolor A3(2), three γ‐butyrolactones have been determined as signalling molecules that elicit antibiotic production (Takano et al., 2000; Hsiao et al., 2009), of which the most abundant is the S. coelicolor butanolide 1 (SCB1). SCBs are known to regulate at least three antibiotic biosynthetic clusters: act, for the synthesis of the blue‐pigmented actinorhodin (Act); red, for the synthesis of the red‐pigmented undecylprodigiosin (Red); and the recently characterized cpk for the synthesis of the yellow pigment yCPK and the antibiotic abCPK (Takano et al., 2005;Gottelt et al., 2010).
One of the strategies to increase productivity of a specific antibiotic in streptomycetes is the removal of γ‐butyrolactones receptor proteins (Martin and Liras, 2010). For example, deletion of tylP in Streptomyces fradiae (Cundliffe, 2008) and brp in Streptomyces clavuligerus (Santamarta et al., 2005) have been reported to increase, between two‐ and threefold, the production of tylosin, and clavulanic acid and cephamycin C respectively. Deleting the γ‐butyrolactones receptor scbR in S. coelicolor does not trigger overproduction of the Red and Act antibiotics, but rather delays their synthesis (Takano et al., 2001).
The AfsA homologue in S. coelicolor, ScbA, is involved in SCB production which occurs during transition and stationary phase (Takano et al., 2001). It has homology to fatty acid synthases, and mutation of two predicted enzymatically active sites leads to the loss of SCBs (Hsiao et al., 2007). ScbR is the main butanolide receptor in S. coelicolor and acts as transcriptional regulator (Takano et al., 2001). In the absence of the signalling molecules, ScbR binds to the promoter of its own gene (site R) and of cpkO (site OA), the main activator of the cpk gene cluster (Takano et al., 2005), repressing their expression. Also, ScbR binds the promoter of scbA (site A); however, with an opposite effect: its presence is necessary for scbA induction (Takano et al., 2001). scbA is divergent from scbR, and its deletion impairs production of SCBs, and causes an earlier and enhanced Red and Act production (Takano et al., 2001). scbA and scbR expression is absent in the S. coelicolor scbA deletion mutant M751; addition of SCB1 restores scbR transcription, but not that of scbA. These data taken together suggest a possible regulatory function of ScbA, at least for its own expression (Takano et al., 2001). To analyse the role of ScbA and the butanolide system more extensively, gene expression in a scbA deletion mutant (M751), just before and during the onset of antibiotic production, was compared with the wild‐type M145 using whole‐genome microarrays and quantitative RT‐PCR (qRT‐PCR) analyses.
Results
Microarray analysis of differentially expressed genes in the γ‐butyrolactone non‐producer mutant versus the wild type
Antibiotic production in the scbA deletion mutant (M751) occurs earlier and leads to a 10‐fold higher final yield of both Act and Red than that of the wild‐type (M145) strain (Takano et al., 2001). To understand the possible regulatory role of ScbA and how ScbA influences the production of antibiotics, the genome‐wide time‐series expression profiles of S. coelicolor wild‐type M145 and M751 were compared by microarray analysis. The two strains showed the same growth profile in SMM liquid medium (Fig. 1). While the wild type started producing the red‐pigmented undecylprodigiosin at time point 3 (TP3) (red bar in Fig. 1), at the switch from exponential to transition phase, followed by the blue pigmented actinorhodin, production of Red in the mutant occurred during exponential phase at TP2 (red bar in Fig. 1). RNA was isolated from eight time points during the growth curve and cDNA retrotranscribed and hybridized to a PCR‐based microarray comprising 7629 genes. The raw expression data are available at the following website: http://www‐ps.informatik.uni‐tuebingen.de/coelicolor.
Figure 1.
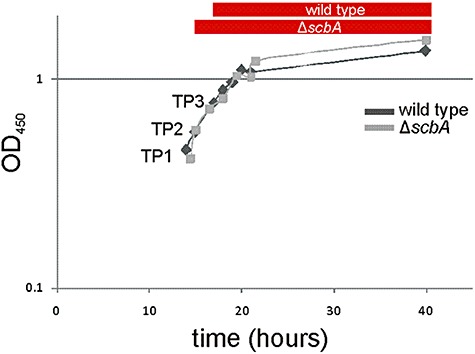
Growth curves of the wild‐type and the ΔscbA mutant. Cell growth in liquid SMM medium of the wild type (dark line, diamond) and the ΔscbA mutant (light line, square) was monitored in time, measuring the absorbance of the culture at OD450. Undecylprodigiosin production started at the beginning of the transition phase in the wild type (red bar) and at mid‐exponential phase in the ΔscbA mutant (red bar).
The overall expression trend of the majority of the genes was similar between the two strains (Fig. 2A). This was expected given that the two strains show a similar growth profile (Fig. 1). The expression profiles at all time points were analysed using principal component analysis (PCA). In the plot of the first two principal components, one can see that the two strains follow very similar curves, but one can also notice a shift occurring around TP3, just as reflected in the antibiotic production (Fig. 2B).
Figure 2.
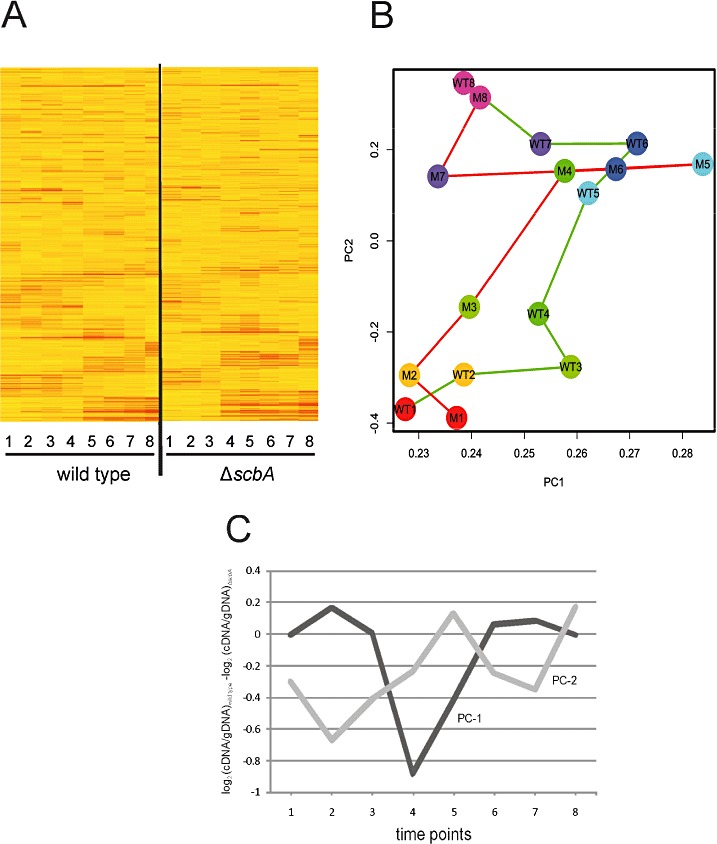
Identification of perturbed genes in the ΔscbA mutant using principal component analysis (PCA). A. Microarray analysis of global transcription profile of the wild type (left panel) and the ΔscbA mutant (right panel), sorted by hierarchical clustering. Intensity of the colour (from yellow to red) represents intensity of the expression for each gene. B. The gene expression values in wild type (green line) and the ΔscbA mutant (red line) were analysed by PCA, and the values of principal component 1 are plotted versus principal component 2. Numbers in the circles indicate the TPs. C. The two main patterns of the difference expression profile between the wild type and the ΔscbA mutant are shown, based on the loadings of PC‐1 (dark line) and PC‐2 (light line) in PCA of the expression difference profiles.
Differential expression analysis at time point 1
To elucidate the cause of the earlier production of antibiotics in M751, we characterized in detail the expression profile of genes at early exponential phase (time point 1), which is prior to the production of antibiotics in M751. Differentially expressed genes were calculated as described in Experimental procedures. Fifty‐six genes were selected based on these criteria, which were either upregulated at least 1.2‐fold or downregulated at least 0.85‐fold in M751 compared with M145 (Table S1). qRT‐PCR was carried out for 34 of the 56 differentially expressed genes. hrdB was chosen as the endogenous control. Eighteen out of the 25 upregulated and one out of the nine downregulated genes were confirmed (Table 1). Of the genes whose expression was confirmed by qRT‐PCR, the largest group was encoding hypothetical proteins, the second largest consisting of genes with house keeping functions. SCO0982, encoding the isocitrate lyase aceA, was the second most overexpressed gene. This gene is essential for growth on acetate as sole carbon source (Akopiants et al., 2006), and its maximum activity has been observed during cessation of growth in S. clavuligerus (Soh et al., 2001). A gene encoding a cold‐shock protein, scoF4, was the third most overexpressed. Similarly, three other genes upregulated in the mutant are related to stress response: the transfer‐messenger RNA cofactor smpB, and the molecular chaperones dnaJ and groEL2. afsS, a sigma‐like protein, which is a pleiotropic regulator for antibiotics production, was identified as the fourth most overexpressed gene. The only gene that was found downregulated independently by microarray and qRT‐PCR was cysC, encoding an adenylylsulfate kinase, part of the biosynthetic pathway for the amino acid cysteine. Some genes whose expression was downregulated in the microarray analysis were in fact upregulated when analysed by qRT‐PCR. absA1 was identified as such and it is interesting to note that it is part of the two‐component system which was shown to regulate Act and Red production (Anderson et al., 2001).
Table 1.
Differentially expressed genes at TP1 by qRT‐PCR.
| Gene | Annotation and common name | Functional annotation | Fold change |
|---|---|---|---|
| SCO0607 | Hypothetical lipoprotein | Periplasmic/exported/lipoproteins | 6.53 |
| SCO0982 | Isocitrate lyase aceA | Central intermediary metabolisms | 2.23 |
| SCO2476 | Putative dehydrogenase/reductase (putative secreted protein) | Not classified (included putative assignments) | 2.23 |
| SCO3752 | Putative ABC transporter ATP‐binding protein | Cell process | 2.02 |
| SCO4295 | Cold shock protein scoF4 | Cell process | 1.93 |
| SCO4425 | Sigma‐like protein afsS | Other regulation | 1.75 |
| SCO3225 | Two‐component sensor kinase absA | Secondary metabolism | 1.81 |
| SCO6577 | Conserved hypothetical protein | Hypothetical protein | 1.65 |
| SCO5865 | Hypothetical protein | Hypothetical protein | 1.65 |
| SCO3538 | Hypothetical protein | Hypothetical protein | 1.53 |
| SCO6624 | Putative membrane protein | Hypothetical protein | 1.52 |
| SCO3893 | Hypothetical protein | Hypothetical protein | 1.51 |
| SCO7476 | Putative secreted protein | Periplasmic/exported/lipoproteins | 1.50 |
| SCO3133 | Putative MarR‐family regulator | Defined family regulators | 1.48 |
| SCO2966 | Small protein B homologue smpB | Macromolecule metabolism | 1.47 |
| SCO4173 | Hypothetical protein | Hypothetical protein | 1.46 |
| SCO2261 | Putative membrane protein | Periplasmic/exported/lipoproteins | 1.42 |
| SCO2195 | Hypothetical protein | Hypothetical protein | 1.39 |
| SCO1152 | Putative helicase | Macromolecule metabolism | 1.36 |
| SCO5725 | Hypothetical protein | Hypothetical protein | 1.32 |
| SCO0981 | Putative DNA‐binding protein | Other regulation | 1.27 |
| SCO4296 | Chaperonin 2 groEL2 | Cell process | 1.24 |
| SCO6259 | Probable ABC sugar transport ATP‐binding protein | Cell process | 1.24 |
| SCO3669 | Molecular chaperone dnaJ | Cell process | 1.19 |
| SCO2140 | Putative transcriptional regulator | Defined family regulators | 1.11 |
| SCO6336 | Hypothetical protein | Hypothetical protein | 1.10 |
| SCO5998 | Putative bifunctional protein (putative MurA2) | Periplasmic/exported/lipoproteins | 1.09 |
| SCO2950 | DNA‐binding protein Hu hs1 | Other regulation | 1.07 |
| SCO5494 | Putative DNA ligase ligA | Macromolecule metabolism | 0.88 |
| SCO4727 | 30S ribosomal protein S13 rpsM | Ribosome | 0.81 |
| SCO4709 | 50S ribosomal protein L16 rplP | Ribosome | 0.80 |
| SCO6099 | Adenylylsulfate kinase cysC | Central intermediary metabolisms | 0.76 |
| SCO2198 | Glutamine synthetase I glnA | Amino acid biosynthesis | 0.76 |
| SCO5368 | ATP synthase C chain atpE | Energy metabolism; carbons | 0.66 |
Thirty‐four genes differentially regulated in M751 compared with M145 at TP1 selected from the microarray were analysed by qRT‐PCR. Their ID, annotation and functional annotation are indicated in the table. Also the fold change of expression in M751 compared with M145 is reported in the last column. In bold, the genes whose differential expression have been confirmed by microarray and qRT‐PCR, independently. The genes are sorted by fold change.
Global expression analysis of the growth curve
Moreover, to explore the global effects on the transcriptome during the entire growth curve, we calculated average log2 expression ratios of mutant versus wild‐type expression at each time point. The differential expression profiles at all time points were analysed using PCA to identify major patterns in differential expression across the growth curve. The two major patterns are shown in Fig. 2C. Principal component 1 (PC‐1), which accounted for 24% of the variance in the difference profiles, contained genes which displayed a tendency to be lower expressed in M145 at time points 4 and 5 compared with M751 (Fig. 2C). Principal component 2 (PC‐2), which accounted for 19% of the variance, showed that some genes were lower expressed in the wild type at all time points before and after transition phase (TP5) compared with the mutant (Fig. 2C). Among the genes with the most extreme values along either PC‐1 or PC‐2, two main groups were identified with characteristic differential expression profiles. The first group comprised mostly genes involved in secondary metabolism that were upregulated (or silenced) in the mutant from exponential phase (TP1 or TP2) until late stationary phase (TP8). The second group consists of those genes with expression profiles that are alike but shifted by one time point earlier in the mutant compared with the wild type; this group contained mostly genes involved in primary metabolism and morphological differentiation, as well as the conservon 9 (discussed below).
Group I: gene clusters up‐ or down‐regulated throughout the time series
This group mainly consists of secondary metabolism gene clusters. Consistent with the observed earlier and more intense production of undecylprodigiosin, the microarray analysis revealed that the average of genes of the red biosynthetic cluster (SCO5877–5898) were expressed at higher values all along the growth curve and decreased in expression only very late at TP8 in the mutant, while in the wild‐type transcription peaked at TP4 and TP5 (transition phase) and decreased immediately afterwards (Fig. 3). In addition to undecylprodigiosin, scbA mutant M751 overproduced the blue‐pigmented actinorhodin, also consistent with an earlier report (Takano et al., 2001). The expression profile of its biosynthetic cluster act (SCO5071–5091) peaked at TP5 and TP6 (transition and early stationary phase) in the wild type, but was already almost twofold higher at TP4 in the mutant (Fig. 3). Earlier expression of redD and redQ (the main activator and the acyl carrier protein in the red cluster respectively), actII‐orf4 and actIII (the main activator and the ketoacyl reductase in the act cluster respectively) was confirmed by qRT‐PCR (Fig. 4A and B).
Figure 3.
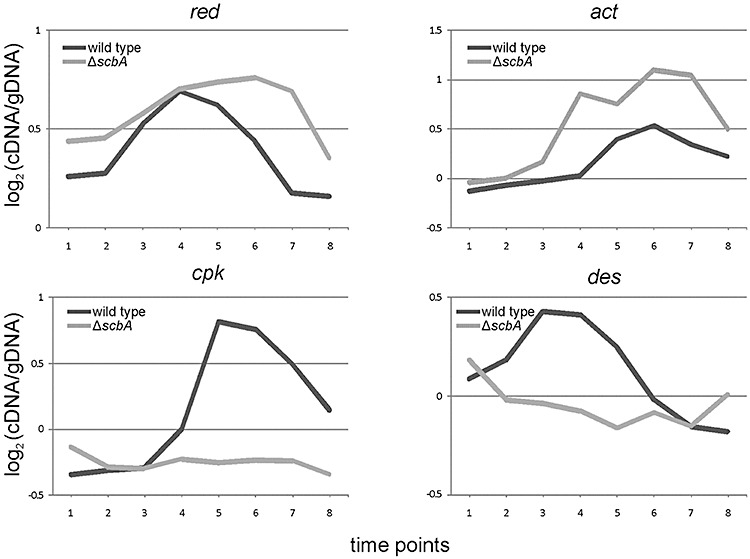
Expression profiles of secondary metabolism genes in the wild type and the ΔscbA mutant. The average expression profiles of the secondary metabolite biosynthetic clusters red (SCO5877–5898), act (SCO5071–5091), cpk (SCO6268–6288) and des (SCO2782–2785) during the time‐course are plotted for the wild type (dark line) and the ΔscbA mutant (light line). A list of the genes and their expression data is included in Table S3.
Figure 4.
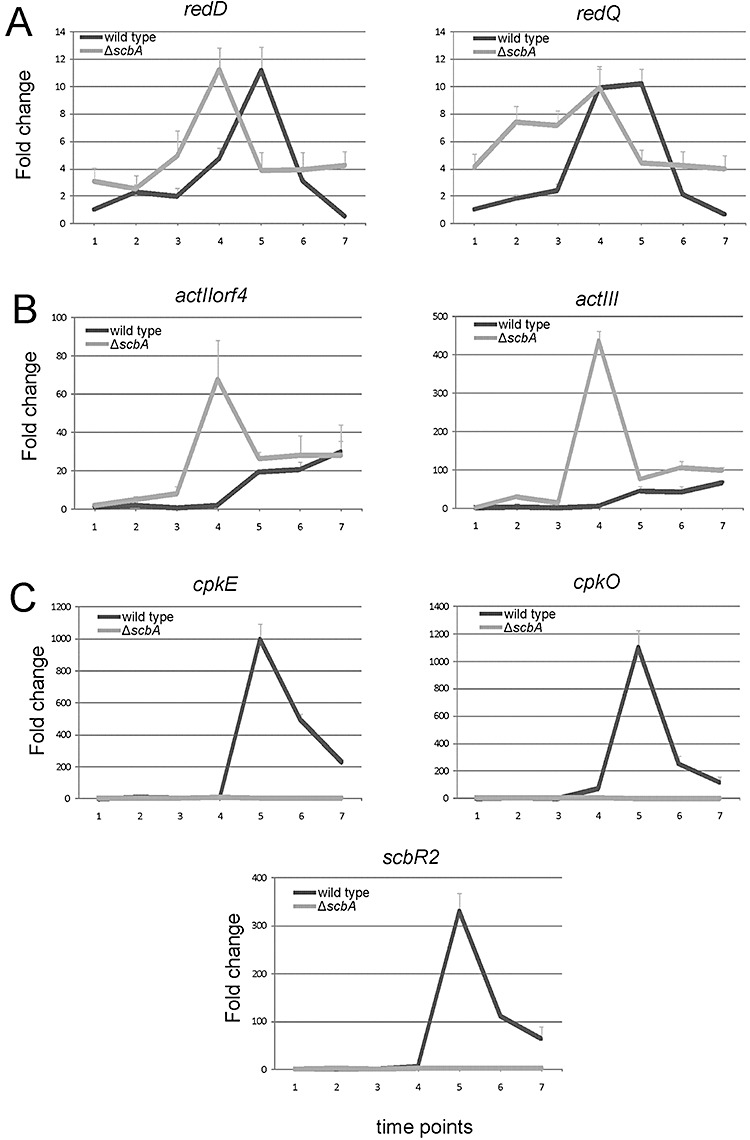
Quantitative RT‐PCR for selected genes. Expression profiles of genes of the red cluster [redD (SCO5877) and redQ (SCO5887)] (A), the act cluster [actII‐orf4 (SCO5085) and actIII (SCO5086)] (B), the cpk cluster [cpkE (SCO6277), cpkO (SCO6280) and scbR2 (SCO6286)] (C) are plotted for the wild type (dark line) and the ΔscbA mutant (light line). The expression for each gene is compared with the value in M145 at TP1, which is set as 1. Standard deviation at each time point is denoted in a thin light line.
Most dramatically, the cpk cluster (SCO6268–6288) was silenced in M751 throughout the entire growth curve (Fig. 3), while in the wild type it showed a sharp overexpression from TP4 onwards, coinciding with the expression peak of scbA and scbR (Fig. S1). Also, by qRT‐PCR analysis, the expression of three genes in the cluster, namely cpkE (homologue to epoxide hydrolase) and the two regulators cpkO and scbR2[homologue to scbR and negative regulator of the cluster (Gottelt et al., 2010)], was confirmed to be the same as the microarray analysis (Fig. 4C). Interestingly, the direct neighbours of the cpk cluster, SCO6265 (scbR) and SCO6267 (scbC) (Fig. S1), were also drastically downregulated. SCO6265 encodes the γ‐butyrolactones receptor ScbR while SCO6267 encodes the γ‐butyrolactones synthase ScbC (Nieselt et al., 2010) and has 76% identity in amino acid sequence to BrpA, an oxidoreductase involved in reduction of the butanolide during A‐factor biosynthesis in S. griseus (Kato et al., 2007). The desferrioxamine E biosynthetic cluster des (SCO2782–SCO2785) has a reverse expression profile, compared with the red and act clusters, and was strongly downregulated from TP2 onwards in M751 (Fig. 3). Desferrioxamine E is the main siderophore in S. coelicolor (Barona‐Gomez et al., 2004).
Group II: gene clusters shifted by one time point earlier in the mutant compared with the wild type
Our microarray analysis showed that the expression profile of ace (for conversion of pyruvate to acetyl‐CoA), the ACCase complex (from acetyl‐CoA to malonyl‐CoA) and the PPP (pentose phosphate pathway) genes is shifted one time point earlier in M751 compared with the wild type (Fig. 5). This pattern is weak for individual genes, but highly consistent across the set of genes involved. Similarly, although to a somewhat less extent, the gene expression of the glycolysis pathway was also shifted (Fig. 5). Streptomyces coelicolor has been shown to differentiate in liquid media (Manteca et al., 2008). A set of genes involved in morphological differentiation were found expressed and appeared to be shifted to one time point earlier in M751 (Fig. 6). These genes are ramS, encoding for SapB (Kodani et al., 2004), nepA (de Jong et al., 2009), chpH (Claessen et al., 2003), bldG and sigK (Mao et al., 2009a; Parashar et al., 2009). Another cluster showing a shifted expression profile to one time point earlier in the mutant compared with the wild type was the conservon 9 (Fig. 6). Conservons (cvns) are operons identified in S. coelicolor (Bentley et al., 2002) and conserved specifically in species belonging to Actinomycetales (Komatsu et al., 2006).
Figure 5.
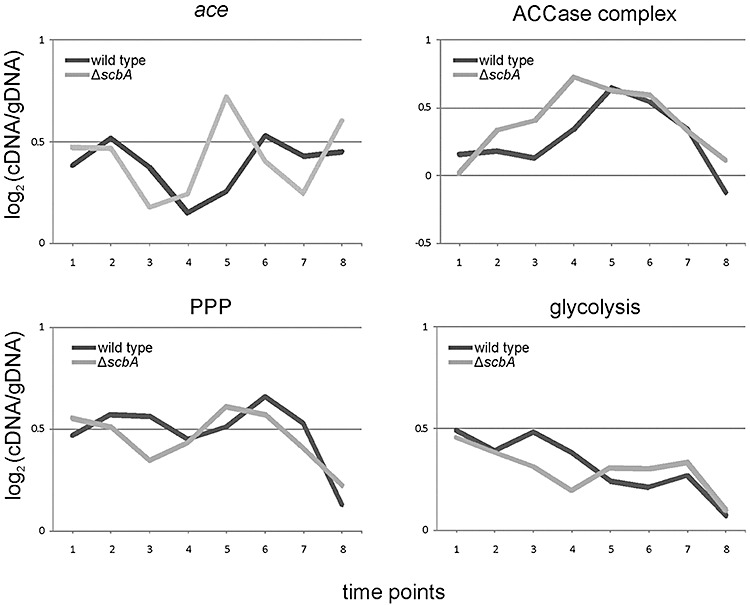
Expression profiles of primary metabolism genes in M145 and the ΔscbA mutant. The average of genes involved in conversion of pyruvate to acetyl‐CoA (ace) and from acetyl‐CoA to malonyl‐CoA (ACCase complex) and the average expression profiles of the primary metabolism genes for the PPP and glycolysis pathways during the time‐course are plotted for M145 (dark line) and the ΔscbA mutant (light line). A list of the genes and their expression data is included in the Table S3.
Figure 6.
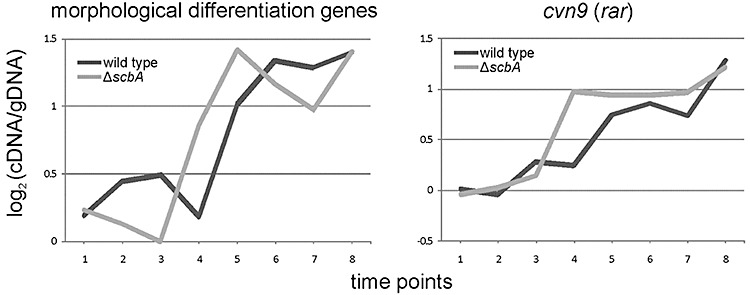
Expression profiles of morphological differentiation genes and conservon 9. The average expression profiles of a set of morphological differentiation genes and the conservon 9 [cvn9 (rar)] are plotted for M145 (dark line) and the ΔscbA mutant (light line). A list of the genes and their expression data are included in Table S3.
Putative non‐coding RNAs are differentially regulated in M751
Our group has recently predicted the presence of small non‐coding RNAs (ncRNAs) in inter‐ and intragenic loci in the S. coelicolor genome and experimentally confirmed the presence of 13 antisense ncRNAs (D'Alia et al., 2009). Because of technical reasons (the microarray in this study is PCR‐based) it was not possible to separately analyse the messenger and antisense transcripts. Nevertheless, 11 short coding sequences (maximum length 300 bp), which we predicted as ncRNA and which are annotated as encoding unknown or hypothetical proteins, were strongly upregulated in the γ‐butyrolactone‐impaired mutant at TP4 (Fig. 7).
Figure 7.
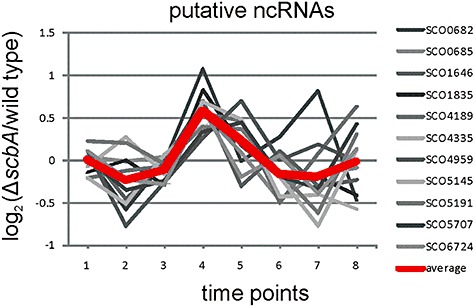
Expression profiles of putative ncRNAs. The fold change between the ΔscbA mutant and M145 of expression profiles of 11 genes (indicated at the side) overlapping putative ncRNAs are plotted. The average is emphasized by a thick red line. A list of the genes and their expression data is included in Table S3.
Discussion
The microarray and qRT‐PCR analyses reported in this study showed that the earlier and more intense production of Act and Red in the γ‐butyrolactone signalling mutant M751 is the direct effect of changes in the expression of their biosynthetic clusters. This observation points at the involvement of the butanolide system in regulating the act and red clusters at a transcriptional level, perhaps via an intermediate regulator. Furthermore, we could show that the cpk cluster was silenced throughout the growth in the mutant. These data agree with the reported abolished expression of cpkO, the pathway‐specific activator of the cpk cluster in the scbA mutant (Takano et al., 2005). This explains the previously reported discrepancy in the γ‐butyrolactone synthase mutant antibiotic production phenotype observed in S. coelicolor compared with that in S. griseus and S. virginiae (Hara and Beppu, 1982; Kawachi et al., 2000). In a fashion similar to the systems in S. griseus and S. virginiae, where deleting the signalling molecules synthase impairs streptomycin and virginiamycin production, deleting the butanolides synthase ScbA impairs cpk expression.
Another secondary metabolite cluster drastically affected by deleting scbA was the siderophore desferrioxamine E biosynthesis. In contrast, the biosynthetic clusters of the siderophore coelichelin (Lautru et al., 2005) and the siderophore‐like coelibactin (Hesketh et al., 2009) did not show any remarkable difference in expression between the two strains (data not shown). Taken together, this would presumably lead to a decrease in intracellular iron levels. Interestingly, it has been shown that iron limitation enhances intracellular production and export of actinorhodin in S. coelicolor (Coisne et al., 1999). To our knowledge, this is the first report of a siderophore whose control involves the γ‐butyrolactone system.
In a similar context, it has been reported that blocking the A‐factor cascade in S. griseus results in strong changes in secondary metabolism (Ohnishi et al., 2008; Hara et al., 2009). The two cited reports showed that in addition to the streptomycin biosynthesis genes, several other genes for secondary metabolites were induced by the A‐factor system: three putative non‐ribosomal peptide synthetase (NRPS) clusters, a type I polyketide synthase (PKS), a lantibiotic and a putative melanin biosynthesis clusters, a putative terpene cyclase and two signalling molecules receptor homologues.
Another very important effect shown by the global gene expression analysis was the apparent earlier shift of the primary metabolism genes. This includes the genes for PPP and glycolysis pathways, and genes for the conversion of pyruvate to acetyl‐CoA (ace) and malonyl‐CoA (acc). This effect would have been impossible to discover in a more targeted analysis. These findings agree with the earlier production of antibiotics, suggesting that the deletion of scbA causes a shift of the primary metabolism pathways, which is required for Act and Red production. In particular, earlier and more intense expression of genes encoding the ACCase complex in M751 increases the amount of available malonyl‐CoA, an essential precursor for Act and Red biosynthesis (Cerdeno et al., 2001; Beltran‐Alvarez et al., 2007). This is also in agreement with the observation that the peak in expression of the ace genes is at TP5 in the mutant, when also the act cluster is actively transcribed. In this phase, the cell needs more acetyl‐CoA to sustain synthesis of malonyl‐CoA. These findings agree with the reported increase of actinorhodin by increasing the levels of its precursor malonyl‐CoA by overexpressing acetyl‐CoA carboxylase acc (Ryu et al., 2006). On the other hand, the earlier decrease in expression of the glycolysis genes in M751 could preserve glucose‐6‐P to be used in the PPP which is the main source of NADPH, the source of reducing power for secondary metabolism (Butler et al., 2002).
A similar shift was observed in the expression of morphological differentiation genes and conservon 9. Our transcriptional analysis revealed that several genes involved in morphological differentiation were expressed in M145 and M751 grown in liquid. Recently, it has been reported that S. coelicolor expresses developmental genes in liquid cultures and that their expression increases in time until transition phase, and then is switched off (Nieselt et al., 2010). Our analysis revealed an earlier expression of the morphological differentiation genes in M751. Earlier production of aerial hyphae or spores have not been reported in the scbA mutant (Takano et al., 2001), and we also did not observe any difference in development on solid media between the wild type and the mutant. However, the earlier expression of these genes may cause a subtle shift in time of the morphological differentiation which we cannot readily observe under the conditions used. Further analysis will be needed to reveal a potential involvement of SCBs in differentiation, as has been observed for the γ‐butyrolactones in S. griseus (Horinouchi, 2002), S. ansochromogenes (Li et al., 2003) and S. natalensis (Lee et al., 2005). A similar shift in expression of conservon 9 was also detected. Thirteen conservons have been identified in S. coelicolor (Bentley et al., 2002), and they typically consist of two genes with unknown function sandwiched between a sensor histidine kinase and an ATP/GTP‐binding protein. In four cases (cvn9–12) a cytochrome P450 is also found in the gene cluster. Disruptions of cvnA9, a histidine kinase homologue, and cvnD9, homologous to ATP/GTP‐binding protein, have been reported to lead to conditional overproduction of actinorhodin (Komatsu et al., 2003; Komatsu et al., 2006). Interestingly, the increase in expression of cvn9 overlaps with the expression peak of the act cluster, both in M145 (TP5) and M751 (TP4).
Recently, our group has shown the presence of 13 intragenic antisense ncRNAs and that at least two of them, namely cnc3669.2 and cnc3893.2, were not expressed in the wild type but were detected in the two γ‐butyrolactone deficient mutants M751 and M752 (scbR deletion mutant). We suggested a role of the signalling molecules in regulating the expression of these small transcripts (D'Alia et al., 2009). Eleven CDS encoding hypothetical proteins which overlapping with our predicted ncRNAs have been found upregulated in M751 at transition phase (TP4). Among the 11 CDS, SCO4189 nucleotide sequence is highly similar to SCO4190 (devA) encoding for a GntR‐family transcriptional regulator required for morphological development (Hoskisson et al., 2006). The high similarity is distributed along two stretches 23 and 26 nucleotides long (80% and 86% identity respectively); this result suggests a very likely annealing between the two transcripts. Therefore, SCO4189 might transcribe a ncRNA that could act on devA mRNA, decreasing its level. Strengthening this hypothesis, the differential expression profile, between the wild type and the scbA mutant, of SCO4189 and devA is anticorrelated (data not shown).
The detailed analysis of the differential expression at TP1 showed that many genes with housekeeping functions and some genes previously reported to affect antibiotic regulation were upregulated in M751 just before the onset of antibiotic production. Genes related to stress response, i.e. scoF4, smpB, dnaJ and groEL2, were upregulated in the mutant. Overexpression of csp1 (homologue to scoF4) of Streptomyces hygroscopicus in S. coelicolor has been reported to induce overproduction of both Red and Act (Martinez‐Costa et al., 2003). Furthermore, several studies have been carried out to increase antibiotic production by shock stimuli, for example heat, cold, oxidative or osmotic stress (Hayes et al., 1997; Mikulik et al., 1999; Kim et al., 2000; Sevcikova and Kormanec, 2004), and it is widely known that stress induces antibiotic production. Also the pleiotropic regulator afsS was found upregulated in M751. Overexpression of afsS in S. coelicolor (reviewed in Horinouchi, 2003) or its counterpart afsR2 in Streptomyces lividans (Vogtli et al., 1994) has been reported to enhance production of Act and Red. Among several genes encoding hypothetical proteins, SCO3893 is predicted to have a kinase domain and seems to be transcriptionally coupled to sigT (SCO3892) and rstA (SCO3891), which have been described as extracytoplasmic functions (ECF) sigma factor and anti‐sigma factor, both involved in differentiation of S. coelicolor (Mao et al., 2009b). SCO2195 has been shown to be a target of the nitrogen regulator GlnR (Tiffert et al., 2008). Because of the similarity with the system in Rhizobium leguminosarum, the authors speculate a possible interaction, and thus a regulatory function, of this small protein with the mRNA of glnA, encoding the main glutamine synthetase in S. coelicolor. Furthermore, glnA (SCO2198) was shown by our microarray analysis, to be downregulated in the mutant strain. These data are encouraging for the analysis of the other identified genes, in particular several hypothetical proteins, for their possible role in antibiotic production and morphological differentiation (see Table 1).
The present study portrays a strong link between primary and secondary metabolism and supports the idea that the SCB system has a possible role in coordinating cell metabolism in S. coelicolor. Furthermore, our data suggest a useful biotechnological approach for optimization of antibiotic production. We propose that manipulation of the γ‐butyrolactones synthase can be a successful alternative for engineering antibiotic production in microbial systems.
Experimental procedures
Bacterial strains, plasmids and growth conditions
Streptomyces strains were manipulated as described previously (Kieser et al., 2000). Supplemented minimal medium (SMM) (Takano et al., 2001) was used for RNA isolation and antibiotic production determination. MS agar (Kieser et al., 2000) was used to make spore suspensions.
Cell culture, DNA and RNA isolation
For the microarray analysis and qRT‐PCR, the same amount of S. coelicolor M145 and M751 spores was inoculated and grown in three biological replicates in SMM, and RNA was isolated at eight time points during the growth curve as previously reported (Takano et al., 2001).
cDNA preparation, labelling and microarray hybridization
cDNA preparation and labelling was performed as previously described (Takano et al., 2005). Ten micrograms of labelled cDNA and 0.2 µg of labelled genomic DNA (gDNA) were hybridized to PCR‐based microarray slides from the University of Minnesota comprising 7629 genes. After 16 h of hybridization and three subsequent washing steps the arrays were scanned with an Affymetrix Array scanner 417.
Analysis of microarray data
Raw data collection was performed using ImaGene (as described in Takano et al., 2005). Further statistical and bioinformatical analyses were performed using the R language ( http://www.r‐project.org) and packages from the Bioconductor project (limma, marray, multtest, hcluster). The data were normalized using print‐tip loess normalization and between‐array scale normalization available from the limma package. gDNA was used as common reference for all hybridizations. The relative fluorescence intensity of cDNA to gDNA (log2 expression value) indicates the transcript abundance at each time point in each strain. Differentially expressed genes were calculated for the three replicates using Welch's two‐sample t‐test, the non‐parametric Mann–Whitney test and the Rank Product test. The intersection of genes with P‐value < 0.05 of the t‐test and Mann–Whitney test was combined with genes that had a multiple‐testing corrected pfp < 0.05 in the Rank Product test.
cDNA synthesis and qRT‐PCR
DNase treatment was performed on 10 µg of each RNA sample with 10 U of DNase I (Roche), and the absence of chromosomal DNA contamination was checked by PCR using the primers hrdBrtoutfw/hrdBrtoutrv (Table S2). To synthesize cDNA, 2 µg of RNA was annealed to 1.8 µg of random hexamers (Invitrogen) and incubated at 70°C for 10 min; to this 5× First‐Strand Buffer, DTT to final 10 mM, dNTPs to final 1 mM and 100 U of Superscript II (Invitrogen) were added in a final volume of 30 µl and the mixture was incubated at 25°C for 10 min, 37°C for 5 min and 42°C for 100 min. qRT‐PCR experiments were performed using the ABI Prism 7500FAST system (Applied Biosystems). Each 25 µl reaction contained 12.5 µl of SYBR Green PCR Master Mix (Applied Biosystems), 10 ng of cDNA (or water for the negative control), 10 pmol of each primer (listed in Table S2) and 9.5 µl of water. The reaction parameters were as following: 95°C for 10 min, followed by 40 two‐step amplification cycles consisting of 30 s denaturation at 95°C and 1 min of annealing and extension at 60°C. A final dissociation step was run to generate a melting curve and consequently verify the specificity of amplification products. Real‐time PCR was monitored and analysed by the Sequence Detection System version 1.3 (Applied Biosystems), and relative expression levels were normalized to mRNA of the major vegetative sigma factor (hrdB). All samples were run in triplicate.
Acknowledgments
We are grateful to Martha Merrow for the use of the ABI Prism 7500FAST. We also thank Frank Gold and Salim Charaniya from the University of Minnesota for experimental help in the microarray analysis. D.D. was funded by a University of Groningen GBB bursary, E.T. by a University of Groningen Rosalind Franklin Fellowship.
Supporting Information
Additional Supporting Information may be found in the online version of this article:
Expression profiles of the butanolide cluster. Expression profiles of scbA (SCO6266) (values from qRT‐PCR analysis), scbR (SCO6265) (values from qRT‐PCR analysis) and scbC (SCO6267) (values from microarray analysis) are plotted for M145 (dark line) and the ΔscbA mutant (light line). The expression fold change for scbA and scbR is compared with the value in M145 at TP1, which is set as 1. Standard deviation for scbA and scbR qRT‐PCR analysis at each time point is denoted in a thin light line.
Table S1. Differentially expressed genes from TP1.
Table S2. Primers used for qRT‐PCR.
Expression data. Expression values of individual genes in the clusters shown in Figs 3, 5, 6 and 7. The columns indicate the SCO number, the gene name (if available) and the normalized expression value from the microarray analysis at each time point in the wild‐type M145 and the mutant M751.
Please note: Wiley-Blackwell are not responsible for the content or functionality of any supporting materials supplied by the authors. Any queries (other than missing material) should be directed to the corresponding author for the article.
References
- Akopiants K., Florova G., Li C., Reynolds K.A. Multiple pathways for acetate assimilation in Streptomyces cinnamonensis. J Ind Microbiol Biotechnol. 2006;33:141–150. doi: 10.1007/s10295-005-0029-4. [DOI] [PubMed] [Google Scholar]
- Anderson T.B., Brian P., Champness W.C. Genetic and transcriptional analysis of absA, an antibiotic gene cluster‐linked two‐component system that regulates multiple antibiotics in Streptomyces coelicolor. Mol Microbiol. 2001;39:553–566. doi: 10.1046/j.1365-2958.2001.02240.x. [DOI] [PubMed] [Google Scholar]
- Barona‐Gomez F., Wong U., Giannakopulos A.E., Derrick P.J., Challis G.L. Identification of a cluster of genes that directs desferrioxamine biosynthesis in Streptomyces coelicolor M145. J Am Chem Soc. 2004;126:16282–16283. doi: 10.1021/ja045774k. [DOI] [PubMed] [Google Scholar]
- Beltran‐Alvarez P., Cox R.J., Crosby J., Simpson T.J. Dissecting the component reactions catalyzed by the actinorhodin minimal polyketide synthase. Biochemistry. 2007;46:14672–14681. doi: 10.1021/bi701784c. [DOI] [PubMed] [Google Scholar]
- Bentley S.D., Chater K.F., Cerdeno‐Tarraga A.M., Challis G.L., Thomson N.R., James K.D. Complete genome sequence of the model actinomycete Streptomyces coelicolor A3(2) Nature. 2002;417:141–147. doi: 10.1038/417141a. et al. [DOI] [PubMed] [Google Scholar]
- Butler M.J., Bruheim P., Jovetic S., Marinelli F., Postma P.W., Bibb M.J. Engineering of primary carbon metabolism for improved antibiotic production in Streptomyces lividans. Appl Environ Microbiol. 2002;68:4731–4739. doi: 10.1128/AEM.68.10.4731-4739.2002. [DOI] [PMC free article] [PubMed] [Google Scholar]
- Camilli A., Bassler B.L. Bacterial small‐molecule signaling pathways. Science. 2006;311:1113–1116. doi: 10.1126/science.1121357. [DOI] [PMC free article] [PubMed] [Google Scholar]
- Cerdeno A.M., Bibb M.J., Challis G.L. Analysis of the prodiginine biosynthesis gene cluster of Streptomyces coelicolor A3(2): new mechanisms for chain initiation and termination in modular multienzymes. Chem Biol. 2001;8:817–829. doi: 10.1016/s1074-5521(01)00054-0. [DOI] [PubMed] [Google Scholar]
- Claessen D., Rink R., de Jong W., Siebring J., de Vreugd P., Boersma F.G. A novel class of secreted hydrophobic proteins is involved in aerial hyphae formation in Streptomyces coelicolor by forming amyloid‐like fibrils. Genes Dev. 2003;17:1714–1726. doi: 10.1101/gad.264303. et al. [DOI] [PMC free article] [PubMed] [Google Scholar]
- Coisne S., Bechet M., Blondeau R. Actinorhodin production by Streptomyces coelicolor A3(2) in iron‐restricted media. Lett Appl Microbiol. 1999;28:199–202. doi: 10.1046/j.1365-2672.1999.00509.x. [DOI] [PubMed] [Google Scholar]
- Cundliffe E. Control of tylosin biosynthesis in Streptomyces fradiae. J Microbiol Biotechnol. 2008;18:1485–1491. [PubMed] [Google Scholar]
- D'Alia D., Nieselt K., Steigele S., Muller J., Verburg I., Takano E. Non‐coding RNA of glutamine synthetase I modulates antibiotic production in Streptomyces coelicolor A3(2) J Bacteriol. 2009;192:1160–1164. doi: 10.1128/JB.01374-09. [DOI] [PMC free article] [PubMed] [Google Scholar]
- Gottelt M., Gomez‐Escribano J.P., Bibb M., Takano E. Awakening cryptic antibiotic gene clusters: The CPK gene cluster in Streptomyces coelicolor is involved in the production of a yellow pigmented secondary metabolite. Microbiology. 2010;156:2343–2353. doi: 10.1099/mic.0.038281-0. [DOI] [PubMed] [Google Scholar]
- Hara O., Beppu T. Mutants blocked in streptomycin production in Streptomyces griseus– the role of A‐factor. J Antibiot (Tokyo) 1982;35:349–358. doi: 10.7164/antibiotics.35.349. [DOI] [PubMed] [Google Scholar]
- Hara H., Ohnishi Y., Horinouchi S. DNA microarray analysis of global gene regulation by A‐factor in Streptomyces griseus. Microbiology. 2009;155:2197–2210. doi: 10.1099/mic.0.027862-0. [DOI] [PubMed] [Google Scholar]
- Hayes A., Hobbs G., Smith C.P., Oliver S.G., Butler P.R. Environmental signals triggering methylenomycin production by Streptomyces coelicolor A3(2) J Bacteriol. 1997;179:5511–5515. doi: 10.1128/jb.179.17.5511-5515.1997. [DOI] [PMC free article] [PubMed] [Google Scholar]
- Hesketh A., Kock H., Mootien S., Bibb M. The role of absC, a novel regulatory gene for secondary metabolism, in zinc‐dependent antibiotic production in Streptomyces coelicolor A3(2) Mol Microbiol. 2009;74:1427–1444. doi: 10.1111/j.1365-2958.2009.06941.x. [DOI] [PubMed] [Google Scholar]
- Horinouchi S. A microbial hormone, A‐factor, as a master switch for morphological differentiation and secondary metabolism in Streptomyces griseus. Front Biosci. 2002;7:d2045–d2057. doi: 10.2741/A897. [DOI] [PubMed] [Google Scholar]
- Horinouchi S. AfsR as an integrator of signals that are sensed by multiple serine/threonine kinases in Streptomyces coelicolor A3(2) J Ind Microbiol Biotechnol. 2003;30:462–467. doi: 10.1007/s10295-003-0063-z. [DOI] [PubMed] [Google Scholar]
- Hoskisson P.A., Rigali S., Fowler K., Findlay K.C., Buttner M.J. DevA, aGntR‐like transcriptional regulator required for development in Streptomyces coelicolor. J Bacteriol. 2006;188:5014–5023. doi: 10.1128/JB.00307-06. [DOI] [PMC free article] [PubMed] [Google Scholar]
- Hsiao N.H., Soding J., Linke D., Lange C., Hertweck C., Wohlleben W., Takano E. ScbA from Streptomyces coelicolor A3(2) has homology to fatty acid synthases and is able to synthesize gamma‐butyrolactones. Microbiology. 2007;153:1394–1404. doi: 10.1099/mic.0.2006/004432-0. [DOI] [PubMed] [Google Scholar]
- Hsiao N.H., Nakayama S., Merlo M.E., de Vries M., Bunet R., Kitani S. Analysis of two additional signaling molecules in Streptomyces coelicolor and the development of a butyrolactone‐specific reporter system. Chem Biol. 2009;16:951–960. doi: 10.1016/j.chembiol.2009.08.010. et al. [DOI] [PubMed] [Google Scholar]
- de Jong W., Manteca A., Sanchez J., Bucca G., Smith C.P., Dijkhuizen L. NepA is a structural cell wall protein involved in maintenance of spore dormancy in Streptomyces coelicolor. Mol Microbiol. 2009;71:1591–1603. doi: 10.1111/j.1365-2958.2009.06633.x. et al. [DOI] [PubMed] [Google Scholar]
- Kato J.Y., Funa N., Watanabe H., Ohnishi Y., Horinouchi S. Biosynthesis of gamma‐butyrolactone autoregulators that switch on secondary metabolism and morphological development in Streptomyces. Proc Natl Acad Sci USA. 2007;104:2378–2383. doi: 10.1073/pnas.0607472104. [DOI] [PMC free article] [PubMed] [Google Scholar]
- Kawachi R., Akashi T., Kamitani Y., Sy A., Wangchaisoonthorn U., Nihira T., Yamada Y. Identification of an AfsA homologue (BarX) from Streptomyces virginiae as a pleiotropic regulator controlling autoregulator biosynthesis, virginiamycin biosynthesis and virginiamycin M1 resistance. Mol Microbiol. 2000;36:302–313. doi: 10.1046/j.1365-2958.2000.01819.x. [DOI] [PubMed] [Google Scholar]
- Khokhlov A.S., Tovarova I.I., Borisova L.N., Pliner S.A., Shevchenko L.N., Kornitskaia E.I. [The A‐factor, responsible for streptomycin biosynthesis by mutant strains of Actinomyces streptomycini. Dokl Akad Nauk SSSR. 1967;177:232–235. et al. [PubMed] [Google Scholar]
- Kieser T., Bibb M.J., Buttner M.J., Chater K.F., Hopwood D.A. Crowes; 2000. [Google Scholar]
- Kim C.J., Chang Y.K., Chun G.T. Enhancement of kasugamycin production by pH shock in batch cultures of Streptomyces kasugaensis. Biotechnol Prog. 2000;16:548–552. doi: 10.1021/bp000038f. [DOI] [PubMed] [Google Scholar]
- Kodani S., Hudson M.E., Durrant M.C., Buttner M.J., Nodwell J.R., Willey J.M. The SapB morphogen is a lantibiotic‐like peptide derived from the product of the developmental gene ramS in Streptomyces coelicolor. Proc Natl Acad Sci USA. 2004;101:11448–11453. doi: 10.1073/pnas.0404220101. [DOI] [PMC free article] [PubMed] [Google Scholar]
- Komatsu M., Kuwahara Y., Hiroishi A., Hosono K., Beppu T., Ueda K. Cloning of the conserved regulatory operon by its aerial mycelium‐inducing activity in an amfR mutant of Streptomyces griseus. Gene. 2003;306:79–89. doi: 10.1016/s0378-1119(03)00405-0. [DOI] [PubMed] [Google Scholar]
- Komatsu M., Takano H., Hiratsuka T., Ishigaki Y., Shimada K., Beppu T., Ueda K. Proteins encoded by the conservon of Streptomyces coelicolor A3(2) comprise a membrane‐associated heterocomplex that resembles eukaryotic G protein‐coupled regulatory system. Mol Microbiol. 2006;62:1534–1546. doi: 10.1111/j.1365-2958.2006.05461.x. [DOI] [PubMed] [Google Scholar]
- Landini P., Antoniani D., Burgess J.G., Nijland R. Molecular mechanisms of compounds affecting bacterial biofilm formation and dispersal. Appl Microbiol Biotechnol. 2010;86:813–823. doi: 10.1007/s00253-010-2468-8. [DOI] [PubMed] [Google Scholar]
- Lautru S., Deeth R.J., Bailey L.M., Challis G.L. Discovery of a new peptide natural product by Streptomyces coelicolor genome mining. Nat Chem Biol. 2005;1:265–269. doi: 10.1038/nchembio731. [DOI] [PubMed] [Google Scholar]
- Lee K.M., Lee C.K., Choi S.U., Park H.R., Kitani S., Nihira T., Hwang Y.I. Cloning and in vivo functional analysis by disruption of a gene encoding the gamma‐butyrolactone autoregulator receptor from Streptomyces natalensis. Arch Microbiol. 2005;184:249–257. doi: 10.1007/s00203-005-0047-7. [DOI] [PubMed] [Google Scholar]
- Lee Y.J., Kitani S., Nihira T. Null mutation analysis of an afsA‐family gene, barX, that is involved in biosynthesis of the {gamma}‐butyrolactone autoregulator in Streptomyces virginiae. Microbiology. 2010;156:206–210. doi: 10.1099/mic.0.032003-0. [DOI] [PubMed] [Google Scholar]
- Li W., Liu G., Tan H. Disruption of sabR affects nikkomycin biosynthesis and morphogenesis in Streptomyces ansochromogenes. Biotechnol Lett. 2003;25:1491–1497. doi: 10.1023/a:1025402902098. [DOI] [PubMed] [Google Scholar]
- Manteca A., Alvarez R., Salazar N., Yagüe P., Sanchez J. Mycelium differentiation and antibiotic production in submerged cultures of Streptomyces coelicolor. Appl Environ Microbiol. 2008;74:3877–3886. doi: 10.1128/AEM.02715-07. [DOI] [PMC free article] [PubMed] [Google Scholar]
- Mao X.M., Zhou Z., Hou X.P., Guan W.J., Li Y.Q. Reciprocal regulation between SigK and differentiation programs in Streptomyces coelicolor. J Bacteriol. 2009a;191:6473–6481. doi: 10.1128/JB.00875-09. [DOI] [PMC free article] [PubMed] [Google Scholar]
- Mao X.M., Zhou Z., Cheng L.Y., Hou X.P., Guan W.J., Li W.Q. Involvement of SigT and RstA in the differentiation of Streptomyces coelicolor. FEBS Lett. 2009b;583:3145–3150. doi: 10.1016/j.febslet.2009.09.025. [DOI] [PubMed] [Google Scholar]
- Martin J.F., Liras P. Engineering of regulatory cascades and networks controlling antibiotic biosynthesis in Streptomyces. Curr Opin Microbiol. 2010;13:263–273. doi: 10.1016/j.mib.2010.02.008. [DOI] [PubMed] [Google Scholar]
- Martinez‐Costa O.H., Zalacain M., Holmes D.J., Malpartida F. The promoter of a cold‐shock‐like gene has pleiotropic effects on Streptomyces antibiotic biosynthesis. FEMS Microbiol Lett. 2003;220:215–221. doi: 10.1016/S0378-1097(03)00101-0. [DOI] [PubMed] [Google Scholar]
- Mikulik K., Khanh‐Hoang Q., Halada P., Bezouskova S., Benada O., Behal V. Expression of the Csp protein family upon cold shock and production of tetracycline in Streptomyces aureofaciens. Biochem Biophys Res Commun. 1999;265:305–310. doi: 10.1006/bbrc.1999.1673. [DOI] [PubMed] [Google Scholar]
- Nieselt K., Battke F., Herbig A., Bruheim P., Wentzel A., Jakobsen O.M. The dynamic architecture of the metabolic switch in Streptomyces coelicolor. BMC Genomics. 2010;11:10. doi: 10.1186/1471-2164-11-10. et al. [DOI] [PMC free article] [PubMed] [Google Scholar]
- Ohnishi Y., Ishikawa J., Hara H., Suzuki H., Ikenoya M., Ikeda H. Genome sequence of the streptomycin‐producing microorganism Streptomyces griseus IFO 13350. J Bacteriol. 2008;190:4050–4060. doi: 10.1128/JB.00204-08. et al. [DOI] [PMC free article] [PubMed] [Google Scholar]
- Parashar A., Colvin K.R., Bignell D.R., Leskiw B.K. BldG and SCO3548 interact antagonistically to control key developmental processes in Streptomyces coelicolor. J Bacteriol. 2009;191:2541–2550. doi: 10.1128/JB.01695-08. [DOI] [PMC free article] [PubMed] [Google Scholar]
- Ryu Y.G., Butler M.J., Chater K.F., Lee K.J. Engineering of primary carbohydrate metabolism for increased production of actinorhodin in Streptomyces coelicolor. Appl Environ Microbiol. 2006;72:7132–7139. doi: 10.1128/AEM.01308-06. [DOI] [PMC free article] [PubMed] [Google Scholar]
- Santamarta I., Perez‐Redondo R., Lorenzana L.M., Martin J.F., Liras P. Different proteins bind to the butyrolactone receptor protein ARE sequence located upstream of the regulatory ccaR gene of Streptomyces clavuligerus. Mol Microbiol. 2005;56:824–835. doi: 10.1111/j.1365-2958.2005.04581.x. [DOI] [PubMed] [Google Scholar]
- Sevcikova B., Kormanec J. Differential production of two antibiotics of Streptomyces coelicolor A3(2), actinorhodin and undecylprodigiosin, upon salt stress conditions. Arch Microbiol. 2004;181:384–389. doi: 10.1007/s00203-004-0669-1. [DOI] [PubMed] [Google Scholar]
- Soh B.S., Loke P., Sim T.S. Cloning, heterologous expression and purification of an isocitrate lyase from Streptomyces clavuligerus NRRL 3585. Biochim Biophys Acta. 2001;1522:112–117. doi: 10.1016/s0167-4781(01)00309-8. [DOI] [PubMed] [Google Scholar]
- Subramoni S., Venturi V. LuxR‐family ‘solos’: bachelor sensors/regulators of signalling molecules. Microbiology. 2009;155:1377–1385. doi: 10.1099/mic.0.026849-0. [DOI] [PubMed] [Google Scholar]
- Takano E., Nihira T., Hara Y., Jones J.J., Gershater C.J., Yamada Y., Bibb M. Purification and structural determination of SCB1, a gamma‐butyrolactone that elicits antibiotic production in Streptomyces coelicolor A3(2) J Biol Chem. 2000;275:11010–11016. doi: 10.1074/jbc.275.15.11010. [DOI] [PubMed] [Google Scholar]
- Takano E., Chakraburtty R., Nihira T., Yamada Y., Bibb M.J. A complex role for the gamma‐butyrolactone SCB1 in regulating antibiotic production in Streptomyces coelicolor A3(2) Mol Microbiol. 2001;41:1015–1028. doi: 10.1046/j.1365-2958.2001.02562.x. [DOI] [PubMed] [Google Scholar]
- Takano E., Kinoshita H., Mersinias V., Bucca G., Hotchkiss G., Nihira T. A bacterial hormone (the SCB1) directly controls the expression of a pathway‐specific regulatory gene in the cryptic type I polyketide biosynthetic gene cluster of Streptomyces coelicolor. Mol Microbiol. 2005;56:465–479. doi: 10.1111/j.1365-2958.2005.04543.x. et al. [DOI] [PubMed] [Google Scholar]
- Tiffert Y., Supra P., Wurm R., Wohlleben W., Wagner R., Reuther J. The Streptomyces coelicolor GlnR regulon: identification of new GlnR targets and evidence for a central role of GlnR in nitrogen metabolism in actinomycetes. Mol Microbiol. 2008;67:861–880. doi: 10.1111/j.1365-2958.2007.06092.x. [DOI] [PubMed] [Google Scholar]
- Vogtli M., Chang P.C., Cohen S.N. afsR2: a previously undetected gene encoding a 63‐amino‐acid protein that stimulates antibiotic production in Streptomyces lividans. Mol Microbiol. 1994;14:643–653. doi: 10.1111/j.1365-2958.1994.tb01303.x. [DOI] [PubMed] [Google Scholar]
Associated Data
This section collects any data citations, data availability statements, or supplementary materials included in this article.
Supplementary Materials
Expression profiles of the butanolide cluster. Expression profiles of scbA (SCO6266) (values from qRT‐PCR analysis), scbR (SCO6265) (values from qRT‐PCR analysis) and scbC (SCO6267) (values from microarray analysis) are plotted for M145 (dark line) and the ΔscbA mutant (light line). The expression fold change for scbA and scbR is compared with the value in M145 at TP1, which is set as 1. Standard deviation for scbA and scbR qRT‐PCR analysis at each time point is denoted in a thin light line.
Table S1. Differentially expressed genes from TP1.
Table S2. Primers used for qRT‐PCR.
Expression data. Expression values of individual genes in the clusters shown in Figs 3, 5, 6 and 7. The columns indicate the SCO number, the gene name (if available) and the normalized expression value from the microarray analysis at each time point in the wild‐type M145 and the mutant M751.