

Summary
To increase production of the important pharmaceutical compound clavulanic acid, a β‐lactamase inhibitor, both random mutagenesis approaches and rational engineering of Streptomyces clavuligerus strains have been extensively applied. Here, for the first time, we compared genome‐wide gene expression of an industrial S. clavuligerus strain, obtained through iterative mutagenesis, with that of the wild‐type strain. Intriguingly, we found that the majority of the changes contributed not to a complex rewiring of primary metabolism but consisted of a simple upregulation of various antibiotic biosynthesis gene clusters. A few additional transcriptional changes in primary metabolism at key points seem to divert metabolic fluxes to the biosynthetic precursors for clavulanic acid. In general, the observed changes largely coincide with genes that have been targeted by rational engineering in recent years, yet the presence of a number of previously unexplored genes clearly demonstrates that functional genomic analysis can provide new leads for strain improvement in biotechnology.
Introduction
Streptomyces clavuligerus is an important industrial microorganism, which produces the β‐lactam antibiotic cephamycin C (Martín and Liras, 1989) and the β‐lactamase inhibitor clavulanic acid (Saudagar et al., 2008). Clavulanic acid is produced worldwide on a large scale, and co‐formulated with amoxicillin in Augmentin (Brogden et al., 1981). Two biotechnological strain optimization approaches have been utilized to increase the production of clavulanic acid by the bacterium: rational metabolic engineering and iterative optimization through random mutagenesis and screening.
In the rational approach, a specific gene is knocked out or overexpressed to divert metabolic fluxes towards the antibiotic biosynthetic pathways. Arguably, the best example comes from the work of Li and Townsend (2006), who re‐engineered the S. clavuligerus glycolytic pathway by constructing a deletion mutant of the glyceraldehyde 3‐phosphate dehydrogenase gene gap1 to increase the pool of the clavulanic acid precursor glycerol 3‐phosphate (G3P). This doubled clavulanic acid production compared to the wild‐type. Overexpression of the regulatory proteins CcaR and ClaR also led to clavulanic acid overproduction (Hung et al., 2007), and the two strategies have recently been combined successfully in a single strain (Jnawali et al., 2010).
Yet, most or even all production strains that are used in industry have been obtained by classical strain improvement (Adrio and Demain, 2006), based on mutagenesis with mutagens such as nitrosoguanidine (NTG). Little is known about the exact genetic changes through which high production titers are achieved in these mutants.
Recently, we published the genome sequence of S. clavuligerus ATCC 27064 (Medema et al., 2010). We now employed this information to perform a genome‐wide transcriptome study on an industrial production strain, which has been generated from the ATCC 27064 type strain (Higgens and Kastner, 1971) by several iterations of mutagenesis and screening, and produces clavulanic acid at levels approximately 100× that of the wildtype. The majority of observed changes consist of increased transcript levels of the antibiotic biosynthesis gene clusters. These observations are in agreement with flux‐balance analysis (FBA) predictions using a constraint‐based genome‐scale metabolic model constructed for S. clavuligerus. However, we also detected some potentially crucial transcript level changes in primary metabolism that could contribute to the increased production of clavulanic acid by redirection of fluxes, mimicking strategies utilized in rational approaches.
Results and discussion
Increased transcription of secondary metabolite biosynthesis gene clusters in strain DS48802
Comparing gene transcript levels of S. clavuligerus wild‐type and DS48802 strains during stationary phase using microarrays, almost all genes ranking high in a differential transcriptome analysis belong to the complete clavulanic acid/cephamycin C supercluster, which is significantly overexpressed (between twofold and eightfold) in the DS48802 strain compared to the wild‐type. Interestingly, the pathway‐specific regulator genes claR and ccaR are also overexpressed in DS48802. They are located within the same supercluster and their products have been shown to regulate it positively (Alexander and Jensen, 1998; Paradkar et al., 1998).
Additionally, the clavams gene cluster (cvm1245 and cas1) and the ‘paralogous’ alanylclavam cluster (orfABCD and ceaS1/pah1/bls1/oat1) are significantly overexpressed (Fig. 1), as is the two‐component system involving Cvm7p (SCLAV_p1079‐p1080) that induces expression of the alanylclavam cluster (Tahlan et al., 2007). This suggests the presence of a regulatory mechanism common to all these clusters. CcaR is an unlikely candidate for such a common regulatory factor, as it does not appear to control the paralogous cluster (Tahlan et al., 2004); the pleiotropic regulator AdpA (SCLAV_1957) is a more likely candidate, as it is known to induce clavulanic acid expression (Lopez‐García et al., 2010) and its gene is transcribed almost 2.5 times stronger in DS48802.
Figure 1.
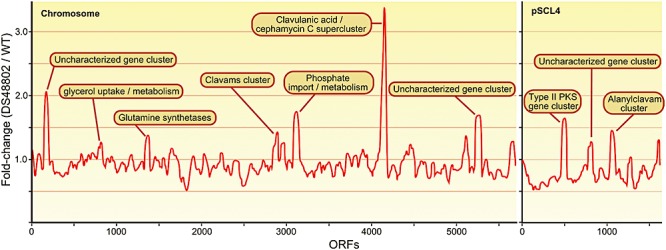
Differential gene expression in S. clavuligerus DS48802 and ATCC 27064. Sliding window plot (size = 50) of the difference in gene expression between S. clavuligerus DS48802 and wild‐type ATCC 27064. Key upregulated operons or genes at the peaks are noted in the figure. See Table S2 for description of the ten gene clusters shown. For gene expression analysis, cultivations were performed in shake flasks directly inoculated with spore suspensions at 28°C and 280 r.p.m. The semi‐synthetic growth medium used consisted of 30 g l−1 glycerol, 5 g l−1 wheat gluten, 3.5 g l−1 asparagine monohydrate, 1.5 g l−1l‐lysine, 0.7 g l−1 KH2PO4, 0.3 g l−1 MgSO4·7H2O, 0.2 g l−1 CaCl2·2H2O, 0.2 g l−1 FeSO4·7H2O, 10 g l−1 MOPS, 0.1 ml l−1 Basilodon and 1 ml l−1 trace elements solution at pH 7.0. The trace element solution consisted of 20.4 g l−1 H2SO4, 50 g l−1 citric acid H2O, 16.75 g l−1 ZnSO4·7H2O, 1.6 g l−1 CuSO4. 5 H2O, 1.5 g l−1 MnCl2·4H2O, 2 g l−1 H3BO3 and 2 g l−1 Na2MoO4·2H2O. After 70 h of cultivation, the cells were harvested by centrifugation, treated with RNAprotect (Qiagen) and directly frozen with liquid nitrogen and stored at −80°C. To isolate total RNA, the frozen mycelium was ground in a mortar, resuspended in TE buffer with 5 mg l−1 lysozyme and incubated for 5 min at room temperature. RNA isolation and purification were performed using phenol extraction (TRIzol reagent, Invitrogen) and RNeasy Kit (Qiagen). The RNA was quantified by measuring the absorbance at 260 nm. Biotinylated cDNA was prepared after fragmentation according to the standard Affymetrix protocol using GC rich (average 72%) primers from 10 µg total RNA. For hybridization, 5 µg and 7 µg biotinylated cDNA were used per Affymetrix gene Chip. Microarray data have been deposited at Gene Expression Omnibus (http://www.ncbi.nlm.nih.gov/geo/) under accession number GSE24033. Flux‐balance analysis was performed using a recently published genome‐scale metabolic model of S. clavuligerus (Medema et al., 2010). In this study, we slightly changed our objective function and included both clavulanic acid and cephamycin C biosynthesis pathways. We dynamically changed the antibiotic concentration in the biomass composition based on experimental observations of Romero and colleagues (1984) and optimized the objective function for different concentrations of each antibiotic. Among the 785 genes that the model contains, 497 genes showed non‐zero flux for at least one antibiotic concentration. We calculated Spearman correlation of fluxes of each reaction with increasing antibiotic concentrations. If an enzyme was involved in multiple reactions, we assigned the flux which had the highest r2.
In contrast to, for example, the intrachromosomal amplification of the kanamycin biosynthesis gene cluster in Streptomyces kanamyceticus (Yanai et al., 2006), hybridization of S. clavuligerus DS48802 genomic DNA to the microarrays revealed no amplifications of genes or gene clusters (data not shown). The overproduction that we observe therefore appears to be caused by transcriptional (and post‐transcriptional) changes only.
Flux‐balance analysis of increased clavulanic acid production correlates well with transcriptomic data
While many changes have occurred during the generation of the DS48802 strain through mutagenesis, it is important to note that changes in transcription levels of many genes may be due to random mutations that have no impact on antibiotic biosynthesis. In order to assess which changes could be causatively linked to antibiotic overproduction, we computationally predicted the metabolic fluxes during antibiotic overproduction, using a constraints‐based genome‐scale metabolic network model of S. clavuligerus (Medema et al., 2010). We dynamically modelled the metabolic flux changes during increased production of clavulanic acid and cephamycin C with different rates of antibiotic production relative to the biomass, based on the experimental observations of Romero and colleagues (1984). Interestingly, the computational predictions made through dynamic FBA are largely in line with the observed expression changes. Eighty‐seven genes were predicted to be upregulated (positively correlated with antibiotic production; r > 0.6) and 129 genes were predicted to be downregulated (negatively correlated; r < −0.6) at increasing antibiotic production levels. Forty per cent (15/37) of the genes that actually showed increased transcript levels (fold change > 2) were also predicted to do so according to FBA, and these include all genes encoding key biosynthetic enzymes known to be involved in clavulanic acid and cephamycin C biosynthesis. Even though 40% does not appear to be a very large percentage, these predictions are statistically very significant according to a Fisher's exact test (P = 0.0005; see Table S1). One should note that FBA predicts the flux for every reaction, not for every gene product, as multiple gene products can be involved in a single reaction. Therefore, in these cases the same flux was assigned to all gene products involved in that particular reaction, which is not necessarily the case in the actual gene expression, as only a single homologue or isoenzyme could be actively performing the reaction and thus would be differentially expressed. Out of the 47 different enzymatic reactions predicted to be upregulated (associated with 87 genes), 26 (55%) have at least one gene linked to them, which showed increased transcript levels. As both our FBA and gene transcript analysis pointed to an increased expression of the clavulanic acid and cephamycin core biosynthesis genes, we suggest that this is a crucial change required for antibiotic overproduction in this strain. Moreover, as the FBA indicated that the absolute fluxes required for high production of the secondary metabolites are minor compared to other fluxes involved in maintenance and cellular growth, a complete redirection of primary metabolism appears not to be necessary for overproduction.
Gene expression changes in primary metabolism
Nonetheless, because clavulanic acid is synthesized from the precursors G3P and l‐arginine, which play important roles in primary metabolism, specific changes in the primary metabolism of DS48802 could have occurred during the various random mutagenesis rounds, so that the intracellular pools of these intermediates are increased.
Indeed, glycerol uptake and metabolism (SCLAV_0631‐0632 and SCLAV_0877‐0879) is clearly upregulated over twofold in DS48802, indicating an improved utilization of glycerol as a carbon source as well as increased production of the clavulanic acid precursor G3P (Fig. 2). Moreover, the aconitase and citrate synthase from the citric acid cycle appear to be downregulated. A likely explanation for this is that the carbon flux from G3P in this direction is reduced and is partly redirected to clavulanic acid biosynthesis. This situation is remarkably similar to the result of the rationally constructed gap1 deletion that blocked G3P conversion into 1,3‐bisphosphoglycerate, thus improving clavulanic acid biosynthesis by increasing the intracellular G3P pool (Li and Townsend, 2006). However, an advantage of the situation in DS48802, which seems to have an incomplete downregulation of the flux, could be that a considerable pool of acetyl‐CoA is maintained, e.g. for the biosynthesis of ornithine from glutamate. DS48802 also seems to avoid the potential negative effects of a complete deletion of the aconitase and citrate synthase genes: a complete absence of these enzyme activities could lead to acidogenesis with negative consequences for secondary metabolite production as shown by Viollier and colleagues (2001a,b). Moreover, DS48802 still seems to be able to synthesize α‐ketoglutarate (a co‐substrate required for clavaminic acid biosynthesis; Salowe et al., 1990), while achieving the benefits of higher acetyl‐CoA and/or G3P pools that have made these genes attractive targets for rational engineering to improve antibiotic production (Viollier et al., 2001a). A potentially important observation that we cannot explain yet from the current data are the differential transcript level changes of the two pyruvate kinase isoenzyme genes, one being downregulated (SCLAV_4329) and the other being upregulated (SCLAV_1203).
Figure 2.
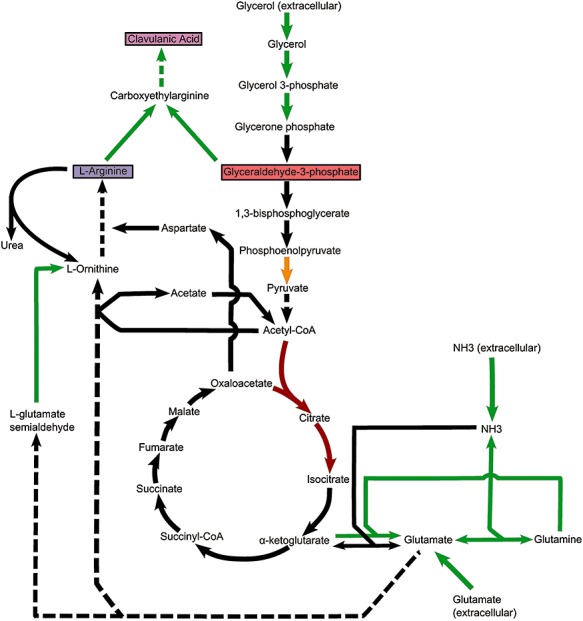
Changes in S. clavuligerus primary and secondary metabolism affecting clavulanic acid production. Changes in gene expression in S. clavuligerus DS48802 compared to the wild‐type ATCC 27064 projected onto a metabolic map. Green arrows represent reactions catalyzed by genes expressed over twofold higher in DS48802 than in the wild‐type. Red arrows represent reactions catalyzed by genes expressed over twofold lower in DS48802. The orange arrow represents the reaction catalyzed by pyruvate kinase, for which two isoenzymes exist which have changed in expression differently, one being downregulated (SCLAV_4329) and the other being upregulated (SCLAV_1203). Black arrows represent unchanged steps; solid arrows represent single biosynthetic steps; and dashed arrows represent multiple steps.
We also observed a remarkable upregulation of glutamine synthetases I and II (SCLAV_1416 and SCLAV_1431), glutamate synthetases (SCLAV_1231) and glutamate importers (SCLAV_4660‐4663). Glutamate can serve as a source for biosynthesis of the clavulanic acid precursor arginine. This conversion takes place through the urea cycle involving ornithine as an intermediate (Rodríguez‐García et al., 2000), addition of which to the medium has been shown to strongly enhance clavulanic acid biosynthesis (Cheng et al., 2003). Probably to overcome nitrogen and phosphate limitations, genes encoding the transporters for ammonia (SCLAV_4534) and phosphate (SCLAV_3166‐3169) are also observed to be more highly transcribed in DS48802. This may be caused by the increased expression of the pathway‐specific activator genes phoU (SCLAV_3220, Ghorbel et al., 2006) and glnB (SCLAV_4535, Drepper et al., 2003), which both show over twofold increased transcription.
Conclusions
Our data show that a strain improvement program by random mutagenesis and screening has caused gene transcript changes in both primary and secondary metabolism. The overlap with results obtained by rational metabolic engineering through claR/ccaR overexpression and gap1 deletion is intriguing. New leads from transcript changes observed in this study, such as the increased transcription of glutamine and glutamate synthetase genes, and of those encoding ammonium and phosphate transporters, can now be combined to rationally design novel high‐producer strains. This approach might avoid the introduction of unwanted adverse effects from random mutagenesis, and provide strains suited for industrial application in a more efficient way. In this manner, functional genomics allows two key strategies applied in biotechnology – random mutagenesis and rational engineering – to become increasingly complementary.
Acknowledgments
This work was supported by the Dutch Technology Foundation STW, which is the applied science division of NWO, and the Technology Programme of the Ministry of Economic Affairs [STW 10463]. R.Br. is supported by an NWO‐Vidi fellowship, and E.T. by a Rosalind Franklin Fellowship, University of Groningen. We thank Bert Koekman for providing the classically improved strain DS48802. We thank Hilde Huininga and Hildegard Menke for technical assistance with DNA and RNA isolations.
Supporting Information
Additional Supporting Information may be found in the online version of this article:
Table S1. Statistical significance and comparison of transcriptional changes with FBA predictions using different cut‐offs.
Table S2. Description and gene expression data of gene clusters upregulated in S. clavuligerus DS48802.
Please note: Wiley-Blackwell are not responsible for the content or functionality of any supporting materials supplied by the authors. Any queries (other than missing material) should be directed to the corresponding author for the article.
References
- Adrio J.L., Demain A.L. Genetic improvement of processes yielding microbial products. FEMS Microbiol Rev. 2006;30:187–214. doi: 10.1111/j.1574-6976.2005.00009.x. [DOI] [PubMed] [Google Scholar]
- Alexander D.C., Jensen S.E. Investigation of the Streptomyces clavuligerus cephamycin C gene cluster and its regulation by the CcaR protein. J Bacteriol. 1998;180:4068–4079. doi: 10.1128/jb.180.16.4068-4079.1998. [DOI] [PMC free article] [PubMed] [Google Scholar]
- Brogden R.N., Carmine A., Heel R.C., Morley P.A., Speight T.M., Avery G.S. Amoxycillin/clavulanic acid: a review of its antibacterial activity, pharmacokinetics and therapeutic use. Drugs. 1981;22:337–362. doi: 10.2165/00003495-198122050-00001. [DOI] [PubMed] [Google Scholar]
- Cheng K.C., Lin Y.H., Wu J.Y., Hwang S.C.J. Enhancement of clavulanic acid production in Streptomyces clavuligerus with ornithine feeding. Enzyme Microb Technol. 2003;32:152–156. [Google Scholar]
- Drepper T., Gross S., Yakunin A.F., Hallenbeck P.C., Masepohl B., Klipp W. Role of GlnB and GlnK in ammonium control of both nitrogenase systems in the phototrophic bacterium Rhodobacter capsulatus. Microbiology. 2003;149:2203–2212. doi: 10.1099/mic.0.26235-0. [DOI] [PubMed] [Google Scholar]
- Ghorbel S., Kormanec J., Artus A., Virolle M.J. Transcriptional studies and regulatory interactions between the phoR‐phoP operon and the phoU, mtpA, and ppk genes of Streptomyces lividans TK24. J Bacteriol. 2006;188:677–686. doi: 10.1128/JB.188.2.677-686.2006. [DOI] [PMC free article] [PubMed] [Google Scholar]
- Higgens C.E., Kastner R.E. Streptomyces clavuligerus sp. nov., a β‐lactam antibiotic producer. Int J Syst Bacteriol. 1971;21:326–331. [Google Scholar]
- Hung T.V., Malla S., Park B.C., Liou K., Lee H.C., Sohng J.K. Enhancement of clavulanic acid by replicative and integrative expression of ccaR and cas2 in Streptomyces clavuligerus NRRL3585. J Microbiol Biotechnol. 2007;17:1538–1545. [PubMed] [Google Scholar]
- Jnawali H.N., Lee H.C., Sohng J.K. Enhancement of clavulanic acid production by expressing regulatory genes in gap gene deletion mutant of Streptomyces clavuligerus NRRL3585. J Microbiol Biotechnol. 2010;20:146–152. [PubMed] [Google Scholar]
- Li R., Townsend C.A. Rational strain improvement for enhanced clavulanic acid production by genetic engineering of the glycolytic pathway in Streptomyces clavuligerus. Metab Eng. 2006;8:240–252. doi: 10.1016/j.ymben.2006.01.003. [DOI] [PubMed] [Google Scholar]
- Lopez‐García M.T., Santamarta I., Liras P. Morphological differentiation and clavulanic acid formation are affected in an S. clavuligerusΔadpA‐deleted mutant. Microbiology. 2010;156:2354–2365. doi: 10.1099/mic.0.035956-0. [DOI] [PubMed] [Google Scholar]
- Martín J.F., Liras P. Enzymes involved in penicillin, cephalosporin and cephamycin biosynthesis. Adv Biochem Eng Biotechnol. 1989;39:153–187. doi: 10.1007/BFb0051954. [DOI] [PubMed] [Google Scholar]
- Medema M.H., Trefzer A., Kovalchuk A., van den Berg M., Müller U., Heijne W. The sequence of a 1.8‐Mb bacterial linear plasmid reveals a rich evolutionary reservoir of secondary metabolic pathways. Genome Biol Evol. 2010;2:212–224. doi: 10.1093/gbe/evq013. et al. [DOI] [PMC free article] [PubMed] [Google Scholar]
- Paradkar A.S., Aidoo K.A., Jensen S.E. A pathway‐specific transcriptional activator regulates late steps of clavulanic acid biosynthesis in Streptomyces clavuligerus. Mol Microbiol. 1998;27:831–843. doi: 10.1046/j.1365-2958.1998.00731.x. [DOI] [PubMed] [Google Scholar]
- Rodríguez‐García A., de la Fuente A., Pérez‐Redondo R., Martín J.F., Liras P. Characterization and expression of the arginine biosynthesis gene cluster of Streptomyces clavuligerus. J Mol Microbiol Biotechnol. 2000;2:543–550. [PubMed] [Google Scholar]
- Romero J., Liras P., Martin J.F. Dissociation of cephamycin and clavulanic acid biosynthesis. Appl Microbiol Biotechnol. 1984;20:318–325. [Google Scholar]
- Salowe S.P., Marsh E.N., Townsend C.A. Purification and characterization of clavaminate synthase from Streptomyces clavuligerus: an unusual oxidative enzyme in natural product biosynthesis. Biochemistry. 1990;29:6499–6508. doi: 10.1021/bi00479a023. [DOI] [PubMed] [Google Scholar]
- Saudagar P.S., Survase S.A., Singhal R.S. Clavulanic acid: a review. Biotechnol Adv. 2008;26:335–351. doi: 10.1016/j.biotechadv.2008.03.002. [DOI] [PubMed] [Google Scholar]
- Tahlan K., Anders C., Jensen S.E. The paralogous pairs of genes involved in clavulanic acid and clavam metabolite biosynthesis are differently regulated in Streptomyces clavuligerus. J Bacteriol. 2004;186:6286–6297. doi: 10.1128/JB.186.18.6286-6297.2004. [DOI] [PMC free article] [PubMed] [Google Scholar]
- Tahlan K., Anders C., Wong A., Mosher R.H., Beatty P.H., Brumlik M.J. 5S clavam biosynthetic genes are located in both the clavam and paralog gene clusters in Streptomyces clavuligerus. Chem Biol. 2007;14:131–142. doi: 10.1016/j.chembiol.2006.11.012. et al. [DOI] [PubMed] [Google Scholar]
- Viollier P.H., Minas W., Dale G.E., Folcher M., Thompson C.J. Role of acid metabolism in Streptomyces coelicolor morphological differentiation and antibiotic biosynthesis. J Bacteriol. 2001a;183:3184–3192. doi: 10.1128/JB.183.10.3184-3192.2001. [DOI] [PMC free article] [PubMed] [Google Scholar]
- Viollier P.H., Nguyen K.T., Minas W., Folcher M., Dale G.E., Thompson C.J. Roles of aconitase in growth, metabolism, and morphological differentiation of Streptomyces coelicolor. J Bacteriol. 2001b;183:3193–3203. doi: 10.1128/JB.183.10.3193-3203.2001. [DOI] [PMC free article] [PubMed] [Google Scholar]
- Yanai K., Murakami T., Bibb M. Amplification of the entire kanamycin biosynthetic gene cluster during empirical strain improvement of Streptomyces kanamyceticus. Proc Natl Acad Sci USA. 2006;103:9661–9666. doi: 10.1073/pnas.0603251103. [DOI] [PMC free article] [PubMed] [Google Scholar]
Associated Data
This section collects any data citations, data availability statements, or supplementary materials included in this article.
Supplementary Materials
Table S1. Statistical significance and comparison of transcriptional changes with FBA predictions using different cut‐offs.
Table S2. Description and gene expression data of gene clusters upregulated in S. clavuligerus DS48802.