

Abstract
Background
To examine psychoacoustics in mice, we have used 2,2,2-tribromoethanol anesthesia in multiple studies. We find this drug is fast-acting and yields consistent results, providing 30 – 40 min of anesthesia. Our recent studies in binaural hearing prompted development of a regimen to anesthesia time to one hour. We tested a novel cocktail using 2,2,2-tribromoethanol coupled with low dose chloral hydrate to extend the effective anesthesia time.
New Method
We have established an intraperitoneal dosing regimen for 2,2,2-tribromoethanol-chloral hydrate anesthesia. To measure efficacy of the drug cocktail, we measured auditory brainstem responses (ABRs) at 10 min intervals to determine the effects on hearing thresholds and wave amplitudes and latencies.
Results
This novel drug combination increases effective anesthesia to one hour. ABR Wave I amplitudes, but not latencies, are marginally suppressed. Additionally, amplitudes of the centrally-derived Waves III and V show significant inter-animal variability that is independent of stimulus intensity. These data argue against the systematic suppression of ABRs by the drug cocktail.
Comparison with Existing Methods
Using 2,2,2-tribromoethanol-chloral hydrate combination in psychoacoustic studies has several advantages over other drug cocktails, the most important being preservation of latencies from centrally- and peripherally-derived ABR waves. In addition, hearing thresholds are unchanged and wave amplitudes are not systematically suppressed, although they exhibit greater variability.
Conclusions
We demonstrate that 375 mg/kg 2,2,2-tribromoethanol followed after five min by 200 mg/kg chloral hydrate provides an anesthesia time of 60 min, has negligible effects on ABR wave latencies and thresholds and non-systematic effects on amplitudes.
Keywords: 2,2,2-tribromoethanol; Amplitude; Auditory evoked potential; Avertin; Chloral hydrate; Electrophysiology; Latency; Neurophysiology; Psychoacoustics
1. INTRODUCTION
The use of rodent models for psychoacoustic studies has increased markedly in recent decades. In contrast to clinical and research studies of audition in humans using surface electrodes, many simple animal experiments are performed using subdermal electrodes under anesthesia. The least invasive method for examining the auditory pathway is to administer a temporary anesthetic, which avoids more complex surgical procedures involving the insertion of intracranial electrodes, and the subsequent complications associated with recovery and postoperative infection. Injectable anesthetics are typically administered via venous, peritoneal, muscular or subcutaneous routes depending on the differing properties of the drugs and their absorption rates (Anesthesia and Analgesia in Laboratory Animals, 2008; Flecknell, 1996). The most commonly recommended anesthetics for use in rodents include barbiturates, steroid cocktails, dissociative agents and neuroleptanalgesics.
Anesthetic drugs most commonly used for auditory studies in rodents have been limited to a combination of a dissociative anesthetic with a powerful sedative/analgesic such as ketamine / xylazine, which confers effective anesthesia over a period of 1 – 2 hours. Alternatively, more mild fast acting drugs such as 2,2,2-tribromoethanol (Forrest, et al., 1996; Gow, et al., 2004; Zheng, et al., 1999) have also been employed. However, when compared with psychoacoustic measures in awake mice, ketamine / xylazine anesthesia has been shown to alter waveform structure (McGee, et al., 1983), increase wave latencies by as much as 1 msec, and decrease wave amplitudes up to 20 % (van Looij, et al., 2004). Additionally, if injected at high doses, it causes significant respiratory depression in rodents and requires prolonged post-procedure recovery (Anesthesia and Analgesia in Laboratory Animals, 2008). Similarly, volatile inhaled anesthetics such as isoflurane have been also reported to alter ABR waveform morphology, decrease wave amplitudes and increase wave latencies and hearing thresholds in rodents (Santarelli, et al., 2003; Stronks, et al., 2010). The centrally-derived waveforms are predominantly affected in a dose dependent manner.
In contrast to such anesthetics, 2,2,2-tribromoethanol is an effective anesthesia with rapid onset and recovery times. A major advantage of this drug is its safety in rodents, with therapeutic doses far below the lethal dose. Furthermore, it neither impairs early and middle latency auditory evoked responses (Gow, et al., 2004) nor significantly suppresses respiration. However, 2,2,2-tribromoethanol is a relatively short-acting drug at doses useful for psychoacoustics, which confines auditory experiments to 25 – 30 min in duration thereby limiting experimental complexity and the extent of data collection.
The goal of the current study has been to develop an anesthesia regimen that increases the effective anesthesia time in mice, compared to a single dose of 2,2,2-tribromoethanol, without significantly compromising the quality of ABRs acquired using subdermal electrodes. Accordingly, we compared our standard regimen of 375 mg/kg 2,2,2-tribromoethanol with a drug combination comprising 375 mg/kg 2,2,2-tribromoethanol followed after 5 min by 200 mg/kg chloral hydrate. Our data show that we can increase effective anesthesia almost two-fold without compromising ABR quality.
2. MATERIALS AND METHODS
2.1 Mice
The Department of Laboratory and Animal Resources at Wayne State University maintained all mice in this study. All experiments on mice were performed in accordance with an Institutional Animal Care and Use Committee protocol approved by the Wayne State University Animal Investigation Committee. The mice used in this study were between six weeks and four months of age and were on a randomly mixed genetic background comprised of C57BL/6J and 129 Sv/Ev strains. We observed only mild age-dependent ABR threshold increases, which were consistent with previous studies on this mixed background (Gow, et al., 2004; Gow, et al., 1999).
2.2 Chemicals
A 40 x stock solution of 2,2,2-tribromoethanol (Sigma, St Louis, MO) (100 % weight / volume) was prepared by dissolving 10 gm of 2,2,2-tribromoethanol in 6.2 ml of 2-methylbutan-2-ol (Sigma, St Louis, MO) and adjusting to 10 ml. The stock was aliquoted at 250 μl in 1.5 ml plastic tubes (Thermo Fisher Scientific, Waltham, MA) and stored at -20°C. Working solutions of 2.5 % 2,2,2-tribromoethanol were prepared from a fresh aliquot of stock dissolved by vortexing in 9.75 ml sterile PBS, pH 7.4 (Cellgro, Mannassas, VA). Working solutions were stored away from light at 4°C up to two weeks.
Chloral hydrate (Sigma, St Louis, MO) was prepared as a 2 % working solution by dissolving 0.5 gm in 25 ml of sterile PBS. Working solutions were stored sterile and away from light at 25°C. The PBS was filter-sterilized using a 10 ml disposable syringe (Luer-Lok tip, BD Falcon, Franklin Lakes NJ) with a 0.22 μm filter attachment (Millipore, Carrighwahill, Ireland).
2.3 Anesthesia
Mice were anesthetized by i.p. injection with fresh 2,2,2-tribromoethanol in sterile PBS at a dose of 375 mg/kg (2,2,2-tribromoethanol cohort) as previously described (Gow, et al., 2004), and placed on a 39°C heating pad for experimentation. The mice were monitored for the absence of tail, foot, and ear reflexes, as well as reduced respiratory rate, which are all indications of effective anesthesia. Alternatively, mice received a combination of fresh 375 mg/kg, i.p., 2,2,2-tribromoethanol in sterile PBS followed by 200 mg/kg, i.p., chloral hydrate in sterile PBS (2,2,2-tribromoethanol-chloral hydrate cohort) five min after 2,2,2-tribromoethanol anesthesia was confirmed. After the completion of experiments, the mice were allowed to recover in a separate cage on a 39°C heating pad until they regained normal activity and could be placed back in their home cage. The mice were monitored periodically in their home cage for 24 hours to ensure they remained active and healthy.
2.4 Auditory brainstem response measurements
After confirming anesthesia, the fur along the top of the head and middle of the back of each mouse was sterilized / moistened with alcohol prep pads (Triad Group, INC, Hartland WI). Exposing the eyes to the alcohol pad was avoided. Subdermal platinum electrodes (Grass Technologies, West Warwick, RI) were then placed at the right and left mastoids (Negative), vertex (Reference) and hindquarters along the midline (Ground). Ten min post 2,2,2-tribromoethanol injection, and at subsequent min intervals, mice were presented with 1,024 pure-tone stimuli through bilateral sound tubes in 10 dB SPL decrements from 80 – 20 dB SPL at 32 kHz (102 μ sec duration; Blackman envelope, which is a commonly used stimulus and comprises constant rise and fall phases of the stimulus intensity of similar shape to a Gaussian curve) and a stimulus rate of 29.1 / sec. Both right and left ears were tested successively and ipsilateral EEGs were pre-amplified (100,000 x), band pass filtered (0.3 - 3 kHz) and recorded for 12.5 msec (Sepwin software version 5.1, Intelligent Hearing Systems, Miami, FL).
Amplitudes of the ABR waves were measured from the first derivative of the wave peak to that of the following trough and latencies were measured from the stimulus onset to the first derivative of each wave peak. As expected, plots of ABR wave amplitude versus increasing stimulus intensity exhibited positive slopes for all mice while the slopes of latency versus stimulus intensity plots were negative. Hearing thresholds were approximated as the lowest stimulus intensity that could evoke an ABR Wave I response.
To examine the amplitudes of Waves I, III and V as functions of anesthesia time, we initially plotted absolute amplitudes. Although we observed low inter-animal variability for the Wave I data, there was significant stochastic variability for Waves III and V that was not correlated with either anesthesia time or stimulus intensity. Alternate plots of sensation level (defined as SL = Astim – Athres, where Astim is the stimulus amplitude and Athres is the threshold amplitude) as a function of anesthesia time did not resolve this variability (data not shown).
2.5 Peritoneal cavity examination
Mice received two i.p. injections, one day apart, of sterile saline, 375 mg/kg 2,2,2-tribromoethanol in sterile saline or 2,2,2-tribromoethanol followed by 200 mg/kg chloral hydrate in sterile saline. The anesthetized mice were allowed to fully recover on a 39°C heating pad then placed back in their home cages and monitored for 24 hours. Three days after the second injection, the mice were sacrificed and their peritoneal cavities were immediately exposed and photographed (Coolpix 950, Nikon, Melville, NY) followed by a detailed analysis of the abdominal organs for signs of persistent anesthesia-induced pathology. Two independent observers blinded to the injected agent were asked to evaluate the organs using several criteria: general appearance, organ color and size relative to one another, signs of inflammation, vasodilation and the presence or absence of ascites. Eight mice were examined including two sterile PBS injected controls, three 2,2,2-tribromoethanol and three 2,2,2-tribromoethanol-chloral hydrate injected mice.
2.6 Statistics
Statistical analyses were performed using GraphPad Prism (version 5, La Jolla, CA). The latency/intensity data comparing 2,2,2-tribromoethanol and 2,2,2-tribromoethanol-chloral hydrate in Figure 2 were fit with a one-phase exponential decay model. Regression coefficients, R2, were also calculated. The data for each 10 min interval was analyzed using a one-way ANOVA with Bonferroni post-hoc testing to compare matching intensities between the anesthetic treatments. In Figure 3, normalized (to the 50 min data point) latencies and amplitudes for Waves I from each animal, and the average values from the cohort, were fit using linear regression constrained at (50,1). F-tests were used to identify significant deviances of the regression line slopes from zero. Similarly, in Figure 4, normalized (to the 50 min data point) latencies and amplitudes for Waves V from each animal, and the average values from the cohort, were fit using linear regression constrained at (50,1). F-tests were used to identify significant deviances of the regression line slopes from zero. In Figure 5, normalized (to the Day 0 data point) average weights were fit using linear regression constrained at (0,1). An F-test was used to determine if the slope of the regression line differs from zero.
Figure 2. ABR Wave I thresholds from 2,2,2-tribromoethanol and 2,2,2-tribromoethanol-chloral hydrate anesthetized cohorts.
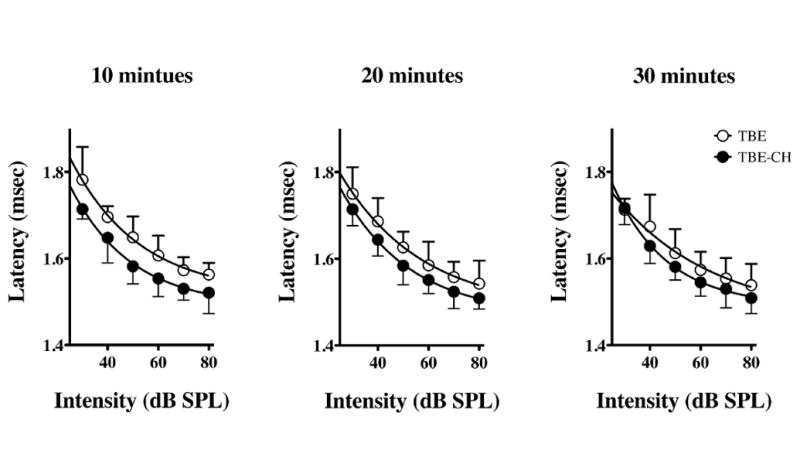
Quantified latency-intensity series of ABR Waves I under 2,2,2-tribromoethanol (TBE) or 2,2,2-tribromoethanol-chloral hydrate (TBE-CH) anesthesia at 10 min post-injection intervals. Data are plotted as mean ± SD for five mice per treatment.
Figure 3. Normalized amplitudes and latencies of Wave I from 2,2,2-tribromoethanol-chloral hydrate anesthetized mice.
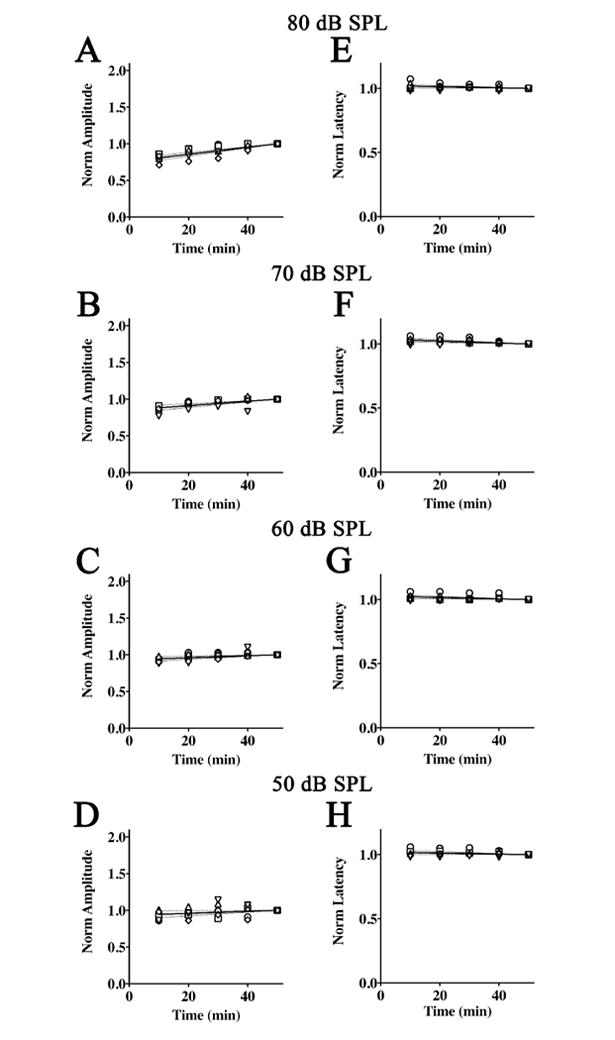
ABR threshold series were obtained at 10 min intervals during anesthesia for 50 min. Normalized Wave I amplitudes are plotted as a function of time for stimulus intensities of 80 dB SPL (A), 70 dB SPL (B), 60 dB SPL (C), and 50 dB SPL (D). The data for each mouse are normalized to amplitude at 50 min and the average linear regression line constrained at (50,1) is shown (solid line) ± 95% confidence interval (dashed lines). Normalized Wave I latencies with the average regression line constrained at (50,1) is also shown (solid line) ± 95% confidence interval (dashed lines) for intensities of 80 dB SPL (E), 70 dB SPL (F), 60 dB SPL (G), and 50 dB SPL (H).
Figure 4. Normalized amplitudes and latencies of Wave V from 2,2,2-tribromoethanol-chloral hydrate anesthetized mice.
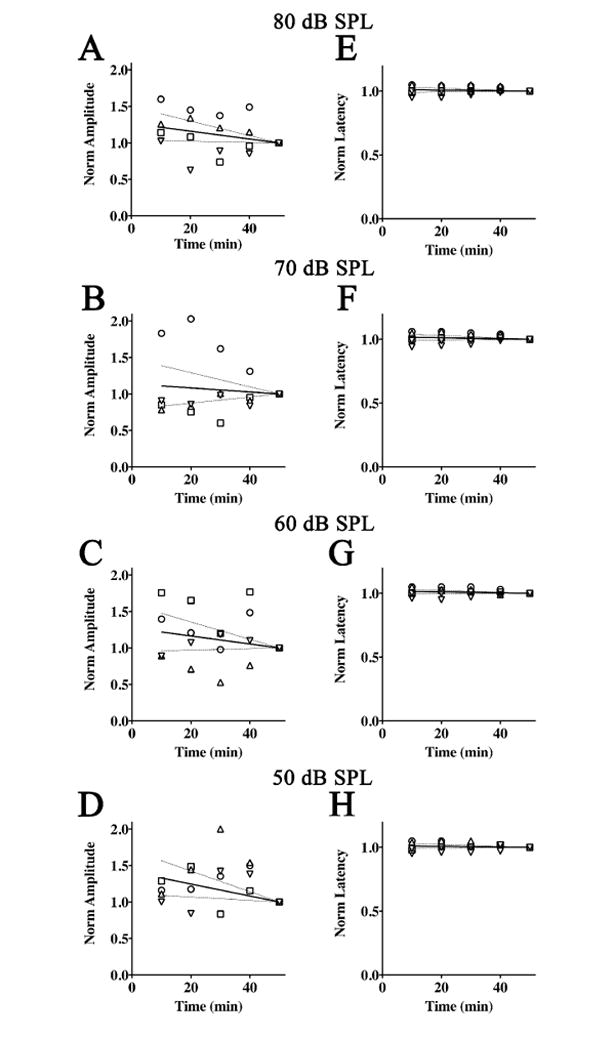
ABR threshold series were obtained at 10 min intervals during anesthesia for 50 min. Normalized Wave V amplitudes are plotted as a function of time for stimulus intensities of 80 dB SPL (A), 70 dB SPL (B), 60 dB SPL (C), and 50 dB SPL (D). The data for each mouse are normalized to amplitude at 50 min and the average linear regression line constrained at (50,1) is shown (solid line) ± 95% confidence interval (dashed lines). Normalized Wave V latencies with the average regression lines constrained at (50,1) is also shown (solid line) ± 95% confidence interval (dashed lines) for intensities of 80 dB SPL (E), 70 dB SPL (F), 60 dB SPL (G), and 50 dB SPL (H).
Figure 5. Post anesthesia effect on recovery time and weight.
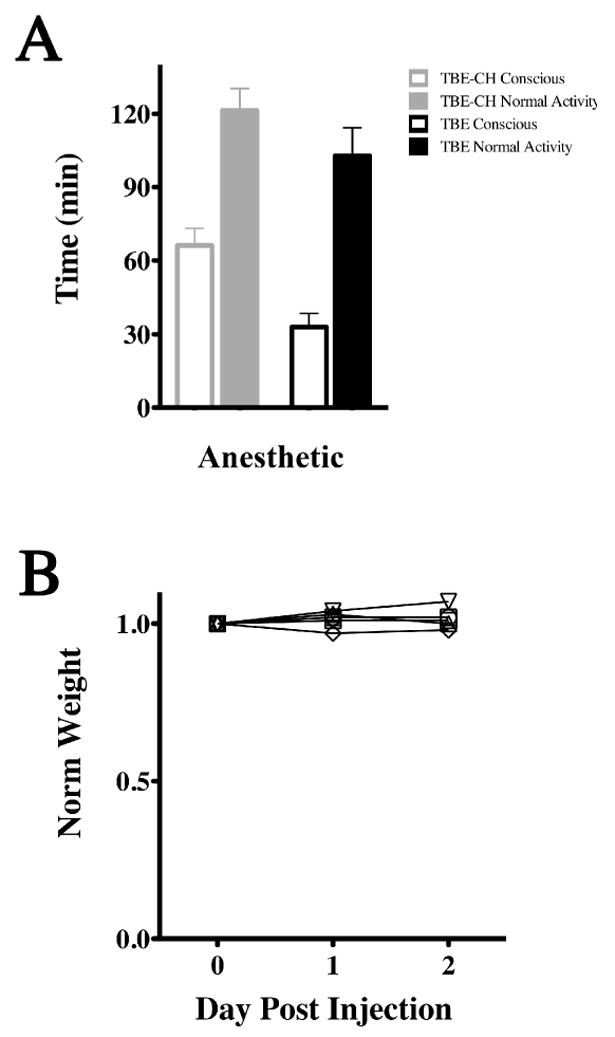
(A) Average times for mice to become conscious from anesthesia and resume normal activity. Averages are for six mice (mean ± SD) for awake and fully recovered states. 2,2,2-tribromoethanol-chloral hydrate (TBE-CH) anesthetic combination persists for 60 min with full recovery observed by two hours, where as 2,2,2-tribromoethanol alone persists for 30 min with full recovery by an hour and a half. (B) The weights of six mice are normalized to their weight on the day of anesthesia. There is no statistically significant change in weight for this cohort over three days following anesthesia (ANOVA; P = 0.272).
3. RESULTS
3.1 Minimal differences in ABR thresholds and Wave I latencies for 2,2,2-tribromoethanol versus 2,2,2-tribromoethanol-chloral hydrate anesthesia
To ascertain the impact of a 2,2,2-tribromoethanol-chloral hydrate anesthetic cocktail on mouse psychoacoustics, we examined several characteristic features of the ABRs (Figure 1A). First, we show that the five characteristic peaks and troughs of the ABR arising from generators in the eighth cranial nerve, cochlear nucleus, SOC, lateral lemniscus and inferior colliculus are evoked during either anesthetic. Second, the latency of each of these waves occurs at characteristic intervals. The first wave (Wave I) arises approximately 1.5 msec post-stimulus, followed by Waves II – V at roughly one msec intervals thereafter. Third, we find that the latency of each wave increases slightly as the stimulus intensity is progressively decreased (i.e. ABRs are right-shifted as stimulus intensity decreases).
Figure 1. Latency-intensity series of Wave I from 2,2,2-tribromoethanol and 2,2,2-tribromoethanol-chloral hydrate anesthetized mice.
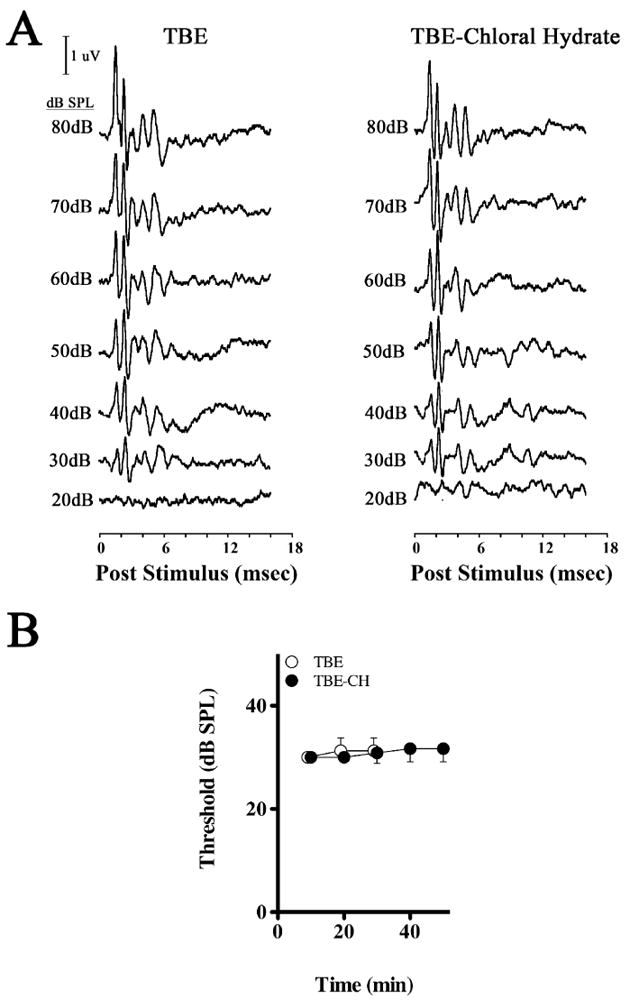
(A) Representative ABR intensity series from 2,2,2-tribromoethanol (TBE) or 2,2,2-tribromoethanol-chloral hydrate (TBE-CH) anesthetized mice measured at 10 min intervals post-injection anesthesia. (B) ABR hearing thresholds from 2,2,2-tribromoethanol (TBE) and 2,2,2-tribromoethanol-chloral hydrate (TBE-CH) anesthetized mice measured at 10 min intervals post-anesthesia.
Fourth, the lowest stimulus intensity that elicits an identifiable ABR Wave I approximates the hearing threshold of the mice (Figure 1B), the time course of which is not statistically different between mice anesthetized with 2,2,2-tribromoethanol (ANOVA; F (2,10), P = 0.5471) or 2,2,2-tribromoethanol-chloral hydrate (ANOVA; F (4,25), P = 0.3393). Regression lines for these threshold series have positive slopes (P < 0.05); however, the average threshold change is negligible at < 7 %. Finally, we find no statistical differences in the Wave I latencies between the anesthesia groups at any stimulus intensity (Table 2), indicating that both drug regimens have similar initial effects on the ABRs. Moreover, we find no statistical differences from an ANOVA (Table 2) between the cohorts for interpeak latencies of the total ABR (Waves V – I; F(5,26), P = 0.91), the peripherally-derived ABR components (Waves III – I; F(5,25), P = 0.55), or centrally-derived components (Waves V – III; F(5,25), P = 0.81).
Table 2.
Interpeak latencies of 2,2,2-tribromoethanol (TBE) and 2,2,2-tribromoethanolchloral hydrate (TBE-CH) anesthetized mice at 10 min intervals.
| Anesthesia
time (min) |
ABR Interpeak Latencies
(msec) |
|||||
|---|---|---|---|---|---|---|
| V - I | III - I | V - III | ||||
| TBE | TBE-CH | TBE | TBE-CH | TBE | TBE-CH | |
| 10 | 3.75 ± 0.13 | 3.60 ± 0.14 | 1.64 ± 0.09 | 1.64 ± 0.10 | 2.11 ± 0.14 | 1.95 ± 0.19 |
| 20 | 3.70 ± 0.19 | 3.59 ± 0.20 | 1.67 ± 0.07 | 1.64 ± 0.11 | 2.03 ± 0.21 | 1.96 ± 0.22 |
| 30 | 3.68 ± 0.22 | 3.60 ± 0.16 | 1.64 ± 0.05 | 1.69 ± 0.07 | 2.04 ± 0.23 | 1.91 ± 0.07 |
| 40 | 3.63 ± 0.13 | 1.74 ± 0.10 | 1.89 ± 0.11 | |||
| 50 | 3.56 ± 0.14 | 1.65 ± 0.09 | 1.91 ± 0.16 | |||
We also compared Wave I latencies as a function of stimulus intensity at 10 min intervals between 10 – 30 min for the 2,2,2-tribromoethanol and 2,2,2-tribromoethanol-chloral hydrate cohorts (Figure 2), after which the 2,2,2-tribromoethanol group regain consciousness. The average latencies of Wave I for all intensities (80 – 30 dB SPL) are adequately described by a one-phase exponential decay model using non-linear regression (0.66 < R2 < 0.83). The regression lines for each group converge with time, but never differ by more than 4 % on the ordinate axis at any stimulus intensity or time point, and the ordinate intercepts are not statistically significant at any time point (P > 0.37). Moreover, the Wave I latencies between the 10 and 30 min time points differ by no more than 4 % within each cohort. Together, these data indicate that there are negligible differences in ABR waveforms, latencies or hearing thresholds between the treatment groups over the time course of the experiment.
3.2 ABR amplitudes and latencies are modestly altered by 2,2,2-tribromoethanol-chloral hydrate
To determine the effects of 2,2,2-tribromoethanol-chloral hydrate on Wave I amplitudes with time, we measured ABRs in anesthetized mice at 10 min intervals for 50 min at 32 kHz. Our previous studies have shown this to be the optimal stimulus frequency for hearing experiments, providing greatest amplitudes and lowest thresholds (Gow, et al., 2004). Amplitudes of the waves were obtained from 80 dB SPL to approximately 30 dB SPL, depending on the hearing threshold of individual mice. At a stimulus intensity of 80 dB SPL (Figure 3A), we observe consistent and statistically significant reductions in Wave I amplitudes (α = 0.05; Table 3) at early time points during anesthesia, as indicated by the positive slopes of the regression lines for all mice. Regression lines at other stimulus intensities between 70 – 50 dB SPL also have positive slopes for most of the mice (Figure 3B, C, and D). Furthermore, the regression lines for the average amplitudes differ statistically from zero (α = 0.05; Table 3).
Table 3.
Tabulated p values of normalized Wave I amplitudes from 2,2,2- tribromoethanol-chloral hydrate anesthetized mice (Figure 2A-D). F-tests were used to identify statistically significant differences between the null hypothesis (m = 0), that regression line slopes do not differ from zero, for several mice (bold, italicized).
| Stimulus (dB SPL) |
P values,
[F(1,3)] |
|||||
|---|---|---|---|---|---|---|
| Mouse 1 | Mouse 2 | Mouse 3 | Mouse 4 | Mouse 5 | Group | |
| 80 | 0.006 | 0.004 | 0.001 | 0.001 | <0.001 | <0.001 |
| 70 | 0.030 | 0.005 | 0.054 | 0.006 | 0.009 | 0.003 |
| 60 | 0.542 | 0.005 | 0.732 | 0.112 | <0.001 | 0.051 |
| 50 | 0.060 | 0.051 | 0.139 | 0.588 | 0.137 | 0.022 |
| 40 | 0.004 | 0.977 | 0.006 | 0.006 | 0.030 | <0.001 |
| 30 | 0.127 | 0.009 | 0.090 | 1.000 | 0.010 | 0.239 |
Despite these non-zero slopes, the physiological effect of 2,2,2-tribromoethanol-chloral hydrate on Wave I amplitudes is relatively small. Thus, the average amplitude we observe at 80 dB SPL after 10 min of anesthesia is reduced by 19 %, compared to the 50 min time point when the mice are beginning to regain consciousness. At lower stimulus intensities, average reductions in amplitudes are 12 % at 70 dB SPL (Figure 3B) and at most 6 % for 60 – 40 dB SPL stimuli. Around the hearing threshold of 30 dB SPL, the anesthesia has little affect on Wave I amplitudes.
Similar to Wave I amplitudes, the regression lines for normalized Wave I latencies (Figure 3F, G, and H) are statistically non-zero for most individual mice (α = 0.05; Table 4), and all of the averaged data down to the hearing threshold have negative slopes. Nevertheless the absolute changes in the latencies, which are increased at early time points, are minimal. Thus, for all stimulus intensities between 80 – 30 dB SPL, we observe an increase of 3 % or less compared to the 50 min time point. Together, these data demonstrate that the 2,2,2-tribromoethanol-chloral hydrate anesthesia causes minor reductions in Wave I ABR amplitudes and negligible changes in latencies.
Table 4.
Tabulated p values for normalized Wave I latencies from 2,2,2- tribromoethanol-chloral hydrate anesthetized mice (Figure 2E-H). F-tests were used to identify statistically significant differences between the null hypothesis (m = 0), that regression line slopes do not differ from zero, for several mice (bold, italicized).
| Stimulus (dB SPL) |
P values,
[F(1,3)] |
|||||
|---|---|---|---|---|---|---|
| Mouse 1 | Mouse 2 | Mouse 3 | Mouse 4 | Mouse 5 | Group | |
| 80 | 0.001 | 0.166 | 0.004 | 0.236 | 0.166 | <0.001 |
| 70 | 0.001 | 0.001 | 0.002 | 0.670 | 0.689 | 0.002 |
| 60 | 0.005 | 0.166 | 0.001 | 0.261 | 0.099 | 0.004 |
| 50 | 0.001 | 0.010 | 0.112 | 0.193 | 0.001 | 0.005 |
| 40 | 0.046 | 0.004 | 0.003 | 0.052 | 0.014 | 0.148 |
| 30 | 0.004 | 0.031 | 0.002 | 0.501 | 0.166 | <0.001 |
The size and stability of Waves I provide the greatest sensitivity for measuring changes in ABRs, but anesthetics typically have less impact on compared to subsequent waves, particularly those derived from central signal generators. Thus, to determine the effect of 2,2,2-tribromoethanol-chloral hydrate anesthesia on the major centrally derived components, we examined normalized amplitudes and latencies of ABR Waves III (data not shown) and Waves V (Figure 4).
The Wave III amplitudes (not shown) are qualitatively similar to the Wave I data in that the slopes of the regression lines are positive; however the rates of change with time are much greater. Thus, maximal average amplitudes at 10 min are 1.5 – 3 fold smaller than those at 50 min, which suggests that Wave III may be strongly affected by 2,2,2-tribromoethanol-chloral hydrate. Unexpectedly, the magnitudes of the amplitude data are independent of stimulus intensity, which suggests a stochastic effect of the combination anesthesia. In contrast to the amplitude changes, the normalized average Wave III latencies are invariant with stimulus intensity or anesthesia time and the slopes of the regression lines are zero (α = 0.05). Together, these data suggest that the Wave III amplitudes vary in a stochastic rather than systematic manner, which may argue against a strong suppression and more toward increased amplitude variability during anesthesia. Indeed, this variability is reflected in the large 95 % confidence intervals in the 80 – 60 dB SPL data.
Figure 4A – D shows normalized amplitudes of Waves V at 10 min intervals up to 50 min under combination 2,2,2-tribromoethanol-chloral hydrate anesthesia, and normalized amplitudes are shown from 80 - 50 dB SPL. The regression lines of the averaged amplitude data between 80 – 60 dB SPL have non-zero slopes (α = 0.05), with maximum amplitudes of 10 - 21 % greater than the 50 min time point. However, in contrast to the Wave I and Wave III data (Figure 3A – D), slopes of the regression lines in Figure 4A – D are negative, which indicates that Wave V amplitudes are supernormal at early anesthesia time points and decrease as the mice approach consciousness. In addition, the magnitudes of these changes are independent of stimulus intensity. These data suggest that 2,2,2-tribromoethanol-chloral hydrate does not depress Wave V amplitudes but rather enhances them, which differs from other common anesthetic combinations used in the hearing field such as ketamine / xylazine. However, we cannot rule out the possibility of stochastic anesthesia effects, similar to the Wave III amplitudes, because of the large variability in the amplitudes between mice.
Wave V latencies for 80 – 50 dB SPL are shown in Figure 4E – H. The regression lines for the 80 – 60 dB SPL latencies have zero slope (α = 0.05) while the latencies at 50 dB SPL are 3 % greater at 10 min than at 50 min. These data demonstrate that there is little effect of 2,2,2-tribromoethanol-chloral hydrate on Wave V latencies even though the drug combination generally increases the amplitudes of these waves in our study cohort.
3.3 Rapid recovery of mice from 2,2,2-tribromoethanol-chloral hydrate anesthesia and normal weight maintenance
In addition to determining the effect of 2,2,2-tribromoethanol-chloral hydrate anesthesia on ABRs, we examined post-anesthesia recovery times and the safety of the anesthesia in terms of mouse weight over the subsequent two days. Consciousness was judged to coincide with several coincident behavioral characteristics: the reappearance of tail and ear pinch reflexes, an increase in respiratory rate and attempts to ambulate. Normal activity coincided with the reacquisition of persistent exploring, foraging, eating and drinking behaviors.
Figure 5A shows average times taken for six mice to regain consciousness and resume normal activity in the cage following 2,2,2-tribromoethanol or 2,2,2-tribromoethanol-chloral hydrate anesthesia. Although the time to consciousness doubles from 30 min for 2,2,2-tribromoethanol to 60 min for the combination anesthetic, there is a modest 20 % increase in the time to regain normal activity for the combination cocktail. Thus, the addition of low dose choral hydrate extends anesthesia but does not markedly increase recovery time from consciousness to normal activity.
A useful indication of the short and medium term effects of anesthesia on mouse health is obtained by monitoring changes in weight during the post anesthesia period. Figure 5B shows the weights of six animals anesthetized with 2,2,2-tribromoethanol-chloral hydrate normalized to the weight of the mice just prior to injection (Day 0). An average weight gain of 5 % was observed for most mice after two days, and none of them lost more than 1.2 % of their pre-anesthesia body weight in the post-anesthesia period. Accordingly, we conclude that the acute after effects of the 2,2,2-tribromoethanol-chloral hydrate combination is not detrimental to the normal behavior of the mice.
3.4 Mild peritoneal vasodilation following 2,2,2-tribromoethanol-chloral hydrate anesthesia
Finally, we examined the comparative medium term effects of two doses of anesthetic, one day apart, on peritoneal cavity appearance in mice injected with PBS, 2,2,2-tribromoethanol, or 2,2,2-tribromoethanol-chloral hydrate. Figure 6 shows the peritoneal cavities of representative mice before (Figure 6A, C, and E) and following (Figure 6B, D, and F) detailed examination of the abdominal organs. Both observers were in agreement that the superficial appearance of the abdominal organs from the 2,2,2-tribromoethanol and 2,2,2-tribromoethanol-chloral hydrate cohorts are indistinguishable from the controls at three days post-injection and gut content and color indicates that all three cohorts were actively feeding. Further, ascites is absent in all three cohorts, which suggests there is little or no inflammation, and the organs have normal size, shape and color.
Figure 6. Mild acute vasodilation in 2,2,2-tribromoethanol-chloral hydrate injected abdomens.
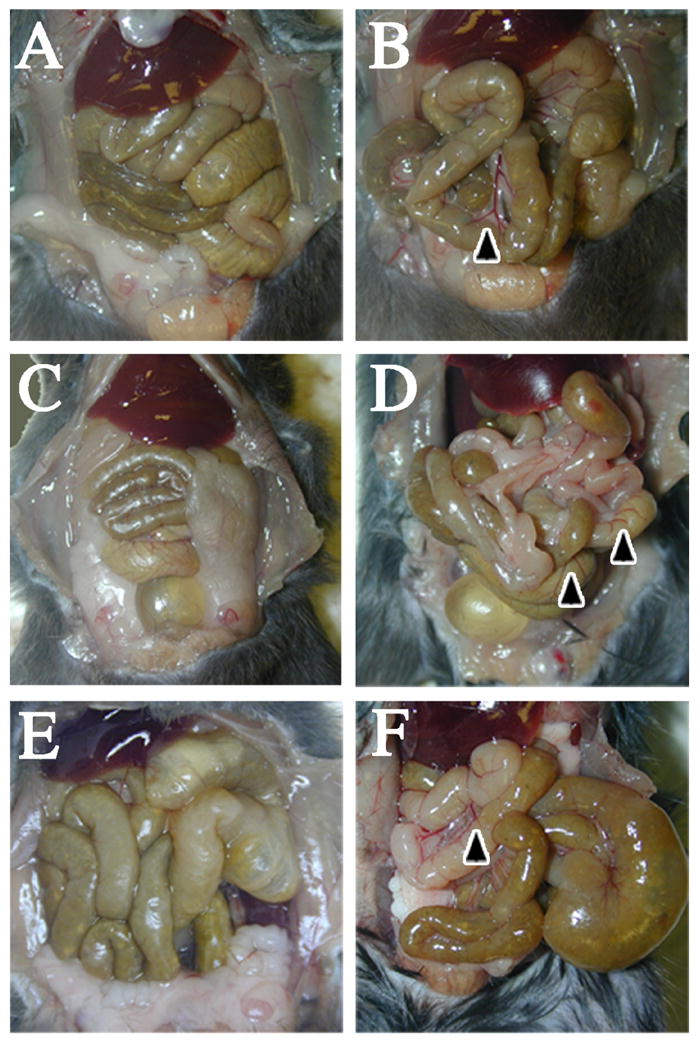
Saline injected (A and B), 2,2,2-tribromoethanol injected (C and D) and 2,2,2-tribromoethanol-chloral hydrate injected (E and F) abdominal cavities post sacrifice indicate normal coloration, morphology and shape of abdominal structures. Control (B), 2,2,2-tribromoethanol injected (E), and 2,2,2-tribromoethanol-chloral hydrate injected (F) intestines upon further examination highlight differences in vasodilation along intestines and septum. Black arrowheads indicate increased vasodilation in the peritoneal cavity.
The observers identified several areas of apparent vasodilation in the intestinal vasculature for both 2,2,2-tribromoethanol and 2,2,2-tribromoethanol-chloral hydrate cohorts compared to the controls, but the anesthesia cohorts were indistinguishable from each other. Accordingly, we observe persistent damage to the peritoneal cavity of mice following a single dose of 2,2,2-tribromoethanol or the 2,2,2-tribromoethanol-chloral hydrate cocktail, although the pathology is mild and non-inflammatory. This vasodilation likely stems from mild irritation caused by 2,2,2-tribromoethanol and/or 2-methylbutan-2-ol because of the similarity of the changes in both anesthetized cohorts.
4. DISCUSSION
We have used 2,2,2-tribromoethanol anesthesia to examine the psychoacoustics of mice in multiple studies (Gow, et al., 2004; Gow, et al., 1999; Southwood, et al., 2004) and find that this drug is fast-acting, safe and yields consistent results. Nevertheless, a single dose provides only 30 – 40 min of anesthesia, which limits the scope of experiments that can be performed. Our interest in characterizing binaural hearing in mice prompted a search for anesthetics that increase anesthesia time to one hour. Rather than a major change to different drugs, which would yield results that may be difficult to compare with our previous studies, we opted to test a novel cocktail using 2,2,2-tribromoethanol as a base anesthetic overlaid with low dose chloral hydrate to extend effective anesthesia time.
Our overall goal in the current study has been to determine if the combined use of 2,2,2-tribromoethanol and chloral hydrate in mice increases the duration of effective anesthesia while minimally changing the fundamental characteristics of the centrally derived ABR waveforms. 2,2,2-tribromoethanol at 375 mg/kg is the routine dose that we use for psychoacoustic studies (Gow, et al., 2004). We have observed previously that increasing this dose significantly, for example to 500 mg/kg as used in another study (Zheng, et al., 1999), increases anesthesia time but at the cost of significant reductions in the ABR amplitudes.
In contrast to combination anesthesia, we find that repeated i.p. injections of 375 mg/kg within the same testing session are impractical for several reasons. First, the difficulty in accounting for residual drug from the initial injection may increase the variability of anesthesia as well as the risk of overdosing. Second, repeated dosing may displace the electrodes and/or sound tubes, which could alter the ABR wave amplitudes. Finally, we do not observe adverse effects from single 2,2,2-tribronoethanol doses given two days apart for up to one week (over a wide age range of the mice from 4 weeks to 18 months); multiple doses per session would increase the risk of abdominal pathology and discomfort for the mice.
Herein, we demonstrate that 375 mg/kg 2,2,2-tribromoethanol followed after five min by 200 mg/kg chloral hydrate is safe for mice, roughly doubles the anesthesia time to around 60 min, and has non-systematic effects on the ABR amplitudes. A more reliable measure of these waves is to examine latencies, as shown in Figure 4A – D, the regression lines for the averaged latencies have slightly negative or zero slope. Because of the tight relationship between ABR wave amplitudes and latencies, it seems reasonable to conclude that the variable amplitudes we observe stem from inter-subject effects rather than systematic suppression of the ABRs by the anesthetic combination.
Accordingly, 2,2,2-tribromoethanol-chloral hydrate anesthesia is superior to other commonly used anesthetics in psychoacoustic studies. Amplitudes and latencies of ABRs measured from awake mice are similar to the values we observed under 2,2,2-tribromoethanol anesthesia alone (van Looij, et al., 2004). Other anesthetics, such as isoflurane and ketamine / xylazine, have been shown to suppress ABR amplitudes by 20 % and increase wave latencies by 1 msec in rodents when compared to awake recordings (McGee, et al., 1983; Santarelli, et al., 2003; Stronks, et al., 2010; van Looij, et al., 2004). Using the combination 2,2,2-tribromoethanol-chloral hydrate anesthesia, we observe negligible increases in wave latencies and non-systematic changes in amplitude, which is a preferable and more consistent method for collecting and analyzing psychoacoustics.
We find that the timing for the administration of 2,2,2-tribromoethanol and chloral hydrate to mice is important. Initial experiments involved injecting these anesthetics in quick succession, first 2,2,2-tribromoethanol then chloral hydrate. However, this protocol leads to acute gasping and body twitching in some mice and occasionally a failure to induce effective anesthesia. However, administration of 2,2,2-tribromoethanol to rapidly induce unconsciousness at a level where reflexes are absent, followed by chloral hydrate, yields no adverse effects. Typically, we use a time delay between 2,2,2-tribromoethanol and chloral hydrate injections of approximately 5 min.
The most common side effects from i.p. injected anesthetics include transient weight loss and peritoneal irritation or inflammation (Gaertner, et al., 2008). In Figure 5B, we demonstrate using ANOVA that there are no statistically significant changes in weight for 2,2,2-tribromoethanol-chloral hydrate injected mice over the three days following anesthesia (P = 0.272). Figure 6 shows that the peritoneal cavities of these mice sacrificed three days post injection with 2,2,2-tribromoethanol-chloral hydrate (Figure 6E and F), 2,2,2-tribromoethanol alone (Figure 6C and D) and even saline injected controls (Figure 6A and B) exhibit mild signs of vasodilation around the intestines and normal abdominal organ color and morphology. The similar extent of vasodilation between the 2,2,2-tribromoethanol and 2,2,2-tribromoethanol-chloral hydrate cohorts suggests that chloral hydrate contributes minimally to peritoneal irritation. Finally, there is no evidence of ascites in the peritoneal cavity of the anesthetized mice, which indicates that inflammatory responses are minimal.
For decades, many studies in rodents have employed 2,2,2-tribromoethanol anesthesia because of the ease of preparation and use (Gaertner, et al., 2008; Papaioannou & Fox, 1993; Weiss & Zimmermann, 1999): 2,2,2-tribromoethanol is not a controlled substance, is easily prepared, and is a safe and rapid-onset anesthetic that can be used over a wide dosage range. Anesthesia with this drug causes loss of righting reflexes, absence of responses to tail and ear pinching, muscle relaxation and decreased skeletal respiratory activity within 1 – 2 min (Gaertner, et al., 2008; Norris & Turner, 1983; Papaioannou & Fox, 1993). However, incorrect preparation or storage of 2,2,2-tribromoethanol stocks increases the risk of mortality (Buetow, et al., 1999; Gaertner, et al., 2008; Weiss & Zimmermann, 1999). The decomposition products, hydrobromic acid and dibromoacetaldehyde, decrease the pH of the solution below 5 and irritate the peritoneal cavity (Buetow, et al., 1999; Nicol, et al., 1965; Norris & Turner, 1983; Papaioannou & Fox, 1993). To minimize complications, 2,2,2-tribromoethanol is dissolved in 2-methylbutan-2-ol and stored at 4°C and away from light for no longer than two weeks (Weiss & Zimmermann, 1999).
Chloral hydrate has been used as a reliable sedative for more than a century (Gaertner, et al., 2008; Hetzler & Dyer, 1984). It is often considered to be a suboptimal anesthetic for rodents because it is a poor analgesic and, indeed, most contemporary surgical procedures involve anesthetics with strong analgesic properties (Flecknell, 1996). Typical doses of chloral hydrate for rodents range from 300 – 400 mg/kg, which produces effective anesthesia for 1 – 2 hours. A major advantage of chloral hydrate is the relatively shallow level of anesthesia conferred, as well as the relatively prolonged effective anesthesia time achieved (Field, et al., 1993; Sisson & Siegel, 1989). At doses around 300 mg/kg, chloral hydrate has been shown to preserve the EEG waveforms in rats (Sisson & Siegel, 1989) which is an important consideration for psychoacoustic studies.
5.1 Conclusions
Herein, we demonstrate that 375 mg/kg 2,2,2-tribromoethanol followed after 5 min by 200 mg/kg chloral hydrate roughly doubles anesthesia time in mice to around 60 min. Psychoacoustics of early latency peripheral auditory components exhibit normal latencies and attenuation of wave amplitudes by only a few percent at high stimulus intensities. The latencies of centrally-derived components are unchanged, and we observe variability in the amplitudes although group averages are normal. Because of the interdependence of wave latency and amplitude, it is reasonable to conclude that the amplitude variability stems from inter-subject differences and is not a systematic effect of the anesthetic combination.
Table 1.
F and p values for one-way ANOVAs comparing Wave I latencies between the 2,2,2-tribromoethanol and 2,2,2-tribromoethanol-chloral hydrate cohorts (Figure 2). No statistically significant differences are observed between corresponding intensities.
| Intensity | F(11,48) | P |
|---|---|---|
| 80 dB | 1.524 | >0.05 |
| 70 dB | 1.56 | >0.05 |
| 60 dB | 1.923 | >0.05 |
| 50 dB | 2.431 | >0.05 |
| 40 dB | 1.742 | >0.05 |
| 30 dB | 2.468 | >0.05 |
The highlights of this manuscript are.
Combination avertin-chloral hydrate increases anesthesia in mice to 1 hour
Avertin-chloral hydrate anesthesia slightly suppresses ABR Wave I, II and V amplitudes
Avertin-chloral hydrate has minimal effects on ABR Wave I, III and V latencies
Avertin-chloral hydrate causes mild intestinal vasodilation
Avertin-chloral hydrate has low impact on mouse health in the post-anesthetic period
Acknowledgments
The authors thank Drs Lisa Brossia and Elizabeth Dawe, Department of Laboratory Animal Research, Wayne State University, for helpful discussions in the design of our testing protocols.
Supported by a Concept Award by the Department of Defense (W81XWH-11-1-0267), the National Institutes of Health, National Institute of Neurological Disorders and Stroke (NS067157), and the Wayne State University School of Medicine Graduate Research program.
Abbreviations
- ABR
auditory brainstem response
- ANOVA
analysis of variance
- CH
chloral hydrate
- dB SPL
decibels sound pressure level
- EEG
electroencephalogram
- i.p
intraperitoneal
- kHz
kilohertz
- PBS
phosphate buffered saline
- SD
standard deviation
- SOC
superior olivary complex
- TBE
2,2,2-tribromoethanol
Footnotes
Publisher's Disclaimer: This is a PDF file of an unedited manuscript that has been accepted for publication. As a service to our customers we are providing this early version of the manuscript. The manuscript will undergo copyediting, typesetting, and review of the resulting proof before it is published in its final citable form. Please note that during the production process errors may be discovered which could affect the content, and all legal disclaimers that apply to the journal pertain.
References
- Anesthesia and Analgesia in Laboratory Animals. Second. San Diego, CA: Academic Press; 2008. [Google Scholar]
- Buetow BS, Chen LI, Maggio-Price L, Swisshelm K. Peritonitis in Nude Mice in a Xenograft Study. Contemp Top Lab Anim Sci. 1999;38(6):47–49. [PubMed] [Google Scholar]
- Field KJ, White WJ, Lang CM. Anaesthetic effects of chloral hydrate, pentobarbitone and urethane in adult male rats. Lab Anim. 1993;27(3):258–269. doi: 10.1258/002367793780745471. [DOI] [PubMed] [Google Scholar]
- Flecknell P. Laboratory Animal anaesthesia. Academic Press; 1996. [Google Scholar]
- Forrest D, Erway LC, Ng L, Altschuler R, Curran T. Thyroid hormone receptor beta is essential for development of auditory function. Nat Genet. 1996;13(3):354–357. doi: 10.1038/ng0796-354. [DOI] [PubMed] [Google Scholar]
- Gaertner D, Hallman T, Hankenson F, Batchelder M. Anesthesia and Analgesia in Laboratory Animals. 2. Burlington: Academic Press; 2008. [Google Scholar]
- Gow A, Davies C, Southwood CM, Frolenkov G, Chrustowski M, Ng L, et al. Deafness in Claudin 11-null mice reveals the critical contribution of basal cell tight junctions to stria vascularis function. J Neurosci. 2004;24(32):7051–7062. doi: 10.1523/JNEUROSCI.1640-04.2004. [DOI] [PMC free article] [PubMed] [Google Scholar]
- Gow A, Southwood CM, Li JS, Pariali M, Riordan GP, Brodie SE, et al. CNS myelin and sertoli cell tight junction strands are absent in Osp/claudin-11 null mice. Cell. 1999;99(6):649–659. doi: 10.1016/s0092-8674(00)81553-6. [DOI] [PubMed] [Google Scholar]
- Hetzler BE, Dyer RS. Contribution of hypothermia to effects of chloral hydrate on flash evoked potentials of hooded rats. Pharmacol Biochem Behav. 1984;21(4):599–607. doi: 10.1016/s0091-3057(84)80045-3. [DOI] [PubMed] [Google Scholar]
- McGee TJ, Ozdamar O, Kraus N. Auditory middle latency responses in the guinea pig. Am J Otolaryngol. 1983;4(2):116–122. doi: 10.1016/s0196-0709(83)80013-1. [DOI] [PubMed] [Google Scholar]
- Nicol T, Vernon-Roberts B, Quantock DC. Protective effect of oestrogens against the toxic decomposition products of tribromoethanol. Nature. 1965;208(5015):1098–1099. doi: 10.1038/2081098a0. [DOI] [PubMed] [Google Scholar]
- Norris ML, Turner WD. An evaluation of tribromoethanol (TBE) as an anaesthetic agent in the Mongolian gerbil (Meriones unguiculatus) Lab Anim. 1983;17(4):324–329. doi: 10.1258/002367783781062370. [DOI] [PubMed] [Google Scholar]
- Papaioannou VE, Fox JG. Efficacy of tribromoethanol anesthesia in mice. Lab Anim Sci. 1993;43(2):189–192. [PubMed] [Google Scholar]
- Santarelli R, Arslan E, Carraro L, Conti G, Capello M, Plourde G. Effects of isoflurane on the auditory brainstem responses and middle latency responses of rats. Acta Otolaryngol. 2003;123(2):176–181. doi: 10.1080/0036554021000028108. [DOI] [PubMed] [Google Scholar]
- Sisson DF, Siegel J. Chloral hydrate anesthesia: EEG power spectrum analysis and effects on VEPs in the rat. Neurotoxicol Teratol. 1989;11(1):51–56. doi: 10.1016/0892-0362(89)90085-8. [DOI] [PubMed] [Google Scholar]
- Southwood C, He C, Garbern J, Kamholz J, Arroyo E, Gow A. CNS myelin paranodes require Nkx6-2 homeoprotein transcriptional activity for normal structure. J Neurosci. 2004;24(50):11215–11225. doi: 10.1523/JNEUROSCI.3479-04.2004. [DOI] [PMC free article] [PubMed] [Google Scholar]
- Stronks HC, Aarts MC, Klis SF. Effects of isoflurane on auditory evoked potentials in the cochlea and brainstem of guinea pigs. Hear Res. 2010;260(1-2):20–29. doi: 10.1016/j.heares.2009.10.015. [DOI] [PubMed] [Google Scholar]
- van Looij MA, Liem SS, van der Burg H, van der Wees J, De Zeeuw CI, van Zanten BG. Impact of conventional anesthesia on auditory brainstem responses in mice. Hear Res. 2004;193(1-2):75–82. doi: 10.1016/j.heares.2004.02.009. [DOI] [PubMed] [Google Scholar]
- Weiss J, Zimmermann F. Tribromoethanol (Avertin) as an anaesthetic in mice. Lab Anim. 1999;33(2):192–193. doi: 10.1258/002367799780578417. [DOI] [PubMed] [Google Scholar]
- Zheng QY, Johnson KR, Erway LC. Assessment of hearing in 80 inbred strains of mice by ABR threshold analyses. Hear Res. 1999;130(1-2):94–107. doi: 10.1016/s0378-5955(99)00003-9. [DOI] [PMC free article] [PubMed] [Google Scholar]