Abstract
To identify the orthotropic biomechanical behavior of arteries, researchers typically perform stretch-pressure-inflation tests on tube-form arteries or planar biaxial testing of splayed sections. We examined variations in finite element simulations (FESs) driven from planar or tubular testing of the same coronary arteries to determine what differences exist when picking one testing technique versus another. Arteries were tested in tube-form first, then tested in planar-form, and fit to a Fung-type strain energy density function. Afterwards, arteries were modeled via finite element analysis looking at stress and displacement behavior in different scenarios (e.g., tube FESs with tube- or planar-driven constitutive models). When performing FESs of tube inflation from a planar-driven constitutive model, pressure-diameter results had an error of 12.3% compared to pressure-inflation data. Circumferential stresses were different between tube- and planar-driven pressure-inflation models by 50.4% with the planar-driven model having higher stresses. This reduced to 3.9% when rolling the sample to a tube first with planar-driven properties, then inflating with tubular-driven properties. Microstructure showed primarily axial orientation in the tubular and opening-angle configurations. There was a shift towards the circumferential direction upon flattening of 8.0 . There was also noticeable collagen uncrimping in the flattened tissue.
Keywords: pressure, inflation, microstructure, collagen, elastin, finite, element, analysis, modeling, tensile, anisotropic
Introduction
The biomechanical characterization of tissue specimens offers insight into the progression of disease, design parameters for implants, and variations between scientific comparison groups 2,28,29,40,41,45. For blood vessels, in particular, this data can be useful in preventing compliance mismatching in implant design and comparing human disease properties to those of murine models 11,31,44.
To evaluate the biomechanical properties of blood vessels, biaxial testing is frequently used since biological samples often exhibit anisotropy 12,33,36,40,48. Testing can occur in different arterial configurations such as in tubular- or planar-form 25,41,45. In testing planar arterial samples, annuluses are splayed into planar sections then flattened and pulled at different tension ratios while recording force and strain 23,42. An alternative to splaying a vessel open is to keep the artery in its native tube form. Testing is then done using different combinations of axial stretches and pressures while recording axial force, axial strain, and current diameter 15,24.
Researchers typically need to decide which tissue configuration to utilize based on the available equipment, the feasibility of physically testing the sample (e.g., vessel size), and how the resulting data will be used. For instance, mouse arteries are often tested via pressure-diameter testing because the act of flattening the vessel after splaying it open can produce undesired stresses in the sample. In addition, this particular tissue type can present challenges in the mounting of a planar sample due to their delicacy and size. This necessitates testing in tube-form 4. On the other hand, testing large arteries from large mammals in tube-form can present problems if, for instance, high-resolution imaging for large fields of view is required or prestress values are needed. If the end goal is constitutive modeling and simulation in tube-form, then tube testing may be ideal depending on individual interest. However, modeling using this approach could be negating potentially important values of hoop prestress.
With porcine coronary arteries, the samples can be tested with relative ease in either plane- or tube-form regarding the preparation of the vessels 18,23. Also, porcine coronary arteries provide a good analogue for human coronary arteries, with various applicable biomedical procedures and diseases 1,20,22,38. The ability to model the behavior of not just the native artery, but also how the artery might perform under different scenarios, such as stenting, can provide a clearer picture of vessel behavior in cardiac interventions. The purpose of this manuscript is to compare different biaxial biomechanical characterization techniques (planar versus tubular) tested on the same porcine coronary arteries. We also examine how the collagen and elastin architecture of the arteries change in response to different geometrical configurations (e.g., tubular, splayed, splayed and flattened).
Materials and Methods
Tissue Acquisition
All tissue testing was done according to the approved protocols with the University of Arizona Institutional Animal Care and Use Committee. Five porcine hearts were acquired from the University of Arizona Meat Sciences Laboratory within 30 minutes of slaughter from barrow pigs weighing roughly 313 46 lbs each. Hearts were measured across their major axes: apex to coronary ostia (ACO), transverse at the auricles (TAA), and sagittal at the ostial level (SOL) 8,37. Hearts with dimensions outside of the mean (ACO=111, TAA=82, SOL=69 mm) by more than 10% were not used. The hearts were transported on ice, and the proximal third of the left anterior descending coronary (LADC) artery was excised within the next hour. Prior to removal, the outside of the artery was marked along its length with a cyanoacrylate/ceramic powder. Suture was placed along the surface of the artery and cut at the marker points to measure the in situ length. After removing the artery from the myocardium, another piece of suture was placed along the excised artery between the same set of markers and cut between suture points. Extraneous fat, myocardium, and most of the adventitia was removed at this point. The markers came off during the removal of extraneous tissue because the markers resided on the top of the fat and adventitia surrounding the vessel. The end of the vessel was monitored to ensure that it did not slide in the fat during the course of removal from the myocardium as this would affect the prestrain marker measurements. The ratio of the original to final length of the suture lines was used to determine the axial prestretch (Z-in situ).
Tubular Biaxial Testing
Samples were tested in tubular form as previously done in our laboratory 24 Briefly, the ends of the samples were glued to plastic cannulas with cyanoacrylate, and marked with cyanoacrylate/ceramic powder to provide datums for axial stretch measurements 24 After mounting the sample, the testing bath was warmed to 37.0±0.7°C and preconditioned to ten pressure (120mmHg) and axial stretch (z=1.4) cycles simultaneously. The sample was stretched and held at three different axial stretches based on the axial prestretch measurements (λZ=1.00, 1.14, or 1.34; 1.34 is the average from all samples, see Results) and pressurized from 0–120±0.1 mmHg cyclically at each stretch state. Subsequently, pressures were held at 0, 70, and 120 mmHg while the vessel was stretched axially to λZ-in situ cyclically at each pressure. Pressure was applied at approximately 0.5mmHg/sec and axial strain was applied at approximately 0.001/sec. Diameter, pressure, axial stretch, and axial force were acquired during the total test cycle, and 2nd Piola Kirchoff stress and Green’s strain calculated at the circumferential mid-wall point using the thin-walled assumption as previously shown 12,17,21,49.
Planar Biaxial Testing
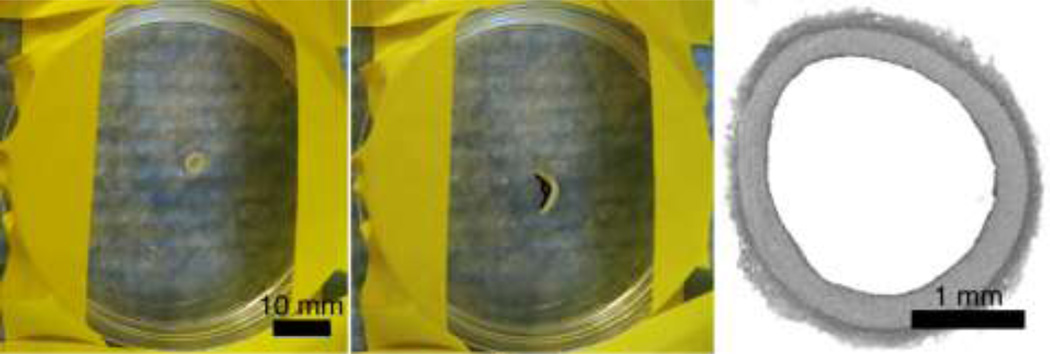
After tubular testing, the sample was cut away from the tube-testing fixture and splayed open. The opening angle was recorded for each sample by placing the segment in Ca2+-free phosphate buffered saline (pH 7.4) at 37°C until the segment would not open further (Fig. 1). This took, on average, approximately one hour. Subsequently, the sample was sutured and attached to the planar biaxial testing pieces. Before testing, four markers were placed in an approximate square on the surface of the vessel and directed towards the vision system to acquire strain 23. Testing was done with the same biaxial testing device as was used as for tubular testing, however, after making a previously demonstrated modular change 23. After mounting the sample, it was pulled to tension as determined from the Law of Laplace (Equation 1),
| Eqn 1 |
where T is the circumferential wall tension, P is the intraluminal pressure (systolic pressure=120mmHg in our case), and ri is the internal radius of the cylinder. The sample was preconditioned in each direction to a peak tension of 120mmHg in Eqn 1 ten times and preloaded to 0.098 N (∼8% of the mean maximum tension between the two directions) to relieve any slack on the tension lines in the device. The slack in the lines is due to the biaxial device having to account for different sample sizes. The slack is removed so the load cells are measuring force in the sample as opposed to the weights of the tension lines. Load controlled tests were performed at peak tension ratios of 1:1, 0.75:1, 0.5:1, 1:0.5, and 1:0.75 at loading rates of approximately 0.01 N/second. An additional loading curve in the circumferential direction was performed with the sample held at the in situ axial stretch. Green’s strain and 2nd Piola Kirchhoff stress were recorded as previously shown 13,21,23.
Figure 1.
Representative opening angle demonstration of a proximal porcine coronary artery. Left: vessel before splaying. Middle: vessel section after splaying with representative angle measurement markers. Right: Histology image to get vessel dimensions (hematoxylin and eosin stain).
Biaxial Data Post-processing
Data for each testing protocol (tubular or planar) was consolidated and fit to a Fung-type strain energy density equation (Equation 2) using SigmaStat 3.5 as follows 12:
| Eqn 2 |
where c>, A1, A2, and A3 are material constants. The values of the constants and the standard deviations for these were reported from the statistical software results. Average circumferential maximum tangential moduli (MTM) were compared between the tube- and planar-tested samples. The MTM for the tubular samples were determined as the maximum tangential modulus in the hoop direction of the artery kept at Z-in situ, similar to what was done by Di Martino, et al. 10. For the planar samples, the MTM was calculated as the circumferential tangential modulus while the samples are held at in situ axial prestrain. To compare the circumferential stiffness values to the in-myocardium state, the left anterior descending arteries of three of the hearts were cannulated at the left coronary ostium and inflated while monitoring the pressure and diameter via b-mode ultrasound. The ultrasound was done at 6.25MHz with a Zonare L10-5 probe with an effective bandwidth of 5–10 MHz. Data was processed with three data point median filtering, and two data point mean smoothing filtering in the lateral (b-mode) direction. Since the vessel in this configuration is already in its in situ state, the MTM could be calculated for the circumferential direction.
Finite Element Modeling
Six models were created in Abaqus 6.9–1 with input from the two different constitutive relationships (Table 1). Table 1 denotes geometries, constitutive models, and loading procedures, and defines the model acronyms used throughout this manuscript. For example, the first letter in the acronym defines the geometry, the second letter defines the constitutive model, and the third letter defines the loading procedure. Forward slashes denote combined constitutive models or loading procedures. The C-T-S/P and C-P-S/P models were chosen as biomechanical researchers frequently perform pressure-inflation simulations using these two particular constitutive models. The S-P-R/S/P model was chosen as its splayed form is circumferentially stress-free and closely related, geometrically, to a planar sample. The modification to change constitutive models to the tubular derived relationship midway through the analysis (after the roll step) in this model was chosen to better simulate its response in tube form. The S-P-F/B and P-P-B models were chosen to determine the degree to which flattening a sample can introduce unwanted stresses through the thickness. Diameters and thicknesses for the models in their unpressurized and free length states were based on the histology sections (paraformaldehyde, 10–70%/5% ethanol/acetic acid in 10% steps to minimize tissue shrinkage3, paraffin, H&E stain) (Fig. 1), and the axial length was measured from the sample in the testing fixtures with calipers.
Table 1.
Finite element model parameters (abbreviations in parentheses)
| Initial Geometry |
Constitutive Model | Model Acronym |
|---|---|---|
| Cylindrical | Constants from tubular testing |
Cylindrical-tube-stretch/pressurize (C-T-S/P) |
| Constants from planar testing |
Cylindrical-planar-stretch/pressurize (C-P-S/P) | |
| Splayed Open | Constants from planar testing |
Splayed-planar-roll/stretch/pressurize (S-P-R/S/P) |
| Splayed Open | Constants from planar testing for roll step, constants from tubular testing for stretch/pressurize |
Splayed-planar/tube-roll(with planar model)/stretch and pressurize(with tubular model) (S-P/T-R/S/P) |
| Splayed Open | Constants from planar testing |
Splayed-planar-flatten-biaxial tension (S-P-F/B) |
| Planar (flat) | Constants from planar testing |
Planar-planar-biaxial tension (P-P-B) |
Finite element models were created with all elements in cylindrical coordinates to allow for proper application of the applied boundary conditions and material models. One end of the vessel was fixed in Z and theta to allow for deformation in the radial direction. The other end was fixed in theta, and an axial stretch of λz=1.34, and luminal pressures of 120 mmHg, applied. To roll the model to a tube, each node along the axial length at the cut surfaces was manually moved with displacement boundary conditions to close the splayed geometry to a tube. Material models were applied by changing constants in the individual input files. To perform a switch of the material constants in the S-P/T-R/S/P model, the splayed geometry was rolled with the planar constitutive model and the geometry from the end of this analysis (a tube) was imported as an orphan mesh to a new analysis with the tube constitutive model. In this analysis, stresses and strains at each element from the rolling operation were imported as an initial condition for the stretching and pressurization cycle.
Each geometry was modeled with C3D8RH elements, contained 157080 nodes, and had four elements through the thickness of the vessel wall. All analyses were done utilizing six cores (3.2 GHz each) and 10 GB RAM (machine from SWS Electronics, Tucson, AZ). Stresses through the wall and the pressure-diameter behavior was exported and compared between models.
To determine the stresses that occur due to flattening a sample in the opening-angle configuration, the models in the bottom two rows in Table 1 were compared. All biomechanical endpoints (e.g., stresses) were evaluated at element integration points.
Microstructural Analysis
To determine whether differences in the microstructural organization of coronary vessels exist in different initial states, proximal LADC tissue segments were imaged via multiphoton microscopy as previously described 23. Briefly, tissue was imaged with a custom upright multiphoton microscope (LaVision BioTec, Germany) at 20X, with λex=780 nm. Second harmonic generated light from collagen was collected through a bandpass filter (377/50 Semrock) and autofluorescent emission (primarily elastin) was collected through another bandpass filter (460/80 Semrock).
First, arteries were imaged in tube-form. The same segment was splayed open, placed into a fixture that matched the splayed radius of the sample, and imaged in the stress-free opening-angle configuration. Finally, the segment was taken out of the fixture, flattened, and imaged in the flattened state. To ensure the same region was imaged each time, the outer edges of the samples were located in the microscope and the microscope stage moved to ensure the center of the samples were being imaged. This was done for three samples, with ten slices through the thickness for each image stack. Images were analyzed using a previously demonstrated fiber orientation algorithm to look at collagen and elastin orientation 23,24. The fiber orientation analyses were binned into histograms to examine any changes that exist in fiber orientation between these tissue states. The mode of the histogram was used as the quantitative metric of preferred fiber orientation. Each slice through the thickness was analyzed for fiber orientation to determine how fiber orientation changes through the thickness of the vessel. The cumulative fiber distribution was also compared.
Results
Constitutive Modeling
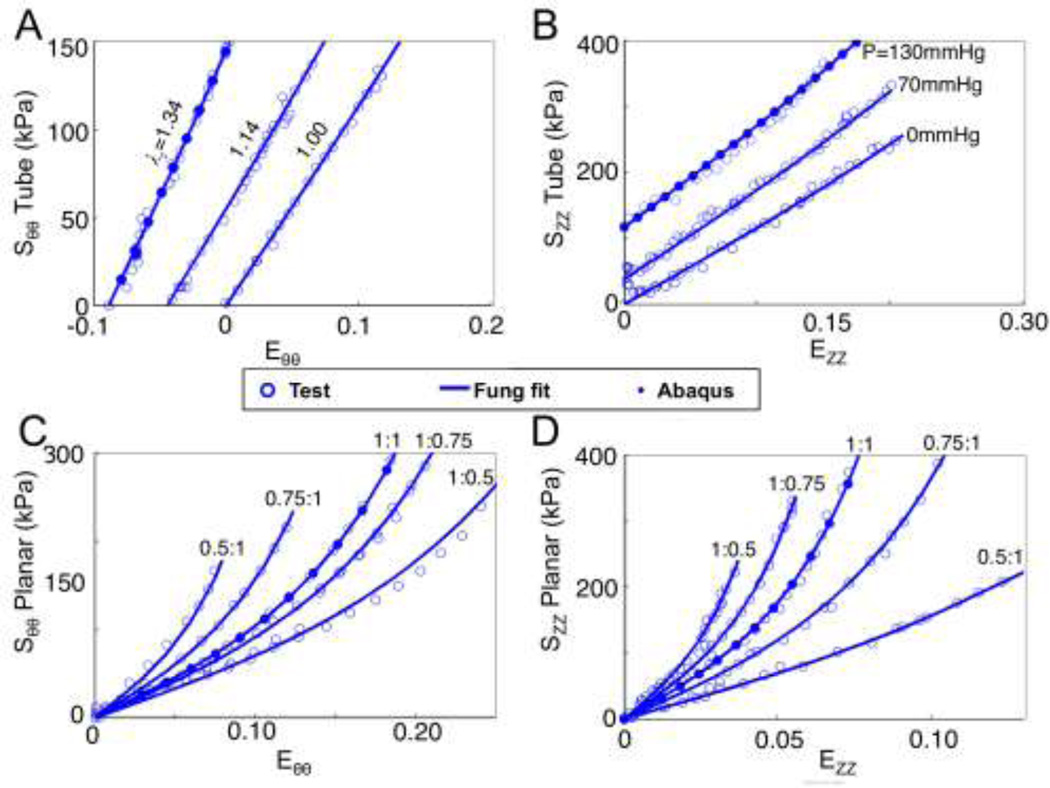
Axial prestretch measurements for the proximal third of the left anterior descending coronary arteries was λz-in situ=1.34±0.06. The average opening angle for the tested arteries was θopening=132.76±28.11°. Vessels were measured as 3.41±0.27mm in diameter and 0.22±0.07mm in thickness. Table 2 shows the Fung constants for the respective tests. Stress versus strain data was cumulatively fit, resulting in an R2 of 0.86 for the tube-testing data and 0.93 for the planar-testing data. Figure 2 shows a representative dataset with the Fung fit. The ABAQUS results in Figure 2A–B are for a C-T-S/P model for the axial stretch phase (Szz) and the pressurization phase (S) taken at the circumferential mid-wall points. The ABAQUS results in Figure 2C–D are for a planar equibiaxial strain (Ezz=E =0.1) simulation.
Table 2.
Fung constants for the different testing protocols (SD)
| C (kPa) | A1 | A2 | A3 | |
|---|---|---|---|---|
| Tubular | 431.1±17.6 | 0.8±0.4 | 1.5±0.5 | 0.6±0.1 |
| Planar | 85.0±9.9 | 7.7±0.6 | 15.7±1.8 | 5.0±0.4 |
Figure 2.
Representative biaxial tensile data from the tubular (A and B) and planar (C and D) tests. The lines represent the Fung-type strain energy density fits (Eqn 2). The results from the finite element simulations from the tube stretch and inflation is shown with solid dots in panels A and B, while the results from the equibiaxial planar finite element simulation is shown with solid dots in panels C and D.
Stiffness Comparison
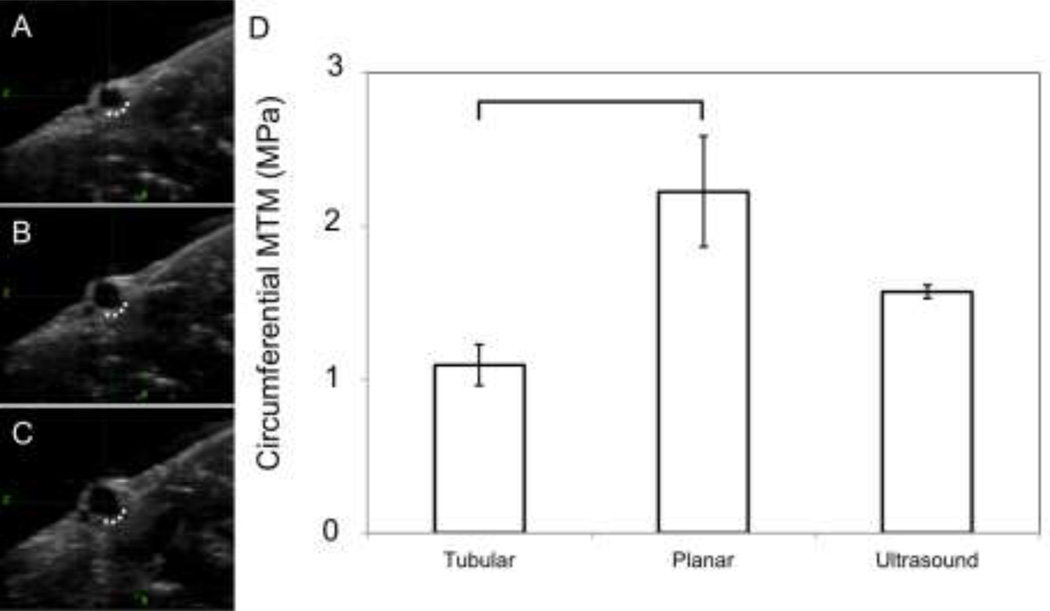
Figure 3A–C shows a representative ultrasound image dataset. A noticeable difference in the inflation as seen in ultrasound (vessel still in the heart) versus the ex situ inflation was that the vessel inflated primarily outward from the myocardium, as if it were fixed along the dotted line in Fig. 3A–C and inflated outward from the line. Figure 3D shows the maximum tangential moduli for the three different test scenarios (one-way ANOVA, p<0.05). For pair-wise comparisons the one-way ANOVA was done with a Bonferroni adjustment. The bar signifies the pair-wise significance of p<0.05.
Figure 3.
Representative ultrasound of an inflation sequence. (A) vessel cross section at no pressure, (B) 70 mmHg (9332.5 Pa), (C) 120 mmHg (15998.7 Pa). The dotted line indicates the area that appeared to be fixed, with the wall inflating outward from this line. (D) MTM in the circumferential direction at axial in situ stretch for the different test protocols.
Finite Element Modeling
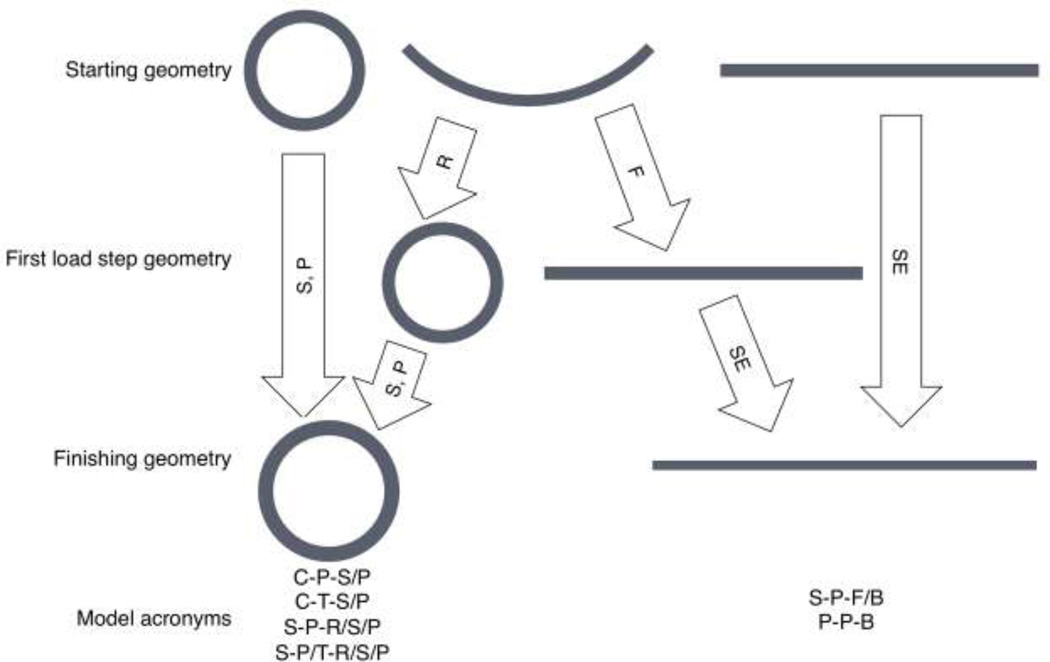
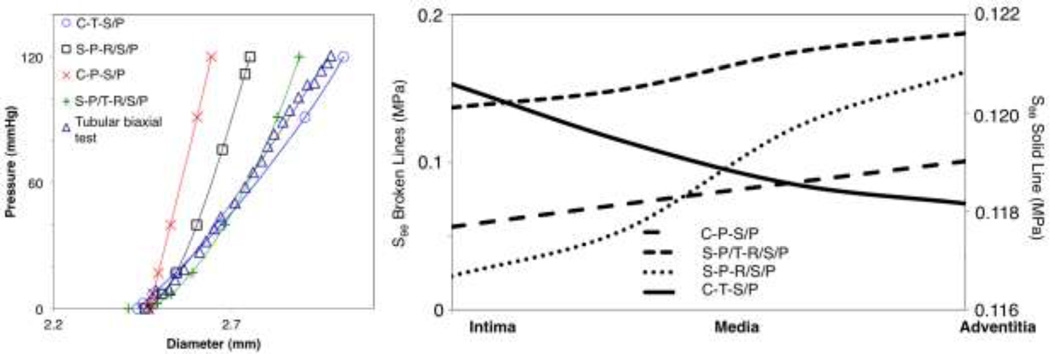
Figure 4 shows the finite element shapes and the analysis procedures. The C-T-S/P and C-P-S/P models showed completely different stress and dilation behavior, as expected given the differences in stiffness and constitutive constants. The final diameter after pressure-inflation with the C-T-S/P model was 3.01 mm, a difference of 0.9% compared to the experimental data from the pressure-inflation tubular biaxial test. The final diameters of the C-P-S/P and S-P-S/P models were 2.64 mm and 2.75 mm, representing a percent error of 12.3% and 8.6% with respect to the experimental data, respectively. When implementing a combination of the two constitutive models (the S-P/T-R/S/P model), the final diameter was 2.89 mm, a difference of 3.9% when compared to the experimental data. Figure 5 (left) shows all of the pressure-diameter information including a representative pressure-inflation testing dataset. Figure 5 (right) shows the stresses through the thicknesses at the final step of the pressure-inflation simulations. The only simulation that resulted in maximum hoop stress occurring at the intima was the C-T-S/P model. All other models had a stress gradient with the adventitia containing the maximum hoop stress. The C-T-S/P model also exhibited the smallest circumferential stress gradient: 3.1 kPa, compared to the next lowest: 44.4 kPa for the C-P-S/P model, and 50.4 kPa for the S-P/T-R/S/P.
Figure 4.
Computational modeling procedure flow diagram with before and after shapes from the analyses along with indicating the analysis procedure. S=Stretch, P=Pressurize, R=Roll into tube, F=Flatten into sheet, SE=Stretch equibiaxially.
Figure 5.
Left: Pressure inflation behavior for the different finite element model simulations with a representative dataset from tubular biaxial testing, which falls closest to the average in regard to geometry. Right: Circumferential stress through the vessel wall at the end of each computational loading sequence for the different models.
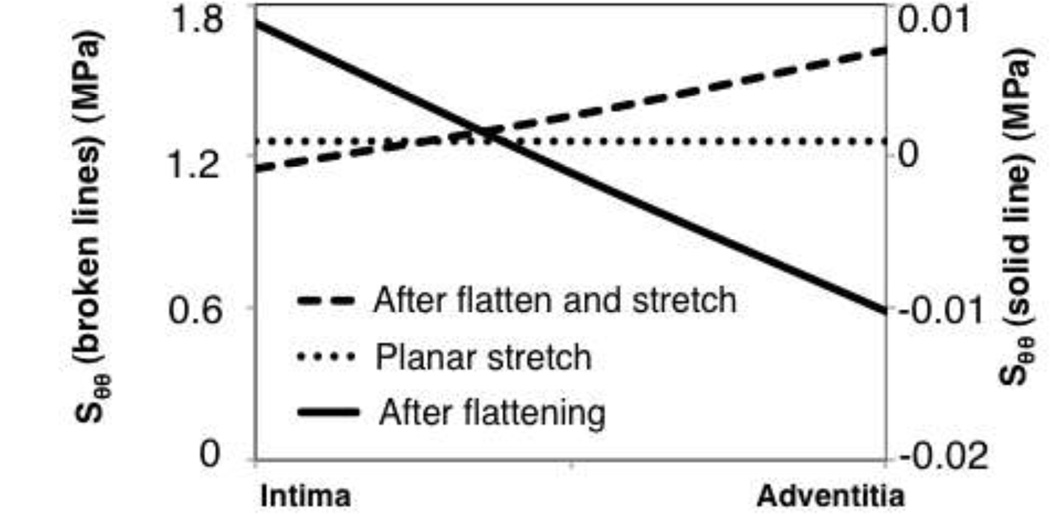
For the planar testing comparisons, the S-P-F/B model showed circumferential stresses from the flattening process on the order of −10.2 to 8.8 kPa (Fig. 6). The circumferential stress in the geometric center through the thickness of sample after flattening was −0.075 kPa. The stretch at equibiaxial tension differed by 1.9% in the longitudinal direction, and 5.5% in the circumferential direction. Even though a gradient in stress was observed after flattening, the percent difference in adventitial to intimal circumferential stress, with respect to the maximum circumferential stress in the wall, was reduced from 185.8% to 40.9% after peak tension was reached in the model.
Figure 6.
Circumferential stresses through the wall for the planar testing (flattening) simulations.
Microstructural Analysis
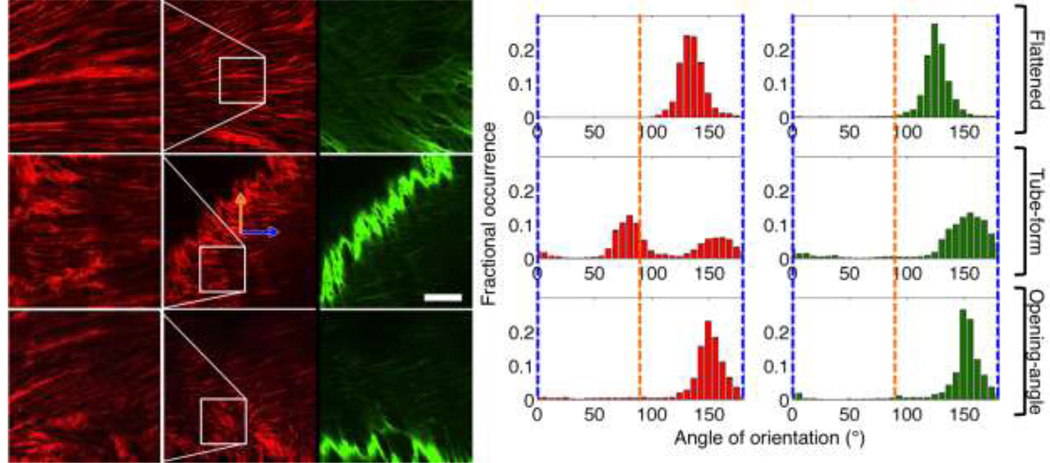
Figure 7 shows a representative set of images at the different vessel-states. Collagen fibers showed a high degree of crimping in the native tube state, with some uncrimping in the opening-angle configuration. Qualitatively, collagen crimping was observed as a sinusoidal pattern along the length of a fiber bundle. When uncrimping was noticed, the amplitude of the sinusoidal pattern was reduced making the fibers look more straight. The flattened samples showed a high degree of collagen uncrimping, especially at the intima. Figure 7 also shows the cumulative fiber histograms (90° is the axial direction). The fiber histograms are plots showing the fractional occurrence of fiber direction. Therefore, higher peaks in a histogram indicate preferred fiber orientation in that direction, whereas a larger spread in the histogram peaks indicate a spread of fiber orientation.
Figure 7.
Left: Multiphoton representative images in different artery configurations. The right column shows elastin, the middle and left columns show collagen (both at 10% into the vessel from the lumen). Elastin images have a bright band that is representative of the more densely packed elastin in the intima. This is due to some sample tilt or curvature therefore exposing sections of the brighter intimal elastin. Optical termination edges of the intimal elastin were not used in the orientation analysis. The top row shows the vessel in the flattened form, the middle row shows the vessel in the tube-form, and the bottom row shows the same vessel in the splayed, opening angle, configuration. The left-most column shows a zoomed field-of-view of the outlined areas in the middle column. The orange arrow refers to the longitudinal direction, whereas the blue arrow refers to the circumferential direction of the vessel. Scale bar is 100 microns. Right Panel: representative cumulative fiber histograms for the collagen and elastin fibers. The blue lines represent the circumferential direction, the orange lines the axial direction. The left column is the collagen histograms and the right column is the elastin histograms.
In Fig. 7, the existence of two peaks in the cumulative fiber histogram in the tube configuration suggests that the collagen is in a crimped configuration. This is because, in the fiber orientation program, a given fiber bundle can have several vectors placed along its length and across its thickness 23,26. This is implemented in the program to allow for the measurement of both small and large fiber bundles. However, this means that should a single fiber change direction (in the case of crimped fibers-multiple times) the fibers will be represented as oriented primarily in two directions for the fibers we observed. This will change based on the frequency and amplitude of the crimps. This only occurred with the tube-form specimens, and each image was individually inspected to ensure the multiple peaks occurred due to crimping and not due to the samples having two preferred orientations. This means the generalized direction of the fibers (minus crimping) is the average between the two peaks in the tube-form vessel configuration (118.5±6.4° in the tube configuration). The other cases had cumulative modes of 124.1±8.9° for the flattened artery and 132.1±15.6° for the opening-angle configuration. This data suggests that the three configurations show slightly different ECM configurations, with the tube-form having the highest amount of preferred axial alignment, and the flattened and opening-angle configurations being more circumferentially aligned in the passive state. In addition, the tube-form had a higher amount of fiber spread compared to the relatively higher preferred alignment of the flattened and opening-angle configurations. The elastin showed a similar behavior, however, without the split peaks in the tube configuration.
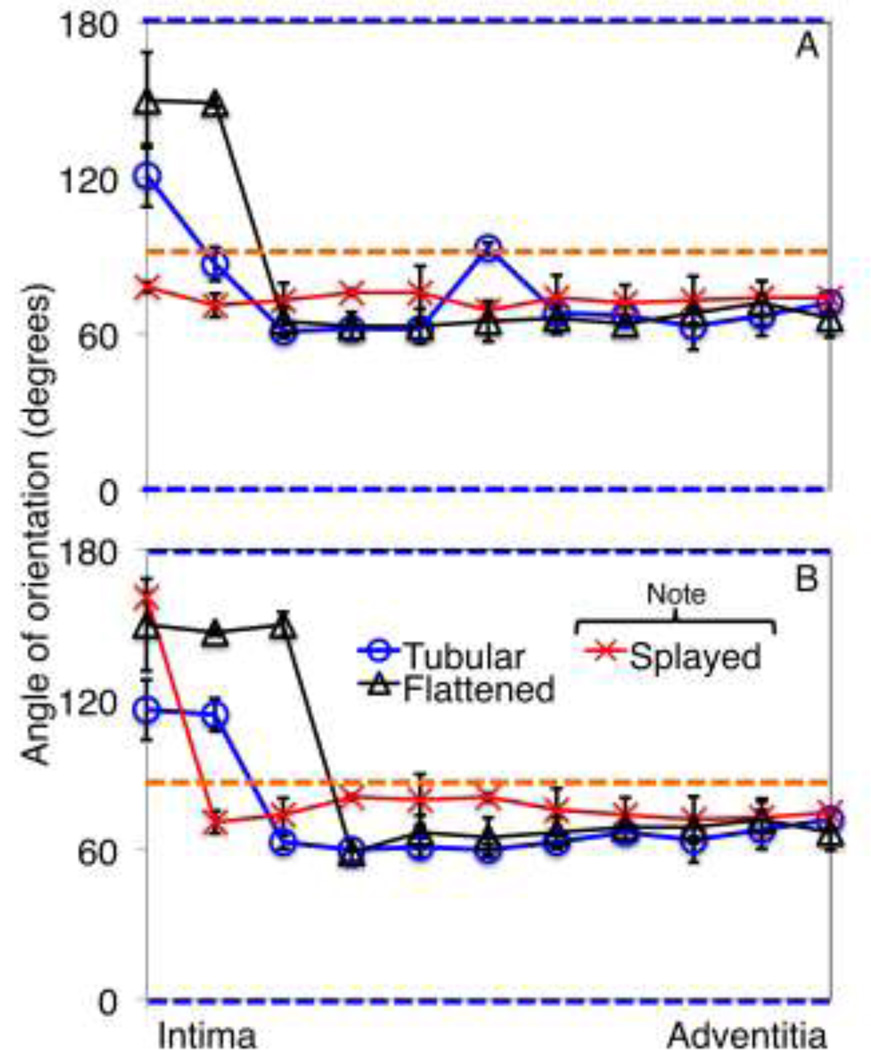
Upon looking at how fiber orientation changes through the thickness, the collagen and elastin fibers in the flattened sample closer to the intima (30% through the thickness from the intima) displayed some uncrimping with medial and adventitial collagen and elastin fibers not showing much change between the opening angle and flattened configurations. Figure 8 shows how the mean modes of the fiber histograms change over the thickness for all imaged samples. The flattened sample showed the highest degree of intimal circumferential alignment. Also note that the orientation of collagen in the tube-form sample in Figure 8 through the depth shows the mean mode of the single left peak since it is the histogram mode.
Figure 8.
Mean mode (preferential orientation) of collagen (A) and elastin (B) through the depth of each vessel configuration. The blue and orange lines show the circumferential direction, and longitudinal directions, respectively.
Discussion
In this study, we showed how testing protocols done on the same arterial sample could influence the finite element analyses driven from these properties. Coronary arteries were used as they demonstrate an artery that can be tested relatively easily in the tubular and planar configurations; in addition, it is an artery that has shown disease-related ramifications as it relates to biomechanical properties 47. There were observed differences in the measured values of stiffness between the vessels in the tubular, planar, and ultrasound testing, with the planar tested sample having the highest MTM. The ultrasound-measured stiffness had the most similarity to the tube-tested stiffness, as expected due to the sample being in a similar form. The directions of inflation (outward from the myocardium) may account for the differences between these two datasets. This result should be carefully compared though because the vessels are in significantly different tissue states. Although we argue that considering the stiffnesses were rather similar, the extraneous tissue does not contribute as much to the observed maximum tangential modulus. Also, finite element simulations based on different constitutive models resulted in a difference in the stresses and strains seen in the arterial walls. This study can help guide others as we have shown that only the planar- driven models maintained circumferential stress gradients with peak stress at the adventitia, and the tubular-driven models all most closely matched pressure-inflation data. Preload in the planar sample, stresses from flattening the sample, in addition to a lack of residual stress in the samples, may account for the differences between the planar and tubular tests 18,23,25,32–35.
The pressure-diameter data showed behavior that was expected: the C-T-S/P model showed the closest similarity to the pressure-inflation tests, with C-P-S/P showing the highest dissimilarity. However, rolling the sample first caused the pressure-diameter data to display a closer similarity to the tested data even though planar properties were used (the C-P-R/S/P model). Closer similarity to the pressure-inflation data was observed when including prestress (rolling) and changing constitutive models midway through the analysis (the S-P/T-R/S/P model).
Pertinent results from the microstructural analysis showed that fiber architecture was different based on vessel configuration. Researchers performing tests are often aware of the differences in architecture that can exist when splaying a vessel open (in this case, the slight uncrimping of fibers). However, the act of flattening a sample can introduce bending stresses. This was indicated in the fact that fibers not only uncrimped, but also moved towards a more circumferential alignment. The fact that some of the collagen fibers were uncrimped from flattening the sample at the start of a planar biaxial test is likely responsible for the higher values of stiffness observed in the planar-tested samples.
Other groups have performed simulations where stress and strain distributions through the arterial wall including residual stresses were calculated 33,34. This was done through analytical methods (i.e., bending laws of mechanics), or rolling the arterial sample in finite element models. Analyses done in these other studies were done with one set of material constants reported from previous literature (tubular or planar testing) 14,33,34,50, whereas, our study utilized different mechanical tests in similar finite element scenarios.
Other studies have shown that vessels dilate to a higher degree when residual strains are incorporated 7,33. Our finite element studies show this, as well, indicating the importance of including residual strains, especially when pressure-diameter behavior is important to the researcher. One finite element result that was peculiar was the observed circumferential stress distribution in the C-P-S/P model. Given that circumferential residual stresses were not incorporated into this model, it was expected that the trend of the stress distribution for this model would be the same as the C-T-S/P model (higher in the intima). This difference can be attributed to the stresses seen in the circumferential direction during the applied axial stretch. After applying the axial stretch, the circumferential direction began to experience an observed negative stress gradient that was larger in the C-P-S/P analysis compared to the C-T-S/P analysis, with the adventitia experiencing the peak stress. As the samples are pressurized, the intima increases in circumferential stress at a faster rate than the adventitia, therefore approaching or surpassing the value of stress at the adventitia. In the C-T-S/P sample the circumferential stress in the intima overtook that of the adventitia, however, in the C-P-S/P sample the circumferential stress in the intima only approached the adventitial stress, and did not surpass it. Upon examining the model further, if the C-T-S/P model was not axially stretched as much prior to application of the pressure load (reducing the observed circumferential gradient in axial stress), the peak circumferential stress occurred at the intima. Correspondingly, if the C-P-S/P model was stretched in the axial direction beyond the measured axial prestrain and then pressurized, the peak stress occurred in the adventitia. This behavior is relevant in vessels with varying amounts of axial prestrain.
In this study the sole use of orthotropic homogenous models driven from tensile testing does have limitations. Other groups have performed analyses looking at the non-homogenous stress distributions through the wall as it relates to circumferential residual stresses 32. Since the geometry is not perfectly tubular, performing all analyses in this paper with the exact geometries could allow researchers to also identify exactly how the differences in testing protocols could lead to differences in the stress fields of finite element simulations. In addition, the use of thin-walled incompressibility assumptions in our data analysis could present errors, especially when predicting radial stresses and strains through the wall. Because of the dimensions of our tested arteries (thickness to diameter ratio of 0.06) and observed near-incompressibility, we deemed this as a valid assumption 19. Addition of radial residual stresses and fitting parameters could also provide for a more accurate analysis given the ability to acquire compressive data in the radial direction, as was done by Chuong, et al 6.
Testing sequentially (tubular- then planar-form) could introduce errors because of undesired changes to the sample when performing pressure-inflation testing. Ideally, the sample in a tubular test is not taken beyond physiological limits in pressure or stress, thus limiting this effect. To ensure a lack of damage as a result of tubular biaxial testing, we fit data from planar biaxial samples that had not previously been tested in tubular form. The r2 between this data and those reported in this paper was greater than 0.9 for all samples.
In addition, we only performed tensile testing, however bending (in the rolling or flattening procedures) is a compressive and tensile problem. We could improve on our study by performing bending tests and implementing the resulting constitutive properties into our analysis. The pooling and simultaneous fitting of multiple sample data produced differences in the coefficients of determination values for each of the different mechanical test. To determine how this can affect the end-result of the finite element simulations we modified the material constants by their confidence bounds and examined the dilation and stress behavior with the same finite element models. The tubular-driven tube had a 3.2% (10 micron) deviation to the pressure-inflation behavior, and a 16.2% error in the stress profile. The planar-driven tube had a 1.5% (4 micron) deviation to the pressure-inflation behavior, and a 9.7% error in the stress profile compared to our reported results. While these errors do exist, the overall conclusions are not altered as it relates to observed trends in stress and dilation behavior. For example, the C-T-S/P model still most closely reproduced the pressure-inflation data, and the S-P-R/S/P model still had the largest circumferential stress gradient. Data could have been taken from bred-for-science animals in order to further reduce inter-animal variability and improve the R2 of the cumulative data fits.
A potential critical parameter of importance are the torsional residual strains reported by Wang, et al 46. While we incorporated circumferential residual strain and axial pre-strain in the simulation of arteries in the current study, the inclusion and comparison of other residual strains seen in coronary arteries, such as saddling (longitudinal residual strain) and torsion, could provide an even clearer picture of what is occurring during the biomechanical characterization of arteries in either the tubular or planar state 39,43.
In addition to the inclusion of more advanced behavior in the models to obtain a more accurate result, errors in our study could also be attributed to other testing and in silico parameters. For instance, planar biaxial testing requires the sample to be preloaded to equalize the tension in the lines and prevent line-weight from putting force on the load cells. Since the tube-form test was strain-driven for the axial direction, axial preload was not necessary. The preloaded state in planar samples, while only at 0.098 N, can introduce some stress to the sample, although it was considered negligible in our study and others 5,16,27,30.
In the microstructural analysis, the fiber orientation program chosen for use in this study is a well-documented program to examine fiber orientation 16,17,23,24,26, however, the use of a quiver grid has drawbacks compared to other methods. For instance, the small quiver grid will result in a single thick fiber having multiple counts through the thickness and along the length in a fiber orientation frequency histogram. While this can be good be good because thicker fibers will contribute more to the preferred orientation, any change in orientation along the length of a fiber can skew results (as was seen with heavily crimped fibers in our tubular specimen). An alternative would be code similar to that implemented by D’Amore, et al 9. This would provide fiber count and orientation regardless of undulation, however, very thick fibers would be weighed equally to thinner fibers, whereas an argument could be made that thicker fibers could contribute to the mechanical response more so than a thinner fiber. Further implementations of multiple fiber processing techniques are currently being investigated in our laboratory.
A useful future direction for this study would be the inclusion of how vessels other than porcine coronary arteries behave in tubular versus planar testing scenarios. This was not included in the current study as the focus was an artery that is tested relatively easily in the two different configurations. Given the proper testing equipment, a useful future direction would be to measure the planar and tubular biaxial tensile properties and opening angles of several different arteries and perform a finite element study similar to that run here. This would allow researchers investigating arteries with different opening angles and axial tensile properties to better understand how their testing method can affect eventual finite element results.
While overall we have shown that the same sample tested through different scenarios can result in different computational results, it is ultimately up to individual researchers to choose the technique that provides the best result given their specific research goals. Combining a number of techniques seems to provide a middle ground between pressure-diameter and stress field optimization. For instance, should pressure-inflation and prestress behavior be equally important, the use of rolling the vessel to tube-form based on planar properties and then inflating and stretching using tubular properties (similar to the S-P/T-R/S/P model) serves as a good middle ground, with relatively small amounts of error in pressure-diameter reproduction and stress gradients with peak stress at the adventitia.
To our knowledge we are unaware of researchers that have performed biaxial characterization on the same samples but in two different, commonly accepted, configurations and protocols. While we expected qualitative differences in the finite element models’ behavior given the testing data, the quantitative values show just how significant the sample geometric changes prior to testing can be. For instance, researchers should be aware of the consequences of flattening a sample from its opening-angle configuration, such as an increased effect on the observed stiffness compared to tube-form testing. These observations were also shown in the microstructure, in particular, in relation to the flattened configuration where some collagen fibers were fully uncrimped prior to stretching the sample. This also has the implication when trying to compare material behaviors between groups of samples that were tested in different configurations, with planar tested samples having an inherent increase in stiffness. Therefore any conclusions made between data sets where the materials were tested via different methods are not comparable without additional computational or analytical work. Should comparisons need to be made between samples that were tested differently, the use of rolling the sample prior to performing any other computational operations can better approach stress profiles and pressure-diameter behavior predicted via analytical methods.
Conclusions
This paper provides researchers with further information on the comparison of biaxial testing techniques with quantitative evidence which could help scientists in determining which testing technique may serve their needs best. While it is ultimately up to the researcher to choose the proper technique, we have provided potential guidelines for how to obtain the proper dilation or stress gradient behavior. The microstructural organization also shows changes, in particular to collagen, by simply changing the testing configuration. When interpreting biaxial data, it is important to know the state of the samples prior to testing. This is because factors like preloading or collagen uncrimping can modify what is considered to be zero-stress states in the vessel.
Acknowledgements
The authors would like to thank the University of Arizona Meat Sciences Laboratory for help in sample acquisition. The Advanced Intravital Microscope was funded through a NIH/NCRR 1S10RR023737-01. This work is supported, in parts, by the National Institutes of Health Cardiovascular Biomedical Engineering Training Grant (T32 HL007955 to JTK), an American Heart Association (AHA) Predoctoral Fellowship (11PRE7730024 to JTK), Achievement Rewards for College Scientists (ARCS; Mary Ann White Memorial Scholarship to JTK), an AHA Beginning Grant-in-Aid (0860058Z to JPVG), and an AHA Grant-in-Aid (10GRNT4580045 to JPVG).
Footnotes
Conflicts of Interest
The authors have no conflicts of interest to declare.
Works cited
- 1.Association AH. Heart Disease and Stroke Statistics - 2010 Update. Dallas, TX: 2010. [Google Scholar]
- 2.Bund SJ. Spontaneously hypertensive rat resistance artery structure related to myogenic and mechanical properties. Clin Sci (Lond) 2001;101(4):385–393. [PubMed] [Google Scholar]
- 3.Carson FL. Histotechnology: A Self-Instructional Text. 2nd edition. ASCP Press; 2007. [Google Scholar]
- 4.Chesler NC, Thompson-Figueroa J, Millburne K. Measurements of mouse pulmonary artery biomechanics. J Biomech Eng. 2004;126(2):309–314. doi: 10.1115/1.1695578. [DOI] [PubMed] [Google Scholar]
- 5.Chow MJ, Zhang Y. Changes in the Mechanical and Biochemical Properties of Aortic Tissue due to Cold Storage. J Surg Res. doi: 10.1016/j.jss.2010.04.007. [DOI] [PubMed] [Google Scholar]
- 6.Chuong CJ, Fung YC. Compressibility and constitutive equation of arterial wall in radial compression experiments. J Biomech. 1984;17(1):35–40. doi: 10.1016/0021-9290(84)90077-0. [DOI] [PubMed] [Google Scholar]
- 7.Chuong CJ, Fung YC. On residual stresses in arteries. J Biomech Eng. 1986;108(2):189–192. doi: 10.1115/1.3138600. [DOI] [PubMed] [Google Scholar]
- 8.Crick SJ, Sheppard MN, Ho SY, Gebstein L, Anderson RH. Anatomy of the pig heart: comparisons with normal human cardiac structure. Journal of anatomy. 1998;193(Pt 1):105–119. doi: 10.1046/j.1469-7580.1998.19310105.x. [DOI] [PMC free article] [PubMed] [Google Scholar]
- 9.D'Amore A, Stella JA, Wagner WR, Sacks MS. Characterization of the complete fiber network topology of planar fibrous tissues and scaffolds. Biomaterials. 2010;31(20):5345–5354. doi: 10.1016/j.biomaterials.2010.03.052. [DOI] [PMC free article] [PubMed] [Google Scholar]
- 10.Di Martino ES, Bohra A, Vande Geest JP, Gupta N, Makaroun MS, Vorp DA. Biomechanical properties of ruptured versus electively repaired abdominal aortic aneurysm wall tissue. Journal of vascular surgery : official publication, the Society for Vascular Surgery [and] International Society for Cardiovascular Surgery, North American Chapter. 2006;43(3):570–576. doi: 10.1016/j.jvs.2005.10.072. discussion 576. [DOI] [PubMed] [Google Scholar]
- 11.Dye WW, Gleason RL, Wilson E, Humphrey JD. Altered biomechanical properties of carotid arteries in two mouse models of muscular dystrophy. J Appl Physiol. 2007;103(2):664–672. doi: 10.1152/japplphysiol.00118.2007. [DOI] [PubMed] [Google Scholar]
- 12.Fung Y. Biomechanics: Mechanical Properties of Living Tissues. 2nd ed. New York: Springer; 1993. [Google Scholar]
- 13.Fung YC, Liu SQ. Determination of the mechanical properties of the different layers of blood vessels in vivo. Proceedings of the National Academy of Sciences of the United States of America. 1995;92(6):2169–2173. doi: 10.1073/pnas.92.6.2169. [DOI] [PMC free article] [PubMed] [Google Scholar]
- 14.Fung YC, Liu SQ. Strain distribution in small blood vessels with zero-stress state taken into consideration. The American journal of physiology. 1992;262(2 Pt 2):H544–H552. doi: 10.1152/ajpheart.1992.262.2.H544. [DOI] [PubMed] [Google Scholar]
- 15.Hansen L, Wan W, Gleason RL. Microstructurally motivated constitutive modeling of mouse arteries cultured under altered axial stretch. J Biomech Eng. 2009;131(10):101015. doi: 10.1115/1.3207013. [DOI] [PMC free article] [PubMed] [Google Scholar]
- 16.Haskett D, Johnson G, Zhou A, Utzinger U, Vande Geest J. Microstructural and biomechanical alterations of the human aorta as a function of age and location. Biomech Model Mechanobiol. 9(6):725–736. doi: 10.1007/s10237-010-0209-7. [DOI] [PubMed] [Google Scholar]
- 17.Haskett D, Speicher E, Fouts M, Larson D, Azhar M, Utzinger U, Vande Geest J. The effects of angiotensin II on the coupled microstructural and biomechanical response of C57BL/6 mouse aorta. J Biomech. 2011 doi: 10.1016/j.jbiomech.2011.11.017. [DOI] [PubMed] [Google Scholar]
- 18.Holzapfel GA, Sommer G, Gasser CT, Regitnig P. Determination of layer-specific mechanical properties of human coronary arteries with nonatherosclerotic intimal thickening and related constitutive modeling. Am J Physiol Heart Circ Physiol. 2005;289(5):H2048–H2058. doi: 10.1152/ajpheart.00934.2004. [DOI] [PubMed] [Google Scholar]
- 19.Holzapfel GA, Weizsacker HW. Biomechanical behavior of the arterial wall and its numerical characterization. Computers in biology and medicine. 1998;28(4):377–392. doi: 10.1016/s0010-4825(98)00022-5. [DOI] [PubMed] [Google Scholar]
- 20.Hughes GC, Post MJ, Simons M, Annex BH. Translational physiology: porcine models of human coronary artery disease: implications for preclinical trials of therapeutic angiogenesis. J Appl Physiol. 2003;94(5):1689–1701. doi: 10.1152/japplphysiol.00465.2002. [DOI] [PubMed] [Google Scholar]
- 21.Humphrey JD, Vawter DL, Vito RP. Quantification of strains in biaxially tested soft tissues. J Biomech. 1987;20(1):59–65. doi: 10.1016/0021-9290(87)90267-3. [DOI] [PubMed] [Google Scholar]
- 22.John LC. Biomechanics of coronary artery and bypass graft disease: potential new approaches. Ann Thorac Surg. 2009;87(1):331–338. doi: 10.1016/j.athoracsur.2008.07.023. [DOI] [PubMed] [Google Scholar]
- 23.Keyes JT, Borowicz SM, Rader JH, Utzinger U, Azhar M, Vande Geest JP. Design and demonstration of a microbiaxial optomechanical device for multiscale characterization of soft biological tissues with two-photon microscopy. Microsc Microanal. 17(2):167–175. doi: 10.1017/S1431927610094341. [DOI] [PMC free article] [PubMed] [Google Scholar]
- 24.Keyes JT, Haskett DG, Utzinger U, Azhar M, Vande Geest JP. Adaptation of a planar microbiaxial optomechanical device for the tubular biaxial microstructural and macroscopic characterization of small vascular tissues. J Biomech Eng. 133(7):075001. doi: 10.1115/1.4004495. [DOI] [PMC free article] [PubMed] [Google Scholar]
- 25.Kim J, Baek S. Circumferential variations of mechanical behavior of the porcine thoracic aorta during the inflation test. J Biomech. 44(10):1941–1947. doi: 10.1016/j.jbiomech.2011.04.022. [DOI] [PubMed] [Google Scholar]
- 26.Kirkpatrick ND, Andreou S, Hoying JB, Utzinger U. Live imaging of collagen remodeling during angiogenesis. Am J Physiol Heart Circ Physiol. 2007;292(6):H3198–H3206. doi: 10.1152/ajpheart.01234.2006. [DOI] [PubMed] [Google Scholar]
- 27.Lally C, Reid AJ, Prendergast PJ. Elastic behavior of porcine coronary artery tissue under uniaxial and equibiaxial tension. Ann Biomed Eng. 2004;32(10):1355–1364. doi: 10.1114/b:abme.0000042224.23927.ce. [DOI] [PubMed] [Google Scholar]
- 28.Loree HM, Tobias BJ, Gibson LJ, Kamm RD, Small DM, Lee RT. Mechanical properties of model atherosclerotic lesion lipid pools. Arterioscler Thromb. 1994;14(2):230–234. doi: 10.1161/01.atv.14.2.230. [DOI] [PubMed] [Google Scholar]
- 29.McVeigh GE, Hamilton PK, Morgan DR. Evaluation of mechanical arterial properties: clinical, experimental and therapeutic aspects. Clin Sci (Lond) 2002;102(1):51–67. [PubMed] [Google Scholar]
- 30.Miroslave Zemanek JB, Michal Detak Biaxial Tension Tests with Soft Tissues of Arterial Wall. Engineering Mechanics. 2009;16(1):8. [Google Scholar]
- 31.Moore JE., Jr Biomechanical issues in endovascular device design. J Endovasc Ther. 2009;16(Suppl 1):I1–I11. doi: 10.1583/08-2605.1. [DOI] [PMC free article] [PubMed] [Google Scholar]
- 32.Peterson SJ, Okamoto RJ. Effect of residual stress and heterogeneity on circumferential stress in the arterial wall. J Biomech Eng. 2000;122(4):454–456. doi: 10.1115/1.1288210. [DOI] [PubMed] [Google Scholar]
- 33.Rachev A, Greenwald SE. Residual strains in conduit arteries. J Biomech. 2003;36(5):661–670. doi: 10.1016/s0021-9290(02)00444-x. [DOI] [PubMed] [Google Scholar]
- 34.Raghavan ML, Trivedi S, Nagaraj A, McPherson DD, Chandran KB. Three-dimensional finite element analysis of residual stress in arteries. Ann Biomed Eng. 2004;32(2):257–263. doi: 10.1023/b:abme.0000012745.05794.32. [DOI] [PubMed] [Google Scholar]
- 35.Sato M, Hayashi K, Niimi H, Handa H, Moritake K, Okumura A. [Mechanical behaviors of arterial walls in the axial direction (author's transl)] Iyodenshi To Seitai Kogaku. 1977;15(6):403–409. [PubMed] [Google Scholar]
- 36.Sato M, Hayashi K, Niimi H, Moritake K, Okumura A, Handa H. Axial mechanical properties of arterial walls and their anisotropy. Med Biol Eng Comput. 1979;17(2):170–176. doi: 10.1007/BF02440925. [DOI] [PubMed] [Google Scholar]
- 37.Skwarek M, Grzybiak M, Kosinski A, Hreczecha J. Basic axes of human heart in correlation with heart mass and right ventricular wall thickness. Folia morphologica. 2006;65(4):385–389. [PubMed] [Google Scholar]
- 38.Swindle MM, Horneffer PJ, Gardner TJ, Gott VL, Hall TS, Stuart RS, Baumgartner WA, Borkon AM, Galloway E, Reitz BA. Anatomic and anesthetic considerations in experimental cardiopulmonary surgery in swine. Lab Anim Sci. 1986;36(4):357–361. [PubMed] [Google Scholar]
- 39.Vaishnav RN, Vossoughi J. Residual stress and strain in aortic segments. J Biomech. 1987;20(3):235–239. doi: 10.1016/0021-9290(87)90290-9. [DOI] [PubMed] [Google Scholar]
- 40.Vande Geest JP, Sacks MS, Vorp DA. Age dependency of the biaxial biomechanical behavior of human abdominal aorta. J Biomech Eng. 2004;126(6):815–822. doi: 10.1115/1.1824121. [DOI] [PubMed] [Google Scholar]
- 41.Vande Geest JP, Sacks MS, Vorp DA. The effects of aneurysm on the biaxial mechanical behavior of human abdominal aorta. J Biomech. 2006;39(7):1324–1334. doi: 10.1016/j.jbiomech.2005.03.003. [DOI] [PubMed] [Google Scholar]
- 42.Vande Geest JP, Sacks MS, Vorp DA. A planar biaxial constitutive relation for the luminal layer of intra-luminal thrombus in abdominal aortic aneurysms. J Biomech. 2006;39(13):2347–2354. doi: 10.1016/j.jbiomech.2006.05.011. [DOI] [PubMed] [Google Scholar]
- 43.Vossoughi J. Southern Biomedical Engineering Conference. Tennessee: Memphis; 1992. Longitudinal residual strain in arteries; pp. 17–19. [Google Scholar]
- 44.Walden R, L'Italien GJ, Megerman J, Abbott WM. Matched elastic properties and successful arterial grafting. Arch Surg. 1980;115(10):1166–1169. doi: 10.1001/archsurg.1980.01380100018004. [DOI] [PubMed] [Google Scholar]
- 45.Wan W, Yanagisawa H, Gleason RL., Jr Biomechanical and microstructural properties of common carotid arteries from fibulin-5 null mice. Ann Biomed Eng. 38(12):3605–3617. doi: 10.1007/s10439-010-0114-3. [DOI] [PMC free article] [PubMed] [Google Scholar]
- 46.Wang R, Gleason RL., Jr A mechanical analysis of conduit arteries accounting for longitudinal residual strains. Ann Biomed Eng. 38(4):1377–1387. doi: 10.1007/s10439-010-9916-6. [DOI] [PMC free article] [PubMed] [Google Scholar]
- 47.Williams MJ, Stewart RA, Low CJ, Wilkins GT. Assessment of the mechanical properties of coronary arteries using intravascular ultrasound: an in vivo study. Int J Card Imaging. 1999;15(4):287–294. doi: 10.1023/a:1006279228534. [DOI] [PubMed] [Google Scholar]
- 48.Wuyts FL, Vanhuyse VJ, Langewouters GJ, Decraemer WF, Raman ER, Buyle S. Elastic properties of human aortas in relation to age and atherosclerosis: a structural model. Phys Med Biol. 1995;40(10):1577–1597. doi: 10.1088/0031-9155/40/10/002. [DOI] [PubMed] [Google Scholar]
- 49.Zhang W, Wang C, Kassab GS. The mathematical formulation of a generalized Hooke's law for blood vessels. Biomaterials. 2007;28(24):3569–3578. doi: 10.1016/j.biomaterials.2007.04.030. [DOI] [PubMed] [Google Scholar]
- 50.Zhao J, Day J, Yuan ZF, Gregersen H. Regional arterial stress-strain distributions referenced to the zero-stress state in the rat. Am J Physiol Heart Circ Physiol. 2002;282(2):H622–H629. doi: 10.1152/ajpheart.00620.2000. [DOI] [PubMed] [Google Scholar]


