Abstract
Ginsenosides are divided into two groups based on the types of the panaxadiol group (e.g., ginsenoside-Rb1 and -Rc) and the panaxatriol group (e.g., ginsenoside-Rg1 and -Re). Among them, ginsenoside-Re (G-Re) is one of the compounds with the highest content in Panax ginseng and is responsible for pharmacological effects. However, it is not yet well reported if G-Re increases the hemodynamics functions on ischemia (30 min)/reperfusion (120 min) (I/R) induction. Therefore, in the present study, we investigated whether treatment of G-Re facilitated the recovery of hemodynamic parameters (heart rate, perfusion pressure, aortic flow, coronary flow, and cardiac output) and left ventricular developed pressure (±dp/dtmax). This research is designed to study the effects of G-Re by studying electrocardiographic changes such as QRS interval, QT interval and R-R interval, and inflammatory marker such as tissue necrosis factor-α (TNF-α) in heart tissue in I/R-induced heart. From the results, I/R induction gave a significant increase in QRS interval, QT interval and R-R interval, but showed decrease in all hemodynamic parameters. I/R induction resulted in increased TNF-α level. Treatment of G-Re at 30 and 100 μM doses before I/R induction significantly prevented the decrease in hemodynamic parameters, ameliorated the electrocardiographic abnormality, and inhibited TNF-α level. In this study, G-Re at 100 μM dose exerted more beneficial effects on cardiac function and preservation of myocardium in I/R injury than 30 μM. Collectively, these results indicate that G-Re has distinct cardioprotectective effects in I/R induced rat heart.
Keywords: Panax ginseng, Ginsenoside-Re, Cardiac injury, Hemodynamics, Myocardial preservation
INTRODUCTION
Cardiovascular disease (CVD) is one of the most pressing dangers that accounts to over 50% of total mortality worldwide. According to World Health Organization, CVD particularly ischemic disease is the primary cause of morbidity and mortality, and will be the major cause of death by the year 2020 [1]. Ischemic disease caused by ischemia/reperfusion (I/R) injury results from a serious impairment of blood supply in the coronary artery. This leads to irreversible metabolic and myocardial changes with its final outcome associated with myocar-dial ischemia. And, arrhythmias and cardiac contractile dysfunction were induced by myocardial I/R [2-4]. Patients with CVD are susceptible to arrhythmias, cardiac infarction, and sudden death [5]. In addition, the harmful effects of I/R are caused by the reperfusion of coronary flow inducing intracellular calcium overload and oxidative stress which eventually leads to cell death [6]. For centuries, much progress has been made in the treatment of CDV. Related studies show that cardioprotective drugs can significantly inhibit cardiac injury [7-9]. With these medical advancements, reports show that mortality from CDV has declined during the last three decades [10-12]. Ginseng root, as an herbal medicine, has been widely used in the Orient for thousands of years [13,14]. Panax ginseng Meyer, a ginseng root belonging to the family Araliaceae, is an herbal medicine usually cultivated in Korea [15]. It is considered as a highly valued medicinal plant in East Asia and has gained popularity in North America for the past 20 years for its health containing compounds [16,17]. Among the complex compounds of ginseng, ginsenosides (also known as ginseng saponins) are the main components responsible for the pharmacological effects of ginseng [18,19]. With recent technological developments, more than 150 naturally occurring ginsenosides have been obtained from Panax species [20], of which 40 of these can been isolated from P. ginseng [21]. Ginsenoside-Re (G-Re) is a primary ginsenoside which belongs to 20(S)-protopanaxatriol group [22]. Researches show that G-Re exhibits many pharmacological activities via different mechanisms [23,24]. Among these is negative action of G-Re on the anti-arrhythmic and anti-ischemic effects in cardiovascular system [25]. In this present study, the protective effect of G-Re on the I/R-injury in an isolated rat heart was evaluated. The protective actions of G-Re through normalization of tissue necrosis factor-α (TNF-α) as well as hemodynamic parameters such as perfusion pressure, aortic flow, coronary flow, cardiac output, and left ventricular developed pressure (±dp/dtmax) were investigated.
MATERIALS AND METHODS
Ginsenoside-Re and other agents
G-Re was kindly obtained from Korea Ginseng Corporation (Daejeon, Korea). G-Re was dissolved in a modified Krebs-Henseleit (KH) buffer which consisted of 120.0 mM NaCl, 25 mM NaHCO3, 4.8 mM KCl, 1.2 mM KH2PO4, 1.25 mM CaCl2, 1.2 mM MgSO4, and 11.0 mM glucose. This perfusate suspension was centrifuged at 15,000 rpm for 10 min with the supernatant filtered through a 0.2 mm syringe filter and transferred to another tube. The reagents used in this study were of analytical grade and were purchased from Sigma (St. Louis, MO, USA).
Animals
The study was conducted using forty-five male Sprague-Dawley rats weighing 200±15 g. All the animals were obtained from Japan SLC (Shizuoka, Japan). The rats were housed in cages well maintained at an ambient temperature of 25±2℃ with alternating 12 h of light/dark cycle. The experimental rats were allowed to have free access to standard food and water ad libitum for 1 wk to adjust them to the environment. The Principles of Laboratory Animal Care were followed in accordance with the Guideline for Institutional Animal Care and Use Committees of Chonbuk National University (Jeonju, Korea).
Experimental protocols
The Sprague-Dawley rat hearts were perfused for a total of 170 min. This perfusal consisted of pre-ischemia period for 20 min, followed by global ischemia for 30 min, and repurfusion for 120 min at 37℃(Fig. 1).
Fig. 1. Experimental protocol. All experimental groups began with a 20 min perfusion period to allow for stabilization of the isolated hearts. Then, the hearts were divided into the normal control group (N/C), the ginsenoside-Re (G-Re) alone treated group (G-Re control), the ischemia for 30 min and reperfusion for 120 min group (ischemia/reperfusion [I/R] control), 30G-Re treated group, which received administration of 30 μM G-Re before ischemia induction (30G-Re+I/R), and 100G-Re treated group, which received administration of 100 μM G-Re before ischemia induction (100G-Re+I/R).
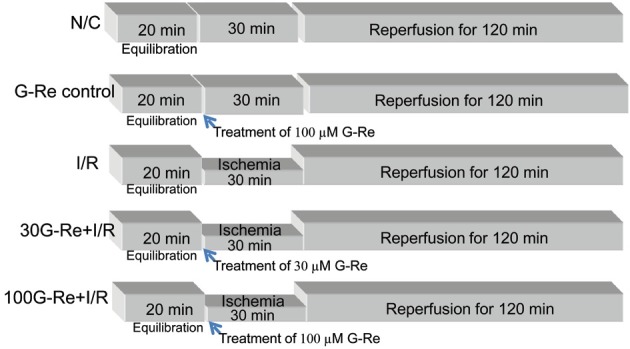
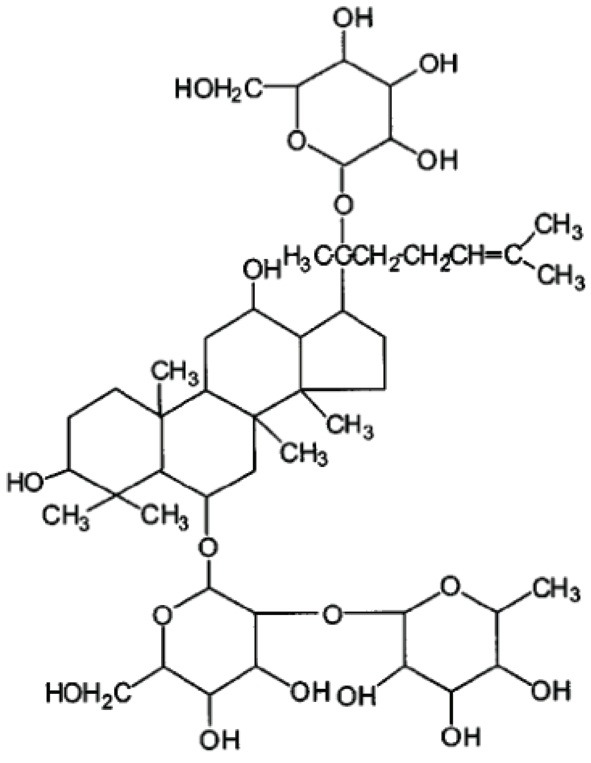
The hearts were divided into five experimental groups (n=9, each group): 1) normal control (N/C): hearts were continuously perfused with KH buffer without ischemia. 2) G-Re control: hearts were perfused with KH buffer for a 20 min pre-ischemia period, followed by treatment of 100 μM G-Re, and perfusion was followed for 30 min plus 120 min. No global ischemia was induced. 3) I/R: hearts were perfused with KH buffer for a 20 min pre-ischemia period, followed by 30 min of global ischemia, and reperfusion of 120 min. 4) 30 μM G-Re: hearts were perfused with KH buffer for a 20 min pre-ischemia period, followed by treatment of 30 μM G-Re for 3 min, and 30 min of global ischemia. After global ischemia, reperfusion was followed for 120 min. 5) 100 μM G-Re: hearts were perfused with KH buffer for a 20 min pre-ischemia period, followed by treatment of 100 μM G-Re for 3 min, and 30 min of global ischemia. After global ischemia, reperfusion was followed for 120 min. the chemical structure of G-Re was shown in Fig. 2.
Fig. 2. Chemical struture of ginsenoside-Re.
At the end of the experiments, heart tissues were quickly frozen by placing in liquid nitrogen for TNF-α.
Langendorff heart preparation
Rats were anesthetized with 25 to 30 mg of pentobarbital using intraperitoneal injection. After confirming the loss of light reflex and responsiveness, the experimental rats were heparinized by administering 250 IU of sodium heparin via intraperitoneal injection and were intubated with a 16G catheter via tracheostomy. Ventilation was maintained by using an animal respirator (model SN-480-7; Shinano, Nagano, Japan). After median sternotomy, the specimen hearts were rapidly excised en bloc and were immersed in ice-cold perfusion solution to prevent myocardial injury during the remaining procedure. All hearts were retrogradely perfused via the aorta on the Langendorff apparatus using modified KH solution containing 118 mM NaCl, 4.7 mM KCl, 1.2 mM MgSO4, 1.2 mM KH2PO4, 25 mM NaHCO3, 10 mM glucose, 1.9 mM CaCl2, and 0.5 mM Na-EDTA. The perfusate solution was maintained at 37±0.2℃ using a thermostatically controlled water circulating system (GP-200; NESLAB Instrument, Waltham, MA, USA) and was kept at pH 7.4±0.02 with 3 L/min mixed gas (95% oxygen and 5% carbon dioxide).
Hemodynamic measurement
After the hearts were stabilized 20 min pre-ischemic periods, ischemia was induced for 30 min accompanied by the administration of G-Re for 3 min (flow rate 10 mL/min). Global ischemia was achieved by clamping both the aortic and atrial lines for 30 min. In the N/C group, equal volumes of modified KH buffer were injected into the aortic line for 3 min (flow rate 10 mL/min). The hemodynamic data (perfusion pressure, aortic flow, coronary flow, and cardiac output) among all groups for reperfusion periods of 120 min were compared to observe the protective roles of G-Re. Perfusion pressure was recorded using a pressure transducer connected to aortic cannula. Aortic flow was measured by gauging the flow volume ejected from aorta to the cannula located 100 cm above the heart. The coronary flow was also measured by the collection of perfusate from the pulmonary trunk. Cardiac output was calculated by summing the aortic flows and coronary flows. The developed maximal rates of contraction (+dP/dtmax) and relaxation (−dP/dtmax) were recorded after 120 min of reperfusion. Both +dP/dtmax and −dP/dtmax were considered as indices of ventricular contractility.
Electrocardiographic recording preparation
As soon as the hearts were applied to the Langendorff perfusion system, electrocardiographic (ECG) patterns were recorded from the epicardial surface. All hearts were allowed to equilibrate for 20 min. Hearts with cardiac rhythm irregularities during the equilibration period were excluded. In brief, an ECG recording of the cardiac surface was performed after attaching the heart to the Langendorff system. Two silver wire electrodes were placed on the epicardial surface. Signals from both electrodes were amplified using an electric amplifier (AB-621G; Nihon-Kohden, Tokyo, Japan), recorded on a personal computer (PC-9801VX; NEC, Tokyo, Japan) via an A/D converter (Analog-Pro Jr.; Canopus Electric, Kobe, Japan), and analyzed using WAVE MASTER II and WM Read (Canopus Electric) as described previously [26,27]. In the present study, QRS interval, QT interval, and R-R interval were analyzed via ECG recording.
Determination of tissue necrosis factor-α in heart tissue
In the present study, TNF-α is measured using the basis of determining TNF-α related to tissue injury [28]. Samples taken from left ventricular tissues after reperfusion of 120 min were immediately stored at -70℃ at the end of experiment until assayed as previously described [29]. In brief, the tissue was homogenized in RIPA buffer (150 mM NaCl, 0.1% SDS, 0.5% sodium deoxycholate, 1% NP-40, 50 mM Tris, pH 7.4, 20 mM NaF, 2 mM EGTA, 0.5% levamisole, 1 mM NaVO4, 1 μg/mL leupeptin) containing 1 mM PMSF. The supernatant was obtained by centrifugation (18,000 ×g, 15 min, 4℃). TNF-α level in the supernatant was measured using an ELISA kit (R&D Systems, Minneapolis, MN, USA). Final results were expressed as pg/mg protein.
Statistical analysis
All statistics were calculated using SigmaPlot ver. 12.0 (Systat Software, Chicago, IL, USA). Data were subjected to one-way analysis of variance (ANOVA) and one-way repeated measures ANOVA. If statistical significance was established, values of the control group were compared to those of the other groups using Bonferroni t-test. For all studies, statistical significance was considered at p<0.05.
RESULTS
Hemodynamic data
The effect of G-Re for hemodynamic parameters was assessed by measuring the extent of perfusion pressure, aortic flow, coronary flow, and cardiac output with time-dependent manner, all of which are basic assessments of cardiac function.
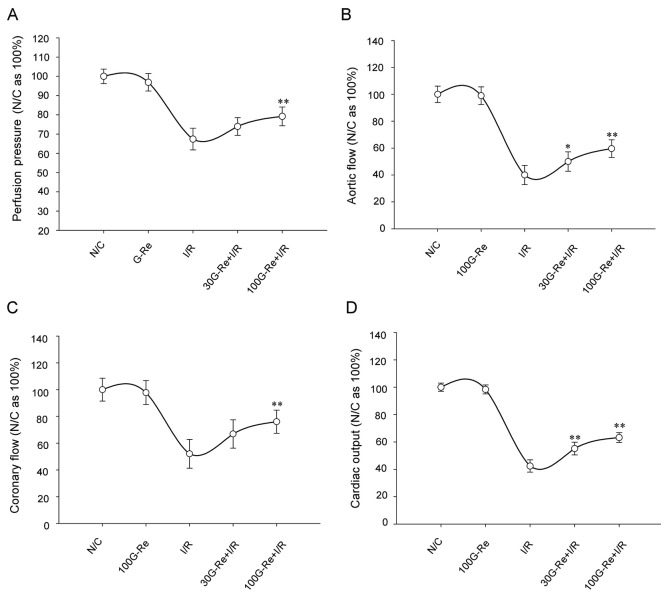
As shown in Table 1, perfusion pressure, aortic flow, coronary flow, and cardiac output were substantially decreased to an average of 67.41±5.66%, 40.0±7.13%, 52.06±10.77%, and 42.42±4.53%, respectively compared to N/C group (100% being an average of N/C) for I/R induction of 120 min (Fig. 3). On the other hand, increase in the average values of the hemodynamic parameters was observed for G-Re treated samples. Compared to N/C, samples treated with 100 μM G-Re showed higher values compared to 30 μM G-Re as shown in Fig. 3.
Table 1.
Hemodynamic data of each group at the 30 min interval for 120 min
| Group | 0 min | 30 min | 60 min | 90 min | 120 min | |
|---|---|---|---|---|---|---|
|
| ||||||
| PP(n=9, each group) | N/C | 102.5±4.3 | 105.3±3.7 | 103.4±4.1 | 101.5±3.7 | 102.8±3.5 |
| 100G-Re | 99.6±4.9a | 101.9±4.6a | 99.7±4.5a | 98.5±5.1a | 99.8±4.3a | |
| I/R | 71.2±5.3b | 73.8±6.1 b | 69.6±5.8b | 67.5±5.8b | 65.4±6.2b | |
| 30G-Re+I/R | 74.2±4.3 | 77.4±4.7 | 76.3±5.2 | 77.6±4.6** | 75.8±4.5** | |
| 100G-Re+I/R | 83.4±4.7** | 85.4±5.7** | 81.6±4.7 | 79.6±4.9** | 78.3±4.2** | |
| AF (n=9, each group) | N/C | 65.4±3.9 | 64.2±4.3 | 65.3±4.1 | 64.5±3.6 | 62.8±3.7 |
| 100G-Re | 66.1±4.2a | 65.1±4.7a | 64.3±3.5a | 62.9±4.3a | 60.4±4.5a | |
| I/R | 27.4±3.7b | 29.6±4.5b | 26.5±4.3b | 23.7±5.4b | 21.7±5.1b | |
| 30G-Re+I/R | 29.4±4.0 | 32.4±4.6 | 34.1±5.3* | 34.6±4.9** | 30.6±4.3** | |
| 100G-Re +I/R | 39.6±3.9** | 41.3±4.1** | 39.1±4.7** | 37.7±5.6** | 34.4±5.3** | |
| CF (n=9, each group) | N/C | 20.5±1.7 | 21.3±1.9 | 20.4±2.2 | 21.0±1.7 | 20.7±1.4 |
| 100G-Re | 19.8±1.5a | 20.4±1.8a | 20.1±1.9a | 19.5±1.9a | 21.8±2.2a | |
| I/R | 11.3±2.4b | 10.6±1.5b | 11.5±2.5b | 10.9±2.2b | 9.8±2.6b | |
| 30G-Re+I/R | 13.1±2.5 | 13.9±2.2 | 13.8±1.9 | 14.2±1.3** | 14.5±1.8** | |
| 100G-Re +I/R | 15.9±2.1** | 16.4±1.9** | 16.5±1.4** | 15.5±2.3** | 14.7±2.2** | |
| CO (n=9, each group) | N/C | 85.7±2.3 | 85.8±2.6 | 85.9±3.1 | 85.8±2.2 | 82.7±2.5 |
| 100G-Re | 85.1±2.6a | 85.9±2.8a | 84.7±2.3a | 81.7±2.7a | 81.6±3.5a | |
| I/R | 38.6±3.9b | 39.3±3.7b | 37.5±3.6b | 33.9±4.3b | 31.4±3.8b | |
| 30G-Re+I/R | 42.5±3.1* | 46.3±4.2** | 47.9±4.5** | 48.8±3.8** | 45.2±3.6** | |
| 100G-Re+I/R | 54.7±3.2** | 57.5±3.1** | 55.9±2.9** | 52.6±3.7** | 48.4±4.1** | |
Units are expressed as mmHg for perfusion pressure (PP), mL/min for aortic flow (AF), coronary flow (CF), and cardiac output (CO). Results are expressed as the mean±SD in each group.
N/C, normal control; G-Re, ginsenoside-Re; I/R, ischemia/reperfusion.
aSignificantly no different (p>0.05) from N/C; bSignificantly different (p<0.01) from N/C.
*Significantly different (p<0.05) from I/R control; **Significantly different (p<0.01) from I/R control.
Fig. 3. Relationships among perfusion pressure (A), aortic flow (B), coronary flow (C), and cardiac output changes (D) and each group on reperfusion for 120 min. Each bar represents the mean±SEM (n=9). N/C, normal control; G-Re, ginsenoside-Re; I/R, ischemia/reperfusion. *p<0.05, **p<0.01 compared with the I/R control group.
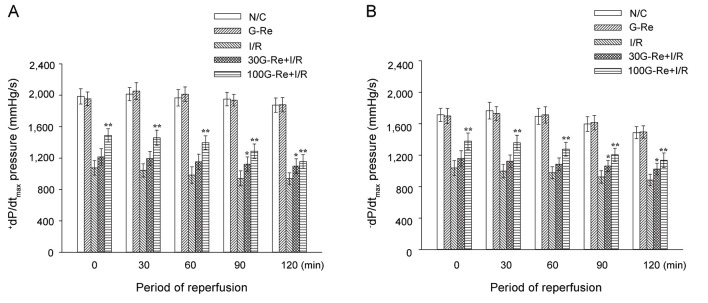
Additionally, when compared to N/C, I/R induction resulted in left ventricular dysfunction by a significant fall in average values of +dP/dtmax (1958.5±92.4 vs. 996.8±90.5 mmHg) and −dP/dtmax (1651.2±92.6 vs. 963.8±81.7 mmHg) for 120 min (Fig. 4A, B). Significant increase in the average values of +dP/dtmax, and −dP/dtmax was observed for 30 μM G-Re (1157.2±94.9 vs. 1090.8±80.7 mmHg) and 100 μM G-Re (1357.9±89.6 vs. 1270.9±92.1 mmHg) (Fig. 4A, B).
Fig. 4. The changes in the maximal rate of change in left ventricular contraction (+dP/dtmax) (A) and the maximal rate of change in left ventricular relaxation (-dP/dtmin) (B). Values are expressed as mean±SD. N/C, normal control; G-Re, ginsenoside-Re; I/R, ischemia/reperfusion. *p<0.05, **p<0.01 compared with the I/R control group.
As shown in Table 1, there was no difference between N/C and G-Re control (100 μM) for all hemodynamic parameters. This result suggests that the G-Re itself does not influence cardiac functions under the same conditions.
Effects on QRS intervals (conduction intervals)
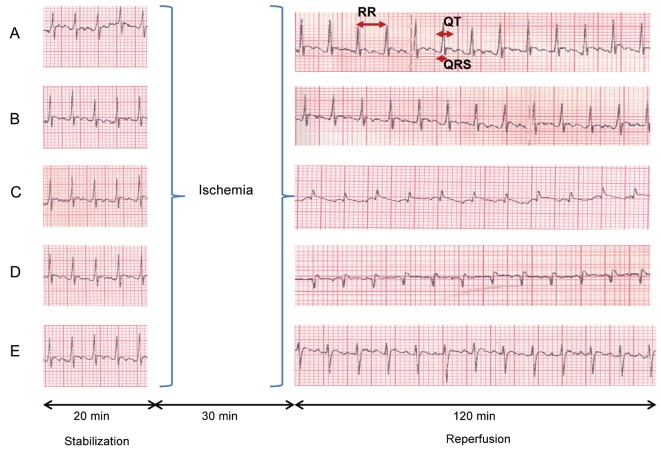
N/C animals showed a normal electrocardiograph pattern. On the other hand, G-Re control animals did not show any electrocardiograph changes. More so, conduction interval such as QRS interval was not found to be affected in N/C group. No significant differences on conduction intervals for G-Re control group and N/C group were observed as seen in Fig. 5.
Fig. 5. Effect of ginsenoside-Re (G-Re) on electrocardiographic pattern (A, normal control; B, G-Re control; C, ischemia/reperfusion [I/R] control; D, 30 μM G-Re+I/R; E, 100 μM G-Re+I/R) in isolated perfused heart.
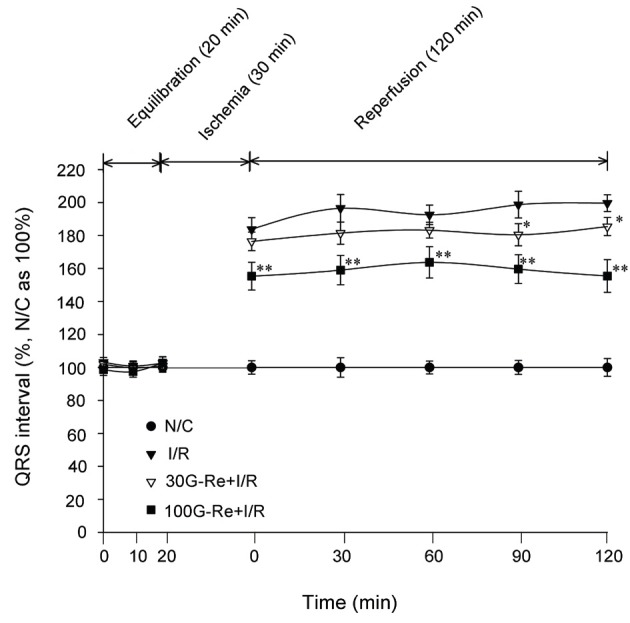
However, when measuring ECG patterns after global ischemia of 30 min followed by reperfusion of 120 min, QRS interval tended to be significantly prolonged as compared to N/C group (Figs. 5 and 6). In I/R control group, an average of QRS values were 194.2±6.9 % for 120 min as compare to N/C group (100% being an average of N/C). As shown in Fig. 5, I/R induction also exhibited the pathological R amplitude, indicating the induction of transmural myocardial infarction. Additionally, QRS interval (i.e., atrioventricular conductive times) had significantly shortened in 100 μM G-Re treated samples compared to 30 μM G-Re treated samples in time domains for 120 min I/R induction. Averages values of QRS interval were 181.36±5.86% for 30 μM G-Re and 158.6±9.08% for 100 μM G-Re as compared to 194.2±6.9% for I/R control group for 120 min (Fig. 6). As shown Fig. 6, G-Re with 30 μM dose was effective only for 90 to 120 min (p<0.5). The results indicated that the treatment of 100 μM G-Re is more effective than 30 μM G-Re in the preservation of atrioventricular conduction.
Fig. 6. Effect of ginsenoside-Re (G-Re) in QRS intervals on electrocardiographic pattern. Values are expressed as mean±SD for nine rats in each group. N/C, normal control; I/R, ischemia/reperfusion. *p<0.05, **p<0.01 compared with the I/R control group.
Effects on QT intervals
QT interval which indicates repolarization time showed the normal ECG pattern in N/C group. Treatment of 100 μM G-Re per se without ischemia induction gave no significant differences on QT interval as compared to N/C group. For the G-Re control group, QT interval changes were similar to those seen in N/C group as shown in Fig. 5 and 7. Moreover, treatment with I/R induction caused significant prolonged QT interval compared to N/C group. In the I/R control group, an average QT value was 130.18±3.86 % for 120 min when compared to N/C group (N/C average value=100%). For 100 μM G-Re, repolarization time, i.e., QT interval, had significantly shortened. Percentage-wise, the average values of QT interval for 120 min were 124.44±5.16% for 30 μM G-Re and 115.62±4.3% for 100 μM G-Re compared 130.18±3.86% or I/R control group.
Fig. 7. Effect of ginsenoside-Re (G-Re) on QT intervals against myocardial injury in isolated perfusion model. Values are expressed as mean±SD for nine rats in each group. N/C, normal control; I/R, ischemia/reperfusion. *p<0.05, **p<0.01 compared with the I/R control group.
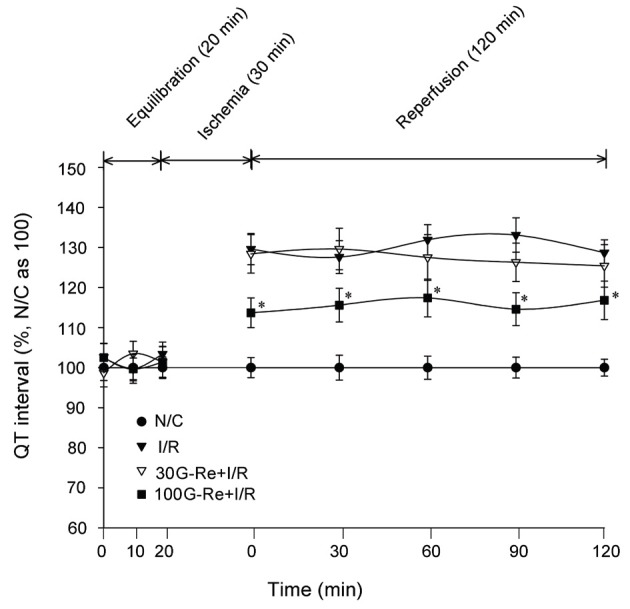
As shown in Fig. 7, G-Re at 30 μM dose gave no significant effectiveness in QT interval study for 120 min I/R periods (p<0.5). The results indicated that the treatment of 100 μM G-Re is only effective in the preservation of repolarization time.
Effects on RR intervals
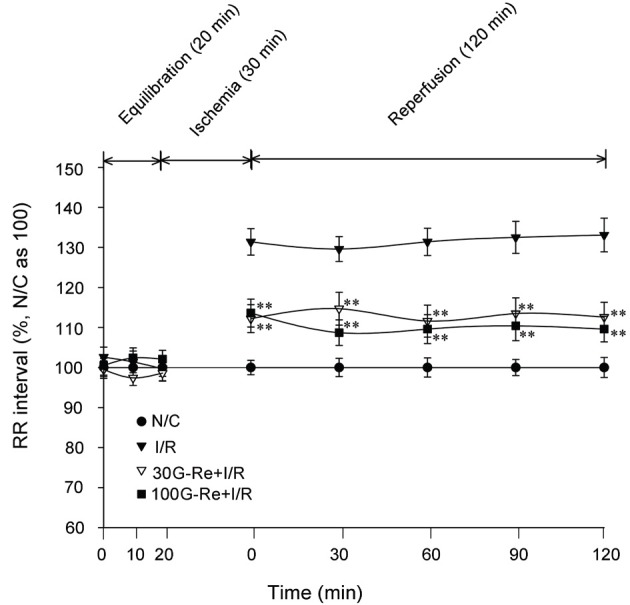
It is well known that the most trustworthy analysis of heart rate interval is performed with R wave to R wave (R-R) interval data [30]. In R-R interval, the heart rate is usually obtained from an ECG recording that is analyzed over a certain period of time. In the present study, normal R-R interval obtained similar to those seen in N/C group. However, in I/R control group, the R-R interval tended to be significantly prolonged as compared to N/C group. Compared to N/C group (average for 120 min=100%), the I/R control group had an average R-R interval of 130.19±3.8% for reperfusion of 120 min. This case was different when 30 and 100 G-Re were used as shown in Fig. 5 and 8. The R-R intervals for 30 and 100 μM G-Re were 112.92±3.84% and 110.38±3.44%, respectively. These interval data were significantly shorter than those seen in I/R control for reperfusion of 120 min. These results indicated that the treatment of G-Re at 30 and 100 μM dose is significantly effective in the preservation of heart rate (Fig. 8).
Fig. 8. Effect of ginsenoside-Re (G-Re) on R-R intervals against myocardial injury in isolated perfusion model. Values are expressed as mean±SD for nine rats in each group. N/C, normal control; I/R, ischemia/reperfusion. *p<0.05, **p<0.01 compared with the I/R control group.
Effect on tissue necrosis factor-α production
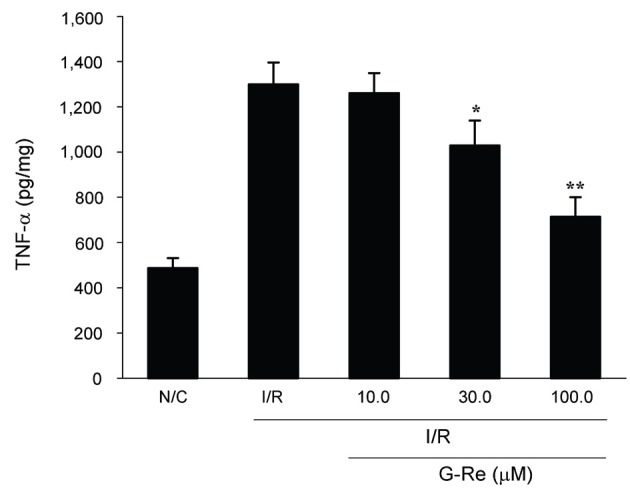
The effect of G-Re on the TNF-α production is shown in Fig. 9. Heart tissues of N/C groups produced a basal level of 487.35±43.98 pg/mg protein of TNF-α. After I/R induction, almost three-fold increase (1299.37±96.87 pg/mg protein) in the TNF-α was observed. On the other hand, treatment of G-Re at 30 and 100 μM dose before induction of ischemia caused a significant decrease in the amount of TNF-α produced (1028.54±10.5 pg/mL protein for 30 μM G-Re and 713.77±86.3 pg/mL protein for 100 μM G-Re, p<0.5, p<0.01). Treatment of 10 μM G-Re gave no significant effectiveness in the decrease of TNF-α level (p>0.5).
Fig. 9. Effect of ginsenoside-Re (G-Re) on cardiac tissue necrosis factor-α (TNF-α) levels in ischemia/reperfusion (I/R)-induced myocardial injury in isolated heart. Values are expressed as mean±SD for nine rats in each group. N/C, normal control. *p<0.05 and **p<0.01 as compared to I/R control group.
DISCUSSION
Cardiac ischemia sets into motion a series of pathological conditions that continue until the tissues die. These changes begin in seconds after cardiac ischemia and occur because oxygen in the cardiac cell becomes insufficient [31]. It is reported that isolated perfused heart model represents the best compromise in obtaining the data in relation to the modeling of ischemia [32]. Specifically, studying the isolated heart from small mammals provides a highly reproducible method, which can be studied conveniently and in large numbers at low cost. This allows a broad spectrum of physiological and pharmacological indices to be measured. This characteristic may be considered as an advantage in that it allows the convenient use for heart functions. In the present study, the anti-ischemic effects of G-Re were investigated by using the isolated heart model through analyses of changes in perfusion pressure, aortic flow, coronary flow, and cardiac output. Based from results, we found that treatment of G-Re improved hemodynamic functions during the reperfusion period of 120 min. A significant falls in +dP/dtmax and –dP/dtmax were observed in I/R control group. The deteriorating cardiac functions following I/R induction might be responsible for the significant decrease of ventricle pressure. In addition, absence of positive chronotropic effect in the face of reduction of ventricle pressure suggests impairment of cardiac conduction following I/R induction. Normally, the decrease of ventricle pressure is expected to reflexively increase cardiac contractility. However, in the study, none of these effects had been observed due to I/R injury. With regard to G-Re treatment, preservation of left ventricular function was evidenced by the significant improvement in +dP/dt max and –dP/dt max at various time intervals during 120 min reperfusion. However, G-Re treatment at small doses (3 and 10 μM) did not have significant affect on the hemodynamic functions during the reperfusion period (data not shown).
In the previous study, ECG was considered as an important measurement for study of myocardial ischemia [33]. In the present study, abnormal Q wave was recorded in I/R control group. In the ECG findings, the abnormal Q wave pattern suggests a characteristic for cardiac ischemia [33]. This Q wave normally appears when the infarcted cardiac muscle is electrically inactive and the loss of contractility. In this research, I/R induction showed a decrease in Q wave intensity and increases in QRS complex, QT interval, and R–R interval. These abnormal changes may be due to the cardiac dysfunction by injured myocardial cell. The increase in QT interval indicates the duration of the ventricular depolarization and repolarization. QT interval, the temporal difference between the QRS complex onset and the T wave end, is considered as a global measure of repolarization period which includes the total cardiac electrical activity. Therefore, QT interval changes can itself have clinical importance. Moreover, the changes of the relation between QT interval and R-R interval may have important meaning as well. From the results, the treatment of G-Re at 30 and 100 μM doses decreased significantly the pathological abnormality in the ECG pattern such as QRS complex, QT interval, and R-R interval. This is suggestive of protective effect of G-Re treatment in cardiac functions. Aditionally, a significant increase in inflammatory cytokines such as TNF-α in the I/R control was observed. Previously, it was reported that TNF-α plays an important role in myocardial injury [34]. The treatment of G-Re, however, inhibited the TNF-α production which illustrates the beneficial effect of G-Re. With results all taken together, hemodynamic and biochemical results emphasize the beneficial action of G-Re as a cardioprotective material in the present I/R study. Therefore, the present study provides a scientific rationale for the beneficial use of G-Re. In the point of the safety and efficacy of G-Re, prospective further studies for G-Re should be considered to establish the effectiveness of G-Re in the treatment of cardiac ischema.
Acknowledgments
This research was supported by Basic Science Research Program through the National Research Foundation of Korea (NRF) funded by the Ministry of Education, Science and Technology (2012R1A1A4A01011658).
References
- 1.Ostadal B. The past, the present and the future of experimental research on myocardial ischemia and protection. Pharmacol Rep. 2009;61:3–12. doi: 10.1016/s1734-1140(09)70002-7. [DOI] [PubMed] [Google Scholar]
- 2.Gross GJ, Kersten JR, Warltier DC. Mechanisms of postischemic contractile dysfunction. Ann Thorac Surg. 1999;68:1898–1904. doi: 10.1016/S0003-4975(99)01035-8. [DOI] [PubMed] [Google Scholar]
- 3.Piper HM, Garcia-Dorado D. Prime causes of rapid cardiomyocyte death during reperfusion. Ann Thorac Surg. 1999;68:1913–1919. doi: 10.1016/S0003-4975(99)01025-5. [DOI] [PubMed] [Google Scholar]
- 4.Verma S, Fedak PW, Weisel RD, Butany J, Rao V, Maitland A, Li RK, Dhillon B, Yau TM. Fundamentals of reperfusion injury for the clinical cardiologist. Circulation. 2002;105:2332–2336. doi: 10.1161/01.CIR.0000016602.96363.36. [DOI] [PubMed] [Google Scholar]
- 5.Fleming PR. A short history of cardiology. Rodopi Publishers; Amsterdam: 1997. [PubMed] [Google Scholar]
- 6.Rodriguez-Sinovas A, Abdallah Y, Piper HM, Garcia-Dorado D. Reperfusion injury as a therapeutic challenge in patients with acute myocardial infarction. Heart Fail Rev. 2007;12:207–216. doi: 10.1007/s10741-007-9039-9. [DOI] [PubMed] [Google Scholar]
- 7.Buja LM. Myocardial ischemia and reperfusion injury. Cardiovasc Pathol. 2005;14:170–175. doi: 10.1016/j.carpath.2005.03.006. [DOI] [PubMed] [Google Scholar]
- 8.Kim JH. Cardiovascular diseases and Panax ginseng: a review on molecular mechanisms and medical applications. J Ginseng Res. 2012;36:16–26. doi: 10.5142/jgr.2012.36.1.16. [DOI] [PMC free article] [PubMed] [Google Scholar]
- 9.Murphy E, Steenbergen C. Mechanisms underlying acute protection from cardiac ischemia-reperfusion injury. Physiol Rev. 2008;88:581–609. doi: 10.1152/physrev.00024.2007. [DOI] [PMC free article] [PubMed] [Google Scholar]
- 10.Hardoon SL, Whincup PH, Lennon LT, Wannamethee SG, Capewell S, Morris RW. How much of the recent decline in the incidence of myocardial infarction in British men can be explained by changes in cardiovascular risk factors? Evidence from a prospective population-based study. Circulation. 2008;117:598–604. doi: 10.1161/CIRCULATIONAHA.107.705947. [DOI] [PMC free article] [PubMed] [Google Scholar]
- 11.Heidenreich PA, McClellan M. Trends in treatment and outcomes for acute myocardial infarction: 1975-1995. Am J Med. 2001;110:165–174. doi: 10.1016/S0002-9343(00)00712-9. [DOI] [PubMed] [Google Scholar]
- 12.Luepker RV. Decline in incident coronary heart disease: why are the rates falling? Circulation. 2008;117:592–593. doi: 10.1161/CIRCULATIONAHA.107.747477. [DOI] [PubMed] [Google Scholar]
- 13.Peng DC, Chen WP, Xie JT. Antihyperglycemic effects of ginseng and possible mechanisms. Drugs Future. 2008;33:507–514. doi: 10.1358/dof.2008.033.06.1188424. [DOI] [Google Scholar]
- 14.Chevallier A. Encyclopedia of herbal medicine. DK Publishing; New York: 2000. [Google Scholar]
- 15.Park YH, Kim YC, Park SU, Lim HS, Kim JB, Cho BK, Bae H. Age-dependent distribution of fungal endophytes in Panax ginseng roots cultivated in Korea. J Ginseng Res. 2012;36:327–333. doi: 10.5142/jgr.2012.36.3.327. [DOI] [PMC free article] [PubMed] [Google Scholar]
- 16.Blumenthal M, Goldberg A, Brinckmann J, Foster S, Tyler VE. Ginseng root. Integrative Medicine Communications; Newton: 2000. [Google Scholar]
- 17.Barnes PM, Powell-Griner E, McFann K, Nahin RL. Complementary and alternative medicine use among adults: United States, 2002. Adv Data. 2004;343:1–19. [PubMed] [Google Scholar]
- 18.Lee SJ, Sung JH, Lee SJ, Moon CK, Lee BH. Antitumor activity of a novel ginseng saponin metabolite in human pulmonary adenocarcinoma cells resistant to cisplatin. Cancer Lett. 1999;144:39–43. doi: 10.1016/S0304-3835(99)00188-3. [DOI] [PubMed] [Google Scholar]
- 19.Baek SH, Bae ON, Park JH. Recent methodology in ginseng analysis. J Ginseng Res. 2012;36:119–134. doi: 10.5142/jgr.2012.36.2.119. [DOI] [PMC free article] [PubMed] [Google Scholar]
- 20.Shi Y, Sun C, Zheng B, Li Y, Wang Y. Simultaneous determination of nine ginsenosides in functional foods by high performance liquid chromatography with diode array detector detection. Food Chem. 2010;123:1322–1327. doi: 10.1016/j.foodchem.2010.06.014. [DOI] [Google Scholar]
- 21.Gillis CN. Panax ginseng pharmacology: a nitric oxide link? Biochem Pharmacol. 1997;54:1–8. doi: 10.1016/S0006-2952(97)00193-7. [DOI] [PubMed] [Google Scholar]
- 22.Kim DH. Chemical diversity of Panax ginseng, Panax quinquifolium, and Panax notoginseng. J Ginseng Res. 2012;36:1–15. doi: 10.5142/jgr.2012.36.1.1. [DOI] [PMC free article] [PubMed] [Google Scholar]
- 23.Xie JT, Mehendale SR, Li X, Quigg R, Wang X, Wang CZ, Wu JA, Aung HH, A Rue P, Bell GI, et al. Anti-diabetic effect of ginsenoside Re in ob/ob mice. Biochim Biophys Acta. 2005;1740:319–325. doi: 10.1016/j.bbadis.2004.10.010. [DOI] [PubMed] [Google Scholar]
- 24.Xie JT, Shao ZH, Vanden Hoek TL, Chang WT, Li J, Mehendale S, Wang CZ, Hsu CW, Becker LB, Yin JJ, et al. Antioxidant effects of ginsenoside Re in cardiomyocytes. Eur J Pharmacol. 2006;532:201–207. doi: 10.1016/j.ejphar.2006.01.001. [DOI] [PubMed] [Google Scholar]
- 25.Peng L, Sun S, Xie LH, Wicks SM, Xie JT. Ginsenoside Re: pharmacological effects on cardiovascular system. Cardiovasc Ther. 2012;30:e183–e188. doi: 10.1111/j.1755-5922.2011.00271.x. [DOI] [PubMed] [Google Scholar]
- 26.Minematsu T, Ohtani H, Yamada Y, Sawada Y, Sato H, Iga T. Quantitative relationship between myocardial concentration of tacrolimus and QT prolongation in guinea pigs: pharmacokinetic/pharmacodynamic model incorporating a site of adverse effect. J Pharmacokinet Pharmacodyn. 2001;28:533–554. doi: 10.1023/A:1014460404352. [DOI] [PubMed] [Google Scholar]
- 27.Ohtani H, Hanada E, Yam K, Sawada Y, Iga T. Pharmacokinetic-pharmacodynamic analysis of the electrocardiographic effects of terfenadine and quinidine in rats. Biol Pharm Bull. 1996;19:1189–1196. doi: 10.1248/bpb.19.1189. [DOI] [PubMed] [Google Scholar]
- 28.Song SB, Tung NH, Quang TH, Ngan NT, Kim KE, Kim YH. Inhibition of TNF-α-mediated NF-κB transcriptional activity in HepG2 cells by dammarane-type saponins from Panax ginseng leaves. J Ginseng Res. 2012;36:146–152. doi: 10.5142/jgr.2012.36.2.146. [DOI] [PMC free article] [PubMed] [Google Scholar]
- 29.Yang Y, Hu SJ, Li L, Chen GP. Cardioprotection by polysaccharide sulfate against ischemia/reperfusion injury in isolated rat hearts. Acta Pharmacol Sin. 2009;30:54–60. doi: 10.1038/aps.2008.12. [DOI] [PMC free article] [PubMed] [Google Scholar]
- 30.Peng Y, Sun Z. Characterization of QT and RR interval series during acute myocardial ischemia by means of recurrence quantification analysis. Med Biol Eng Comput. 2011;49:25–31. doi: 10.1007/s11517-010-0671-5. [DOI] [PubMed] [Google Scholar]
- 31.Bak I, Lekli I, Juhasz B, Nagy N, Varga E, Varadi J, Gesztelyi R, Szabo G, Szendrei L, Bacskay I, et al. Cardioprotective mechanisms of Prunus cerasus (sour cherry) seed extract against ischemia-reperfusion-induced damage in isolated rat hearts. Am J Physiol Heart Circ Physiol. 2006;291:H1329–H1336. doi: 10.1152/ajpheart.01243.2005. [DOI] [PubMed] [Google Scholar]
- 32.Hearse DJ, Sutherland FJ. Experimental models for the study of cardiovascular function and disease. Pharmacol Res. 2000;41:597–603. doi: 10.1006/phrs.1999.0651. [DOI] [PubMed] [Google Scholar]
- 33.Patel V, Upaganlawar A, Zalawadia R, Balaraman R. Cardioprotective effect of melatonin against isoproterenol induced myocardial infarction in rats: a biochemical, electrocardiographic and histoarchitectural evaluation. Eur J Pharmacol. 2010;644:160–168. doi: 10.1016/j.ejphar.2010.06.065. [DOI] [PubMed] [Google Scholar]
- 34.Ramani R, Mathier M, Wang P, Gibson G, Togel S, Dawson J, Bauer A, Alber S, Watkins SC, McTiernan CF, et al. Inhibition of tumor necrosis factor receptor-1-mediated pathways has beneficial effects in a murine model of postischemic remodeling. Am J Physiol Heart Circ Physiol. 2004;287:H1369–H1377. doi: 10.1152/ajpheart.00641.2003. [DOI] [PubMed] [Google Scholar]


