

Summary
A bifidobacterial mixed‐species microarray platform was used in a proof‐of‐principle study to address the composition and development of bifidobacteria in DNA extracted from faecal samples. These were collected in a time‐course of 2 years since birth and derived from human infants that were breastfed, standard formula‐fed or received a prebiotic formula during their weaning period. A set of over 50 samples was analysed, testifying for the throughput of the designed platform for multiple genome hybridizations. The generated data revealed that faecal samples of breastfed infants contained a high abundance of genomic DNA homologous to Bifidobacterium breve. In contrast, faecal samples from standard formula‐fed infants lacked detectable amounts of this B. breve DNA but contained genes with high similarity to B. longum. Remarkably, infants that received breastmilk and later a prebiotic formula consisting of a standard formula milk containing a mixture of specific galacto‐ and fructo‐oligosaccharides, continued to harbour a B. breve‐dominant faecal population. One infant that received standard formula in combination with the additional B. lactis Bb12 culture, contained significant amounts of faecal DNA belonging to Bb12 but only during the period of ingestion. The microarray platform showed sufficient sensitivity to analyse the B. breve group at the strain level. Overall, the B. breve populations observed in the faecal samples of the studied infants showed a stable composition over time and were unique per infant. In conclusion, our results show the applicability of comparative genome hybridization to study bifidobacterial populations in infant faecal samples without the use of any amplification step.
Introduction
The human gastrointestinal (GI) tract is colonized since birth by a complex community of microorganisms that is known to impact its host (Hooper and Gordon, 2001; Vaughan et al., 2005; Zoetendal et al., 2008). The contribution of the GI tract microbiota to converting dietary components into short‐chain fatty acids with significant caloric value, vitamins and other health‐promoting compounds has been well established. However, the interest in determining the microbial composition and its development is growing as it has been shown that the GI tract microbiota has developed intimate relations with its host, communicates with its immune system and can be affected by specific dietary components or bacteria, such as those marketed as prebiotics and probiotics (Ouwehand et al., 2005; Saxelin et al., 2005; Zoetendal et al., 2008; van Baarlen et al., 2009).
The microbial composition of the adult human gut has been subject to multiple studies and found to consist of an individual core that is relatively stable in time (Zoetendal et al., 2008). Moreover, phylogenetic analyses of adult subjects have revealed a general core of bacterial representatives shared between multiple individuals of different ages (Rajilic‐Stojanovic et al., 2009; Tap et al., 2009). This was confirmed at the genomic level by recent massive parallel sequence analyses of the adult gut microbiome although at a lower level of depth (Kurokawa et al., 2007; Turnbaugh et al., 2009; Qin et al., 2010).
In contrast to the large attention for the adult microbiota, there is only limited information on the development of our intestinal microbe in early life. This is partly due to the large variability in the microbial colonization that is encountered after birth, as was observed in a longitudinal study using culture independent global analyses with a limited set of newborns in the Netherlands (Favier et al., 2002). This was confirmed in a more recent comprehensive and longitudinal studies with US babies (Palmer et al., 2007; Dominguez‐Bello et al., 2010). It is likely that the first bacterial contact will be different for every individual and in most cases the intestinal inoculum for the newborn baby will derive from the mother. Deep genome sequencing studies of the mother and child intestinal microbiota appear to confirm this (Turnbaugh et al., 2009). We hypothesize that depending on the infants' environmental and host factors, certain groups of bacteria will be favoured and dominate their intestinal microbiota. One group of commensal bacteria, those belonging to the genus Bifidobacterium, is found among the first colonizers of the baby intestine, notably when breastfed (Benno et al., 1984; Harmsen et al., 2000; Favier et al., 2002; Penders et al., 2006). Remarkably, different results were observed in the recent studies indicating that bifidobacteria are present in only a small fraction of infants or are not numerically dominant in babies (Hopkins et al., 2005; Palmer et al., 2007). However, this may be due to bias introduced by the methodologies of DNA extraction or PCR detection as discussed recently (Salonen et al., 2010). Alternatively, geographic origin (EU versus US), diet or both may play a role in explaining this difference that is in particular notable in view of the presumed interactions of bifidobacteria and our immune system (O'Hara and Shanahan, 2006; Boesten and de Vos, 2008). Data on the compositions of bifidobacterial populations in infants show variable results, partly reflecting the high variability between the baby microbiota. Overall, B. longum, B. breve, B. infantis and B. adolescentis have been found in faecal samples of healthy human infants (Matsuki et al., 1998; He et al., 2001a; Turroni et al., 2009a). A broader set of species has been described for the ‘adult‐like’ bifidobacterial microbiota including additional species of B. catenulatum, B. bifidum and B. pseudolongum (Matsuki et al., 1998; He et al., 2001b; Turroni et al., 2009a). Moreover, there are indications for several new Bifidobacterium species in the human gut that so far have not been cultured (Ben‐Amor et al., 2005; Turroni et al., 2009b). The development of the infant microbial community from the time of birth to the ‘adult‐like’ composition often follows the introduction of solid foods after weaning and its timeframe is poorly understood. Similarly, the effect of diet on the composition of the infant microbiota is also controversial. Numerous studies have found a lower abundance of bifidobacteria and a higher abundance of aerobic bacteria in the microbiota of formula‐fed infants relative to breastfed infants (Harmsen et al., 2000; Hopkins et al., 2005; Penders et al., 2006), yet other reports have found no such difference (Penders et al., 2005). An explanation could be that these studies have to cope with numerous different parameters such as differences between babies, extraction methods, sample storage and detection platforms.
Interestingly, bifidobacteria have been detected in breastmilk samples using culture‐independent molecular techniques (Gronlund et al., 2007; Gueimonde et al., 2007; Collado et al., 2009). Although it is not clear how translocation of bifidobacteria from intestine to breastmilk occurs within the mother, it has been shown that breastmilk contains similar bacteria both before and after breastfeeding, rendering the possibility of inoculation of the breastmilk by the infant less likely. Recently, it has been suggested that the colonization of breastmilk may take place by transfer of intestinal bacteria within the phagocytosing cells from the mother's gut to breastmilk (Martín et al., 2004; Perez et al., 2007). Interestingly, bifidobacterial translocation has recently been shown to occur after oral administration in a particular mouse model (Cronin et al., 2010). In addition, DNA from intestinal bifidobacteria was detected in human placenta samples. Although no bifidobacteria could be cultured, this suggests that horizontal transfer of bacterial DNA from mother to fetus may occur via the placenta (Satokari et al., 2009). These results imply that a constant supply of bifidobacteria to the infant's intestine is thus assured during breastfeeding and will affect the development of the intestinal microbiota.
For further studying the impact of bifidobacteria or other bacterial groups, it is essential to have reliable and quantitative identification tools with high discriminating abilities. A variety of culturing‐independent microbial screening and detection techniques have been developed. Small subunit ribosomal DNA (rDNA) sequence analysis via cloning or pyrosequencing (Matsuki et al., 1998; Kwon et al., 2005; Andersson et al., 2008), temperature/denaturing gel electrophoresis (D/TGGE) (Zoetendal et al., 1998; Favier et al., 2002) and terminal‐restriction fragment length polymorphism (T‐RFLP) (Zoetendal et al., 2008) are useful for identifying the dominant members of a population and for discovering new rDNA species (Nagashima et al., 2003), but inadequate for detection and quantification of rare species while they all rely on PCR amplifications. Other currently available quantitative techniques, such as fluorescence in situ hybridization (FISH) (Amann et al., 1990; 1995; Moter and Gobel, 2000), dot‐blot hybridization (Hopkins et al., 2005) and real‐time PCR (Haarman and Knol, 2005; Penders et al., 2005), are not easily applied to large numbers of taxonomic groups or also need an amplification reaction. Recently, 16S rRNA‐based phylogenetic microarrays have been developed to study the intestinal microbial ecology of different age groups (Palmer et al., 2007; Zoetendal et al., 2008; Claesson et al., 2009; Rajilic‐Stojanovic et al., 2009). Moreover, a variety of genomics approaches including comparative genome hybridization have been developed to study the functionality of bifidobacteria (Ventura et al., 2009). Previously, we described the development and application of comparative genome hybridization approach involving a bifidobacterial multispecies (BMS)‐microarray platform, consisting of genomic DNA fragments that are specific for Bifidobacterium species and phylogenetic groups of bifidobacteria (Boesten et al., 2009). Here, we expand the use of this BMS‐microarray to analyse complex Bifidobacterium communities in faecal samples that were obtained from six healthy human infants that were either breastfed, standard formula‐fed, or fed with probiotic of prebiotic formulas. From every infant 10 faecal samples ranging from the first week to 2 years of age were analysed for their Bifidobacterium DNA content and composition. Specific patterns were observed that showed the impact of the diet notably on the development of B. breve communities. This proof of principle study illustrates the potential of using comparative genome hybridization in faecal samples and shows population shifts at the strain level obviating the need for cultivation and amplification procedures.
Results
Analysis of the bifidobacterial community based on genomic hybridization patterns
We designed a culture‐independent tool for analysing the composition of bifidobacterial communities within complex microbial samples on species and strain level by generating and mapping of genomic hybridization patterns. This tool is based on a random clone microarray containing total DNA of those bifidobacterial species that have been found in the human intestinal tract. DNA from collected faecal samples was extracted to test the applicability of the microarray platform as a molecular tool in a proof‐of‐principle study (Fig. 1). Faecal samples were obtained from six healthy human infants who received different diets during their weaning period. Two infants were breastfed, two were fed with a standard formula – one of them received an additional supplement of viable B. lactis Bb12 cells, and two were fed with a formula containing a prebiotic mixture of galacto‐ and fructo‐oligosaccharides (GOS and FOS respectively). In order to study the temporal development and changes of the bifidobacterial composition, a total of 10 samples were analysed per infant and the first sample was obtained at day 5 and the final sample at an age of 25 months (Fig. 1). The microarray results show that most faecal samples of each of the infants turned out to be Bifidobacterium‐positive (Fig. 2). Furthermore, we generally observed a drop in hybridization signals, in general the majority (over 90%) of the signals disappeared, from the moment the infants reached the age of 1 year. In most cases, this time point correlates with the change of diet. Overall, during the period between 6 and 12 months of age the infants received a mixed diet. This means that next to their weaning they started to ingest solid food. This obviously affects the composition of their intestinal microbiota. To verify whether there was any effect on the total community and that of bifidobacteria in particular, we performed qPCR amplification of strategic phylogenetic groups (see below). In line with the array data the bifidobacteria qPCR values also dropped, indicating that the absolute amount of Bifidobacterium DNA was decreased (Fig. 2).
Figure 1.
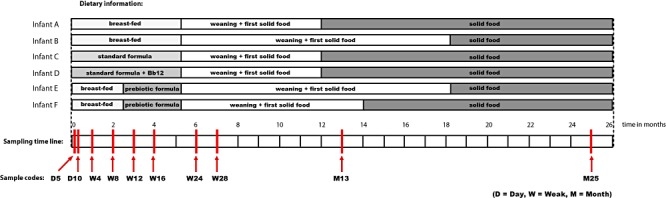
Schematic sample information overview. A selection of faecal samples collected during the study described by Bakker‐Zierikzee and colleagues (2005).
Figure 2.
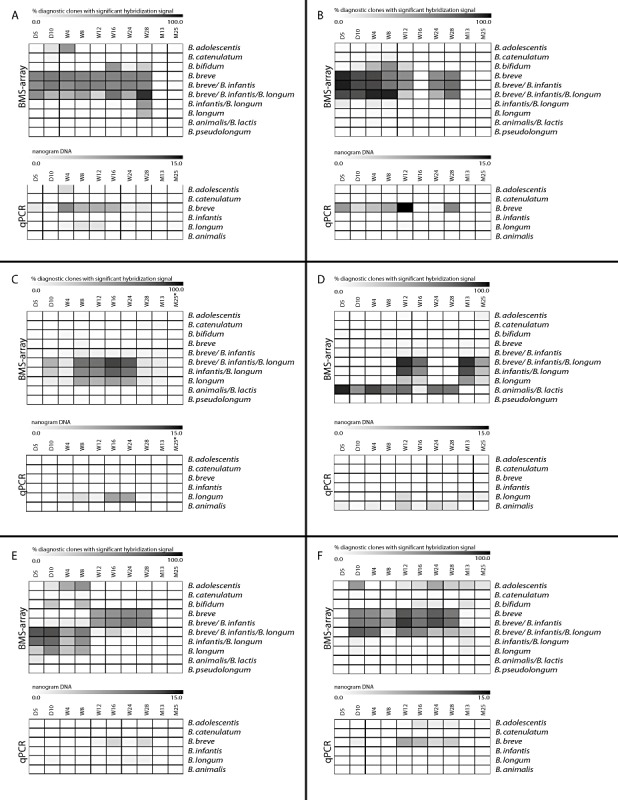
Heat map visualization of the microarray‐ and qPCR‐based screening of the Bifidobacterium composition of faecal samples of six infants who received three different diets (Fig. 1). Time‐course samples are indicated by the age of the infant (D = day, W = week, M = month). The microarray data are presented as the percentage of marker‐clones, per species or species group (Table 1), that give a significant hybridization. The percentages are visualized according to the colour‐bar above the heat map. The qPCR results are presented as DNA concentrations (nanograms of DNA per sample) of the different species and visualized according to the colour‐bar above the heat map. The asterisk ‘*’ indicates data not available.
The presented microarray data showed that the samples from two infants who were breastfed for at least 1 year, infants A and B, showed presence of DNA fragments that are highly homologous to B. breve DNA (Fig. 2A and B). The DNA samples originating from infants C and D, who were fed a standard formula, showed abundance of bifidobacterial DNA, which was highly homologous to DNA of B. longum ssp. longum (Fig. 2C and D). Additionally, the samples isolated from the faeces of infant D contained DNA that hybridized also with marker clones for the B. animalis/B. lactis group. This latter observation is in concordance with the feeding trial of the viable B. lactis Bb12 supplement, which started from birth and ended after 12 months. The infants that received a prebiotic mixture showed a shift in the bifidobacterial composition (Fig. 2E and F). This shift was observed between week 8 and week 12. Interestingly, this correlates with the start of the prebiotic mixture feeding trial at week 10. From week 12, DNA homologous to B. breve becomes more abundant whereas DNA of other Bifidobacterium species disappears (Fig. 2).
Validation by qPCR analysis
To support the microarray results and to gain information on the quantitative amounts of Bifidobacterium species present in the faecal samples, a series of qPCR analyses were performed as summarized in heatmaps (Fig. 2). Although it is a totally different approach based on specific ribosomal RNA sequences, the qPCR results were in line with the data obtained by the microarray platform. This means that when the microarray detected DNA homologous to the DNA of a specific Bifidobacterium species, the qPCR platform detected the presence of DNA originating from that same species. Differences between qPCR and microarray results can be explained by the fact that qPCR is a more quantitative measurement than the microarray platform. The dynamic ranges of the platforms are quite comparable and the microarray platform could detect as little as 0.1% of the DNA isolated from the faecal samples (data not shown). However, the microarray platform provided detailed information on the genetic content and shifts within one species or phylogenetic group of bifidobacteria that goes beyond the detection capacity of qPCR (see below).
Screening for genomic shifts within one Bifidobacterium species group in time
Due to its high‐resolution output, the microarray platform does not only give information on shifting of bifidobacterial species but also enables to zoom in at the strain level. Comparison of hybridization signals results in detailed information on the shifting of bifidobacterial genomic material even within a single species, which suggests succession of strains. Using this principle, we analysed the DNA samples and zoomed in on the composition of the B. breve species group of each infant (Fig. 3). We concluded that every infant contained a unique B. breve community, with the exception of the faecal samples of infants C and D that did not contain any B. breve related DNA (Fig. 3). This was observed earlier as visualized in Fig. 2. The B. breve populations were generally stable in time. Concentrating on the differential markers within the B. breve set, we detected a shift in time in the hybridization pattern of infant B (Fig. 3). We conclude that the B. breve group of this infant gained and lost specific B. breve‐specific DNA fragments at approximately 12 weeks of development. However, a core B. breve genome seemed to be present in both situations. We hypothesize that a B. breve population always contains the B. breve core genome plus B. breve strain‐specific genomic fragments. To gain more insight in the genes encoded by these fragments we have sequenced a subset of 11 genomic B. breve markers (Fig. 4). Fragments 1 and 2 are present in all samples that are known to contain B. breve, based on the qPCR results. We suggest that they belong to the B. breve‘core‐genome’ (Fig. 4). Fragments 5 and 6 (Fig. 4) seem to appear in the later time samples in infant B but were present in all time samples of infant A. These fragments must be strain‐specific. The best blastx hits all showed more than 98% sequence homology to genes in the published B. breve DSM 20213 genome (ACCG02000000) and had E‐values close to zero. Fragments 9, 10 and 11 are not specific for any of the faecal isolates but only for the B. breve type strain that was used for defining the species‐specific marker fragments (Table 1). Inspection of the other fragments showed them to code for stress‐related functions, proteins involved in cell envelope integrity or hypothetical proteins. Remarkably, fragments 1 and 4 coded for a potential sugar‐specific PTS transport component and a beta‐glycosidase that were both almost or completely absent in the babies that received standard formula. It is tempting to speculate that the used‐formula product lacks the sugars present in the breastmilk and prebiotic FOS/GOS mixture that was used to feed the other babies.
Figure 3.
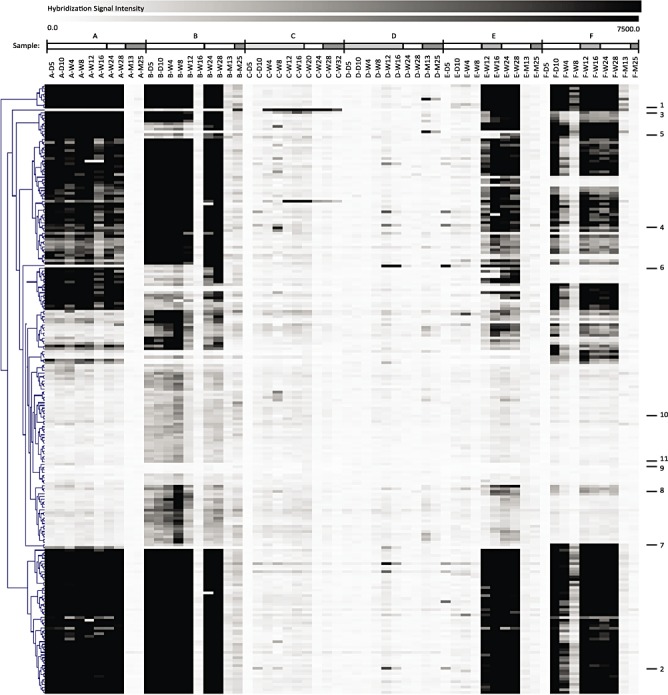
Hierarchical clustering (Pearson correlation) of the hybridization signals of genomic DNA fragments within the B. breve marker set for all faecal samples in time‐course order. Signal intensities are indicated by a black‐white colour gradient. On the X‐axis the sample codes are presented (D = day; W = week; M = month). Samples from one infant are highlighted by the bars above the codes as indicated in Fig. 1.
Figure 4.
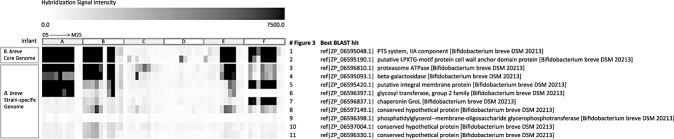
Hybridization signal intensities and ‘best blastx hits’ (> 98% homology) of a subset of 11 B. breve markers that have been sequenced are visualized for each marker fragment. The sample order is similar to the order in Fig. 3. Marker fragments 1 and 2 can be described as B. breve core genome whereas marker fragments 3–11 show to be strain‐specific.
Table 1.
Marker groups, the number of marker clones they include and the strains of origin.
| Marker group names | Strains of origin | Number of marker clones | ||||||||||
|---|---|---|---|---|---|---|---|---|---|---|---|---|
| B. adolescentis LMG 10502T (Reuter, 1963) | B. animalis ssp. animalis LMG 10508T (Scardovi et al., 1970) | B. animalis ssp. lactis LMG 18314T (Masco et al., 2004; Meile et al., 1997) | B. bifidum LMG 11041T (Orla‐Jensen, 1924) | B. breve LMG 13208T (Reuter, 1963) | B. breve NCIMB 8807 (Leahy et al., 2005; Reuter, 1963) | B. longum biotype infantis LMG 8811T (Reuter, 1963; Sakata S et al., 2002) | B. longum LMG 13197T (Reuter, 1963) | B. longum NCC 2705 (Reuter, 1963; Schell et al., 2002) | B. catenulatum LMG 11043T (Scardovi and Crociani, 1974) | B. pseudolongum ssp. pseudolongum LMG 11571T (Yaeshima et al., 1992) | ||
| B. adolescentis | * | 141 | ||||||||||
| B. animalis/B. lactis | * | * | 68 | |||||||||
| B. bifidum | * | 49 | ||||||||||
| B. breve | * | * | 227 | |||||||||
| B. breve/B. infantis | * | * | * | 129 | ||||||||
| B. breve/B. infantis/B. longum | * | * | * | * | * | 204 | ||||||
| B. infantis/B. longum | * | * | * | 127 | ||||||||
| B. longum | * | * | 167 | |||||||||
| B. catenulatum | * | 1348 | ||||||||||
| B. pseudolongum | * | 103 | ||||||||||
The asterisk ‘’ indicates which marker groups are based on which strains.
Discussion
In this study we showed that comparative genome hybridization using a bifidobacterial mixed species microarray platform can be applied as a culture‐independent tool to analyse the composition and development of Bifidobacterium populations in faecal samples from human infants. Using this microarray platform we obtained a high‐resolution data output, which enabled us to zoom in towards the species and strain level of the bifidobacterial population. An advantage of our approach is that we did not need to enrich our DNA samples for bifidobacterial DNA. While qPCR is more quantitative than the microarray platform, both approaches have similar sensitivity and dynamic range. Our observations showed differences in composition of faecal bifidobacterial communities in developing infants. As this study serves as a proof of principle, we want to stress that these results are based on a limited set of infants. Nevertheless, the data suggest an obvious link between diet and Bifidobacterium population. Moreover, our results indicate that the prebiotic formula applied in this study affects the composition of the intestinal Bifidobacterium population. As indicated previously (Bakker‐Zierikzee et al., 2005), the composition of the infants who received the GOS/FOS mixture seems to be shifted towards the direction of the Bifidobacterium community as found in infants who were breastfed, in contrast to the standard‐formula diet (Fig. 2). In line with other studies no B. pseudolongum homologous DNA was detected in the faecal samples tested (Benno et al., 1984; Matsuki et al., 1999; Harmsen et al., 2000; Favier et al., 2002; 2003; Haarman and Knol, 2005). In conclusion, we expect that in combination with a large well‐defined sample set, the described comparative hybridization approach with the microarray platform will contribute to a better understanding of our intestinal microbial ecology. Furthermore, this application could be combined with next‐generation sequencing to generate a pan‐genomic Bifidobacterium screening tool.
Experimental procedures
Sample collection, DNA isolation and qPCR analysis
A selection of faecal samples, collected during the study described by Bakker‐Zierikzee and colleagues (2005), formed the basis of this study (Bakker‐Zierikzee et al., 2005). Detailed information on the samples is visualized in Fig. 1.
For the total DNA isolation from faecal samples, a 96‐well plate (Axygen, VWR International BV, Amsterdam, NL, USA) was filled with 250 µl 0.1 mm zirconium beads (Brunschwig Chemie BV, Amsterdam, NL, USA) washed in lysis buffer without detergents (Agowa GmbH, Berlin, D), 200 µl phenol solution (Tris pH 8.0) and 250 µl lysis buffer without detergents (Agowa GmbH, Berlin, D). Subsequently, per well a volume of a fully loaded inoculation loop (Greiner Bio One, Alphen a/d Rijn, NL), resembling 10 µl of faecal sample, was added to the mixture. After 2 min of bead beating (Mini Beadbeater, Biospec Products, Lab Services BV, Breda, NL, USA), the plate was cooled on ice. Then the plate was centrifuged for 10 min at 1700 g and 20°C. The supernatant, about 175 µl, was transferred into a 0.5 ml 96 wells plate (Axygen, VWR International BV, Amsterdam, NL, USA) and 100 µl phenol solution (in Tris pH 8.0) was added. After 10 min of centrifuging at 1700 g and 20°C the supernatant, per well approximately 150 µl, was transferred into a 96‐well PCR plate (Bioplastics, Landgraaf, NL, USA). The DNA was extracted by magnetic beads using the Agowa DNA extraction kit (http://www.lgc.co.uk/) according to the protocol supplied by the manufacturer. The supernatant, containing the DNA, was stored at −20°C.
qPCR analysis was performed as described by Haarman and Knol (2005). Finally, the qPCR data were visualized using TIGR MeV 3.1 software (http://www.tm4.org/mev.html).
Array design and construction
A genomic library was constructed from seven strains representing seven different Bifidobacterium species as described previously (Boesten et al., 2009) with the difference that the B. pseudolongum library has been replaced by two single strain libraries of B. breve LMG 13208T (BRE) and B. catenulatum LMG 11043T (CAT). These strains were obtained from the Belgian Co‐ordinated Collections of Microorganisms (BCCM), Gent, B. In total this microarray contains four different libraries. The libraries of BRE and CAT were constructed from genomic material and contain 2000 clones, which represent about 85% (calculated according to Akopyants et al., 2001) of the genomes. Except for the fragmentation of the total DNA of B. catenulatum, the construction of the BRE and the CAT libraries was performed as previously described in Boesten and colleagues (2009). The B. catenulatum DNA was fragmentized by blunt‐ended partial digestion using HaeIII (New England Biolabs, Westburg BV, Leusden, NL, USA). A volume of 10 µl total DNA (∼600 ng µl−1) was combined with 9 µl reaction buffer 2 (New England Biolabs, Westburg BV), 1 µl HaeIII, and 80 µl milli Q water and subsequently incubated at 37°C for 20 min. After incubation the DNA samples were loaded in 1.5% agarose/1× TAE gel. Samples sized from 1 to 2 kb were isolated from gel during electrophoresis using Takara Recochips (TaKaRa Bio, Lonza Verviers, Verviers, BE, USA) according to the protocol provided by the supplier. Due to the blunt‐end restriction of HaeIII, end‐repair as described in Boesten and colleagues (2009) was not necessary.
Fluorescent labelling and hybridization
Total DNA samples were labelled by random prime labelling. A volume of 1 µl DNA sample was diluted in 4.25 µl H2O and mixed with 5 µl of 2.5× random primer (BioPrime Kit, Invitrogen, Breda, NL, USA). The mixture was incubated at 96°C for 5 min. After cooling on ice, the samples were shortly centrifuged at maximum speed in an eppendorf centrifuge. Subsequently, the following components were added while the samples were kept in ice: 0.25 µl 50× AminoAcid‐dNTP mix (AA‐dNTP) (Invitrogen), 1.75 µl milliQ and 0.25 µl Klenow fragment (Invitrogen). After addition the samples were incubated at 37°C for 1.5 h for amplification. Unincorporated aa‐dUTP and free amines were removed using QIAqiuck columns following the protocol described by the supplier (QIAgen Benelux BS, Venlo, NL, USA). For this purpose, five times the reaction volume of PB buffer (QIAgen supplied) was added to the samples and the mixture was transferred to a QIAqiuck Spin Column that was centrifuged at 20 000 g for 1 min. To increase the binding efficiency, the flow‐through was reloaded and the column was centrifuged again at 20 000 g for 1 min and the flow through was discarded. To elute the DNA samples from the columns they were first washed separately with 500 µl of 80% ethanol and then eluted with 30 µl of milliQ H2O, a step that was repeated twice as described by the manufacturer (Qiagen Benelux BS, Venlo, NL, USA). The elutate was dried at high temperature in a speed vac for about 15–30 min. For coupling of the Cy Dye Esters to the aa‐cDNA, the dried cDNA samples were dissolved in 4.5 µl 0.1 M sodium carbonate buffer (Na2CO3), pH 9.0 during 10 min at room temperature while mixed a few times. Subsequently, 4.5 µl of the appropriate NHS‐ester Cy Dye (Amersham, Piscataway, USA) was added. This reaction mix was incubated for 1 h at room temperature in the dark. After incubation 10 µl of milliQ H2O was added and the samples were centrifuged shortly. To remove the unincorporated dyes we used Autoseq G50 (Amersham, Piscataway, USA) columns according to the protocol supplied by the manufacturer.
DNA microarrays were prehybridized for 45 min at 42°C in prehybridization solution (1% bovine serum albumin, 5× SSC and 0.1% SDS). Co‐hybridizations of labelled DNA samples were performed overnight at 42°C in 40 µl Easyhyb buffer (Roche, Almere, NL, USA) according to the manufacturer's protocol. Slides were washed twice in 1× SSC, 0.2% SDS at 37°C, once in 0.5× SSC, and twice in 0.2× SSC at RT and dried with N2‐flow.
Microarray scan‐image and quality analysis were performed as described previously (Boesten et al., 2009).
Diagnostic clone selection, visualization and clustering analysis
For the selection of diagnostic clones we normalized the obtained hybridization data as described previously (Boesten et al., 2009). For each Bifidobacterium species we defined diagnostic clones. A diagnostic clone has a ‘high homology’ classification for a specific Bifidobacterium species and a ‘low homology’ classification for all other species. Due to the genetic variation between species and the different sizes of the libraries printed on the array the numbers of markers vary per species or species group. The number of marker clones for every species or group of species is listed in Table 1.
For visualization of the produced hybridization values, the data were converted into percentages of marker clones that show significant hybridization signals (Boesten et al., 2009). This was performed for every marker group on the microarray (Table 1). The percentages give an indication for the rate of similarity of the genomic DNA fragments for each Bifidobacterium group, present in the total DNA sample isolated from the faecal sample. Finally, these data were visualized using TIGR MeV 3.1 software (http://www.tm4.org/mev.html).
The hierarchical clustering of untreated Cy5 signal intensity data, based on a Pearson correlation, was performed and visualized with TIGR MeV 3.1 software (http://www.tm4.org/mev.html).
Sequencing of DNA fragments
Plasmid isolation, purification of PCR products and high‐throughput sequencing were performed by GATC Biotech AG, Konstanz, Germany (http://www.gatc‐biotech.com). Sequences were compared with public databases by using blastx and blastn. blast analyses were performed against all sequenced genomes in the database using the NCBI website (http://www.ncbi.nlm.nih.gov/).
Acknowledgments
This work was supported by the Dutch Ministry of Economic Affairs through the Innovation Oriented Research Program on Genomics (IOP Genomics: IGE01016). We would like to thank Tiemen van Eijndthoven and Marleen van Nuenen for performing supporting qPCR analyses.
References
- Akopyants N.S., Clifton S.W., Martin J., Pape D., Wylie T., Li L. A survey of the Leishmania major Friedlin strain V1 genome by shotgun sequencing: a resource for DNA microarrays and expression profiling. Mol Biochem Parasitol. 2001;113:337–340. doi: 10.1016/s0166-6851(01)00227-4. et al. [DOI] [PubMed] [Google Scholar]
- Amann R.I., Binder B.J., Olson R.J., Chisholm S.W., Devereux R., Stahl D.A. Combination of 16S rRNA‐targeted oligonucleotide probes with flow cytometry for analyzing mixed microbial populations. Appl Environ Microbiol. 1990;56:1919–1925. doi: 10.1128/aem.56.6.1919-1925.1990. [DOI] [PMC free article] [PubMed] [Google Scholar]
- Amann R.I., Ludwig W., Schleifer K.H. Phylogenetic identification and in situ detection of individual microbial cells without cultivation. Microbiol Mol Biol Rev. 1995;59:143–169. doi: 10.1128/mr.59.1.143-169.1995. [DOI] [PMC free article] [PubMed] [Google Scholar]
- Andersson A.F., Lindberg M., Jakobsson H., Bäckhed F., Nyrén P., Engstrand L. Comparative analysis of human gut microbiota by barcoded pyrosequencing. PLoS ONE. 2008;3:e2836. doi: 10.1371/journal.pone.0002836. [DOI] [PMC free article] [PubMed] [Google Scholar]
- van Baarlen P., Troost F.J., van Hemert S., van der Meer C., de Vos W.M., de Groot P.J. Differential NF‐kappaB pathways induction by Lactobacillus plantarum in the duodenum of healthy humans correlating with immune tolerance. Proc Natl Acad Sci USA. 2009;106:2371–2376. doi: 10.1073/pnas.0809919106. et al. [DOI] [PMC free article] [PubMed] [Google Scholar]
- Bakker‐Zierikzee A., Alles M., Knol J., Kok F., Tolboom J., Bindels J. Effects of infant formula containing a mixture of galacto‐ and fructo‐oligosaccharides or viable Bifidobacterium animalis on the intestinal microflora during the first 4 months of life. Br J Nutr. 2005;94:783–790. doi: 10.1079/bjn20051451. [DOI] [PubMed] [Google Scholar]
- Ben‐Amor K., Heilig H., Smidt H., Vaughan E.E., Abee T., de Vos W.M. Genetic diversity of viable, injured, and dead fecal bacteria assessed by fluorescence‐activated cell sorting and 16S rRNA gene analysis. Appl Environ Microbiol. 2005;71:4679–4689. doi: 10.1128/AEM.71.8.4679-4689.2005. [DOI] [PMC free article] [PubMed] [Google Scholar]
- Benno Y., Sawada K., Mitsuoka T. The intestinal microflora of infants: composition of fecal flora in breast‐fed and bottle‐fed infants. Microbiol Immunol. 1984;28:975–986. doi: 10.1111/j.1348-0421.1984.tb00754.x. [DOI] [PubMed] [Google Scholar]
- Boesten R.J., de Vos W.M. Interactomics in the human intestine: lactobacilli and bifidobacteria make a difference. J Clin Gastroenterol. 2008;42:S163–S167. doi: 10.1097/MCG.0b013e31817dbd62. [DOI] [PubMed] [Google Scholar]
- Boesten R.J., Schuren F.H.J., de Vos W.M. A Bifidobacterium mixed‐species microarray for high resolution discrimination between intestinal bifidobacteria. J Microbiol Methods. 2009;76:269–277. doi: 10.1016/j.mimet.2008.12.006. [DOI] [PubMed] [Google Scholar]
- Claesson M.J., O'Sullivan O., Wang Q., Nikkilä J., Marchesi J.R., Smidt H. Comparative analysis of pyrosequencing and a phylogenetic microarray for exploring microbial community structures in the human distal intestine. PLoS ONE. 2009;4:e6669. doi: 10.1371/journal.pone.0006669. et al. [DOI] [PMC free article] [PubMed] [Google Scholar]
- Collado M., Delgado S., Maldonado A., Rodriguez J. Assessment of the bacterial diversity of breast milk of healthy women by quantitative real‐time PCR. Lett Appl Microbiol. 2009;48:523–528. doi: 10.1111/j.1472-765X.2009.02567.x. [DOI] [PubMed] [Google Scholar]
- Cronin M., Morrissey D., Rajendran S., El Mashad S.M., van Sinderen D., O'Sullivan G.C., Tangney M. Orally administered bifidobacteria as vehicles for delivery of agents to systemic tumors. Mol Ther. 2010;18:1397–1407. doi: 10.1038/mt.2010.59. [DOI] [PMC free article] [PubMed] [Google Scholar]
- Dominguez‐Bello M.G., Costello E.K., Contreras M., Magris M., Hidalgo G., Fierer N., Knight R. Delivery mode shapes the acquisition and structure of the initial microbiota across multiple body habitats in newborns. Proc Natl Acad Sci USA. 2010;107:11971–11975. doi: 10.1073/pnas.1002601107. [DOI] [PMC free article] [PubMed] [Google Scholar]
- Favier C.F., Vaughan E.E., de Vos W.M., Akkermans A.D.L. Molecular monitoring of succession of bacterial communities in human neonates. Appl Environ Microbiol. 2002;68:219–226. doi: 10.1128/AEM.68.1.219-226.2002. [DOI] [PMC free article] [PubMed] [Google Scholar]
- Favier C.F., de Vos W.M., Akkermans A.D.L. Development of bacterial and bifidobacterial communities in feces of newborn babies. Anaerobe. 2003;9:219–229. doi: 10.1016/j.anaerobe.2003.07.001. [DOI] [PubMed] [Google Scholar]
- Gronlund M.M., Gueimonde M., Laitinen K., Kociubinski G., Gronroos T., Salminen S., Isolauri E. Maternal breast‐milk and intestinal bifidobacteria guide the compositional development of the Bifidobacterium microbiota in infants at risk of allergic disease. Clin Exp Allergy. 2007;37:1764–1772. doi: 10.1111/j.1365-2222.2007.02849.x. [DOI] [PubMed] [Google Scholar]
- Gueimonde M., Laitinen K., Salminen S., Isolauri E. Breast milk: a source of bifidobacteria for infant gut development and maturation? Neonatology. 2007;92:64–66. doi: 10.1159/000100088. [DOI] [PubMed] [Google Scholar]
- Haarman M., Knol J. Quantitative real‐time PCR assays to identify and quantify fecal Bifidobacterium species in infants receiving a prebiotic infant formula. Appl Environ Microbiol. 2005;71:2318–2324. doi: 10.1128/AEM.71.5.2318-2324.2005. [DOI] [PMC free article] [PubMed] [Google Scholar]
- Harmsen H., Wildeboer‐Veloo A., Raangs G., Wagendorp A., Klijn N., Bindels J., Welling G. Analysis of intestinal flora development in breast‐fed and formula‐fed infants by using molecular identification and detection methods. J Pediatr Gastroenterol Nutr. 2000;30:61–67. doi: 10.1097/00005176-200001000-00019. [DOI] [PubMed] [Google Scholar]
- He F., Ouwehand A.C., Isolauri E., Hashimoto H., Benno Y., Salminen S. Comparison of mucosal adhesion and species identification of bifidobacteria isolated from healthy and allergic infants. FEMS Immunol Med Microbiol. 2001a;30:43–47. doi: 10.1111/j.1574-695X.2001.tb01548.x. [DOI] [PubMed] [Google Scholar]
- He F., Ouwehand A.C., Isolauri E., Hosoda M., Benno Y., Salminen S. Differences in composition and mucosal adhesion of bifidobacteria isolated from healthy adults and healthy seniors. Curr Opin Microbiol. 2001b;43:351–354. doi: 10.1007/s002840010315. [DOI] [PubMed] [Google Scholar]
- Hooper L., Gordon J. Commensal host‐bacterial relationships in the gut. Science. 2001;292:1115–1118. doi: 10.1126/science.1058709. [DOI] [PubMed] [Google Scholar]
- Hopkins M.J., Macfarlane G.T., Furrie E., Fite A., Macfarlane S. Characterisation of intestinal bacteria in infant stools using real‐time PCR and northern hybridisation analyses. FEMS Microbiol Ecol. 2005;54:77–85. doi: 10.1016/j.femsec.2005.03.001. [DOI] [PubMed] [Google Scholar]
- Kurokawa K., Itoh T., Kuwahara T., Oshima K., Toh H., Toyoda A. Comparative metagenomics revealed commonly enriched gene sets in human gut microbiomes. DNA Res. 2007;14:169–181. doi: 10.1093/dnares/dsm018. et al. [DOI] [PMC free article] [PubMed] [Google Scholar]
- Kwon H., Yang E., Lee S., Yeon S., Kang B., Kim T. Rapid identification of potentially probiotic Bifidobacterium species by multiplex PCR using species‐specific primers based on the region extending from 16S rRNA through 23S rRNA. FEMS Microbiol Lett. 2005;250:55–62. doi: 10.1016/j.femsle.2005.06.041. [DOI] [PubMed] [Google Scholar]
- Leahy S.C., Higgins D.G., Fitzgerald G.F., van Sinderen D. Getting better with bifidobacteria. J Appl Microbiol. 2005;98:1303–1315. doi: 10.1111/j.1365-2672.2005.02600.x. [DOI] [PubMed] [Google Scholar]
- Martín R., Langa S., Reviriego C., Jiménez E., Marin M.L., Olivares M. The commensal microflora of human milk: new perspectives for food bacteriotherapy and probiotics. Trends Food Sci Technol. 2004;15:121–127. et al. [Google Scholar]
- Masco L., Ventura M., Zink R., Huys G., Swings J. Polyphasic taxonomic analysis of Bifidobacterium animalis and Bifidobacterium lactis reveals relatedness at the subspecies level: reclassification of Bifidobacterium animalis as Bifidobacterium animalis subsp. animalis subsp. nov. and Bifidobacterium lactis as Bifidobacterium animalis subsp. lactis subsp. nov. Int J Syst Evol Microbiol. 2004;54:1137–1143. doi: 10.1099/ijs.0.03011-0. [DOI] [PubMed] [Google Scholar]
- Matsuki T., Watanabe K., Tanaka R., Oyaizu H. Rapid identification of human intestinal bifidobacteria by 16S rRNA‐targeted species‐ and group‐specific primers. FEMS Microbiol Lett. 1998;167:113–121. doi: 10.1111/j.1574-6968.1998.tb13216.x. [DOI] [PubMed] [Google Scholar]
- Matsuki T., Watanabe K., Tanaka R., Fukuda M., Oyaizu H. Distribution of bifidobacterial species in human intestinal microflora examined with 16S rRNA‐gene‐targeted species‐specific primers. Appl Environ Microbiol. 1999;65:4506–4512. doi: 10.1128/aem.65.10.4506-4512.1999. [DOI] [PMC free article] [PubMed] [Google Scholar]
- Meile L., Ludwig W., Rueger U., Gut C., Kaufmann P., Dasen G. Bifidobacterium lactis sp. nov., a moderately oxygen tolerant species isolated from fermented milk. Syst Appl Microbiol. 1997;20:57–64. et al. [Google Scholar]
- Moter A., Gobel U. Fluorescence in situ hybridization (FISH) for direct visualization of microorganisms. J Microbiol Methods. 2000;41:85–112. doi: 10.1016/s0167-7012(00)00152-4. [DOI] [PubMed] [Google Scholar]
- Nagashima K., Hisada T., Sato M., Mochizuki J. Application of new primer‐enzyme combinations to terminal restriction fragment length polymorphism profiling of bacterial populations in human feces. Appl Environ Microbiol. 2003;69:1251–1262. doi: 10.1128/AEM.69.2.1251-1262.2003. [DOI] [PMC free article] [PubMed] [Google Scholar]
- O'Hara A., Shanahan F. The gut flora as a forgotten organ. EMBO Rep. 2006;7:688–693. doi: 10.1038/sj.embor.7400731. [DOI] [PMC free article] [PubMed] [Google Scholar]
- Orla‐Jensen S. La classification des bactéries lactiques. Lait. 1924;4:468–474. [Google Scholar]
- Ouwehand A.C., Derrien M., de Vos W.M., Tiihonen K., Rautonen N. Prebiotics and other microbial substrates for gut functionality. Curr Opin Biotechnol. 2005;16:212–217. doi: 10.1016/j.copbio.2005.01.007. [DOI] [PubMed] [Google Scholar]
- Palmer C., Bik E., DiGiulio D., Relman D.A., Brown P. Development of the human infant intestinal microbiota. PLoS Biol. 2007;5:e177. doi: 10.1371/journal.pbio.0050177. [DOI] [PMC free article] [PubMed] [Google Scholar]
- Penders J., Vink C., Driessen C., London N., Thijs C., Stobberingh E.E. Quantification of Bifidobacterium spp., Escherichia coli and Clostridium difficile in faecal samples of breast‐fed and formula‐fed infants by real‐time PCR. FEMS Microbiol Lett. 2005;243:141–147. doi: 10.1016/j.femsle.2004.11.052. [DOI] [PubMed] [Google Scholar]
- Penders J., Thijs C., Vink C., Stelma F.F., Snijders B., Kummeling I. Factors influencing the composition of the intestinal microbiota in early infancy. Pediatrics. 2006;118:511–521. doi: 10.1542/peds.2005-2824. et al. [DOI] [PubMed] [Google Scholar]
- Perez P.F., Dore J., Leclerc M., Levenez F., Benyacoub J., Serrant P. Bacterial imprinting of the neonatal immune system: lessons from maternal cells? Pediatrics. 2007;119:e724–e732. doi: 10.1542/peds.2006-1649. et al. [DOI] [PubMed] [Google Scholar]
- Qin J., Li R., Raes J., Arumugam M., Burgdorf K.S., Manichanh C. A human gut microbial gene catalogue established by metagenomic sequencing. Nature. 2010;464:59–65. doi: 10.1038/nature08821. et al. [DOI] [PMC free article] [PubMed] [Google Scholar]
- Rajilic‐Stojanovic M., Heilig H.G.H.J., Molenaar D., Kajander K., Surakka A., Smidt H., de Vos W.M. Development and application of the human intestinal tract chip, a phylogenetic microarray: analysis of universally conserved phylotypes in the abundant microbiota of young and elderly adults. Environ Microbiol. 2009;11:1736–1751. doi: 10.1111/j.1462-2920.2009.01900.x. [DOI] [PMC free article] [PubMed] [Google Scholar]
- Reuter G. Vergleichende untersuchungen über die Bifidus‐Flora im säuglings‐ und erwachsenenstuhl. Zentrabl Bakteriol [Orig A] 1963;1:286–507. [PubMed] [Google Scholar]
- Sakata S., Kitahara M., Sakamoto M., Hayashi H., Fukuyama M., Benno Y. Unification of Bifidobacterium infantis and Bifidobacterium suis as Bifidobacterium longum. Int J Syst Evol Microbiol. 2002;52:1945–1951. doi: 10.1099/00207713-52-6-1945. [DOI] [PubMed] [Google Scholar]
- Salonen A., Nikkila J., Jalanka‐Tuovinen J., Immonen O., Rajilic‐Stojanovic M., Kekkonen R.A. Comparative analysis of fecal DNA extraction methods with phylogenetic microarray: effective recovery of bacterial and archaeal DNA using mechanical cell lysis. J Microbiol Methods. 2010;81:127–134. doi: 10.1016/j.mimet.2010.02.007. et al. [DOI] [PubMed] [Google Scholar]
- Satokari R., Grönroos T., Laitinen K., Salminen S., Isolauri E. Bifidobacterium and Lactobacillus DNA in the human placenta. Lett Appl Microbiol. 2009;48:8–12. doi: 10.1111/j.1472-765X.2008.02475.x. [DOI] [PubMed] [Google Scholar]
- Saxelin M., Tynkkynen S., Mattila‐Sandholm T., de Vos W.M. Probiotic and other functional microbes: from markets to mechanisms. Curr Opin Biotechnol. 2005;16:204–211. doi: 10.1016/j.copbio.2005.02.003. [DOI] [PubMed] [Google Scholar]
- Scardovi V., Crociani F. Bifidobacterium catenulatum, Bifidobacterium dentium, and Bifidobacterium angulatum: three new species and their deoxyribonucleic acid homology relationships. Int J Syst Bacteriol. 1974;24:21–28. [Google Scholar]
- Scardovi V., Zani G., Trovatelli L. Deoxyribonucleic acid homology among the species of the genus Bifidobacterium isolated from animals. Arch Mikrobiol. 1970;72:318–325. doi: 10.1007/BF00409030. [DOI] [PubMed] [Google Scholar]
- Schell M.A., Karmirantzou M., Snel B., Vilanova D., Berger B., Pessi G. The genome sequence of Bifidobacterium longum reflects its adaption to the human gastrointestinal tract. Proc Natl Acad Sci USA. 2002;99:14422–14427. doi: 10.1073/pnas.212527599. et al. [DOI] [PMC free article] [PubMed] [Google Scholar]
- Tap J., Mondot S., Levenez F., Pelletier E., Caron C., Furet J. Towards the human intestinal microbiota phylogenetic core. Environ Microbiol. 2009;11:2574–2584. doi: 10.1111/j.1462-2920.2009.01982.x. et al. [DOI] [PubMed] [Google Scholar]
- Turnbaugh P.J., Hamady M., Yatsunenko T., Cantarel B.L., Duncan A., Ley R.E. A core gut microbiome in obese and lean twins. Nature. 2009;457:480–484. doi: 10.1038/nature07540. et al. [DOI] [PMC free article] [PubMed] [Google Scholar]
- Turroni F., Foroni E., Pizzetti P., Giubellini V., Ribbera A., Merusi P. Exploring the diversity of the bifidobacterial population in the human intestinal tract. Appl Environ Microbiol. 2009a;75:1534–1545. doi: 10.1128/AEM.02216-08. et al. [DOI] [PMC free article] [PubMed] [Google Scholar]
- Turroni F., Marchesi J.R., Foroni E., Gueimonde M., Shanahan F., Margolles A. Microbiomic analysis of the bifidobacterial population in the human distal gut. ISME J. 2009b;3:745–751. doi: 10.1038/ismej.2009.19. et al. [DOI] [PubMed] [Google Scholar]
- Vaughan E.E., Heilig H.G.H.J., Ben‐Amor K., de Vos W.M. Diversity, vitality and activities of intestinal lactic acid bacteria and bifidobacteria assessed by molecular approaches. FEMS Microbiol Rev. 2005;29:277–490. doi: 10.1016/j.femsre.2005.04.009. [DOI] [PubMed] [Google Scholar]
- Ventura M., O'Flaherty S., Claesson M.J., Turroni F., Klaenhammer T.R., van Sinderen D., O'Toole P.W. Genome‐scale analyses of health‐promoting bacteria: probiogenomics. Nat Rev Microbiol. 2009;7:61–71. doi: 10.1038/nrmicro2047. [DOI] [PubMed] [Google Scholar]
- Yaeshima T., Fujisawa T., Mitsuoka T. Bifidobacterium globosum, subjective synomym of Bifidobacterium pseudolongum, and description of Bifidoacterium pseudologum subsp. pseudolongum comb. nov. and Bifidobacterium pseudolongum subsp. globosum comb. nov. Syst Appl Microbiol. 1992;15:280–385. [Google Scholar]
- Zoetendal E., Rajilic‐Stojanovic M., de Vos W.M. High‐throughput diversity and functionality analysis of the gastrointestinal tract microbiota. Gut. 2008;57:1605–1615. doi: 10.1136/gut.2007.133603. [DOI] [PubMed] [Google Scholar]
- Zoetendal E.G., Akkermans A.D., de Vos W.M. Temperature gradient gel electrophoresis analysis of 16S rRNA from human fecal samples reveals stable and host‐specific communities of active bacteria. Appl Environ Microbiol. 1998;64:3854–3859. doi: 10.1128/aem.64.10.3854-3859.1998. [DOI] [PMC free article] [PubMed] [Google Scholar]