

Abstract
Mild cognitive impairment in Parkinson's disease (PD) is heterogeneous in regard to affected domains. Although patterns of cognitive performance that may predict later dementia are as yet undetermined, posterior-versus frontal-type assessments show promise for differential predictive value. The present study included 70 individuals: 42 with idiopathic PD without dementia and 28 age- and education-matched healthy control adults (HC). Participants completed assessments of cognition with emphasis on tests that are sensitive to frontal and posterior deficits. PD patients were classified into cognitive subgroups and the subgroups were compared on demographic and disease variables. Individual performance across neuropsychological tests was evaluated for the PD group. Patients with PD performed more poorly than HC on several measures of cognition, and they were classified into frontal (12), posterior (3), both (10) and neither subgroups (17), the latter two in reference to frontal- and posterior-type deficits. The neither subgroup was distinguished by less motor impairment than the both subgroup, but the four subgroups did not otherwise differ on demographic or disease variables. Across patients, the tests most sensitive to cognitive impairment included measures of attention and executive functioning (frontal-type tests). Examination of individual test performance for PD revealed substantial heterogeneity across tests with respect to number and severity of deficits. The current study provides insight into which commonly used neuropsychological tests are most sensitive to cognitive deficits (strictly defined) in a nondemented, well characterized PD sample, and into the relation of cognitive subgroups to demographic and disease-specific variables.
Keywords: Parkinson's, cognition, subtypes, frontal, parietal, posterior
Cognitive impairment significantly impacts daily functioning and quality of life for many individuals with Parkinson's disease (PD), and its accurate description is currently a topic of great interest (Aarsland, Bronnick, & Fladby, 2011; Dalrymple–Alford et al., 2011; Dalrymple–Alford et al., 2010; Litvan et al., 2012; Martinez–Horta & Kulisevsky, 2011). Particular cognitive domains have been explored to greater and lesser extents in regard to their impairment in PD. There is a long history of research revealing frontally based deficits (Baddeley & Della Sala, 1996), whereas more recent studies have highlighted impairments in visuospatial functions supported by the parietal lobes (Amick, Schendan, Ganis, & Cronin–Golomb, 2006; Cronin–Golomb, 2010; Davidsdottir, Wagenaar, Young, & Cronin–Golomb, 2008; Schendan, Amick, & Cronin–Golomb, 2009). Visual and verbal long-term memory, which rely in part on the temporal lobes, have also been noted to be affected in PD (Amick, Grace, & Chou, 2006; Ibarretxe–Bilbao, Junque, Marti, & Tolosa, 2011). In a shift from earlier literature, it has been suggested that cognitive dysfunction reflecting posterior (parietal-temporal) brain dysfunction, rather than frontal dysfunction, is predictive of later PD dementia (Williams–Gray et al., 2009; Williams–Gray, Foltynie, Brayne, Robbins, & Barker, 2007).
Imaging studies indicate possible frontal and posterior cortical subtypes of PD, with some evidence of posterior areas becoming more important in later stages of the disease (Paschali et al., 2010). Frontostriatal deficits have been related to decreased dopamine levels, whereas posterior-cortical deficits have been correlated with degeneration of cholinergic fibers (Pagonabarraga & Kulisevsky, 2012). Reductions in cortical gray matter in posterior temporal and parietal regions have also been reported in PD, and have been correlated with visuospatial performance (Pereira et al., 2009). In a single-photon emission tomography study, nondemented PD patients, and to a much greater extent PD patients with dementia, exhibited decreased perfusion in parietal regions, leading the researchers to propose that this sign may be an early marker of PD dementia (Firbank, Colloby, Burn, McKeith, & O'Brien, 2003).
Williams–Gray and colleagues suggested that there are distinct profiles of PD based on type of cognitive deficit (Williams–Gray et al., 2009; Williams–Gray et al., 2007). These investigators showed that frontostriatal deficits, as described by performance on a phonemic verbal fluency task and the Tower of London test of executive dysfunction, were the most common type of cognitive impairment among PD individuals without dementia. After 5 years, deficits in performance on a test of semantic verbal fluency and on copying a drawing of intersecting pentagons, both reflecting what they described as posterior cortex dysfunction, were significantly predictive of dementia, whereas frontostriatal deficits were not (Williams–Gray et al., 2009). These authors cautioned against relying too heavily on a binary description of these subtypes of tests, because many commonly used tasks rely on networks of multiple brain regions. Williams–Gray and colleagues used a cut-off criterion of one standard deviation (SD) below normative data for most tests and did not directly compare their PD group to a control group.
A methodological issue in examining cognitive status in PD is the definition of the cut-off score that serves as the criterion for a deficit. An analysis of deficit cut-off scores by Dalrymple–Alford and colleagues showed that 1.5 SD below the normative score on two or more tests within a cognitive domain or on one test from each of two different domains were best at identifying PD with mild cognitive impairment (MCI) and minimizing MCI categorization for cognitively intact participants (Dalrymple–Alford et al., 2011). The eventual goal of this line of research is to identify those PD patients at increased risk for progressive cognitive decline and dementia, with the aim of implementing clinical interventions at the earliest possible stage.
The Movement Disorders Society recently called upon investigators to focus on comprehensive cognitive assessments and specific neuropsychological deficits in order to elucidate the nature of cognitive dysfunction and decline in PD (Litvan et al., 2011; Litvan et al., 2012). Dementia in PD is associated with increased disability and mortality and reduced quality of life (Aarsland & Kurz, 2010), and the ability to plan ahead and to attempt early intervention could greatly impact patient care. If neuropsychological patterns of deficits in PD are indicative of prognosis for decline, this type of assessment could be used early in the disease course to predict later cognitive decline.
The present study examined nondemented PD and healthy control participants (HC) on a larger number of tests of cognition than are usually administered, and that rely on frontal- and posterior-type networks. The primary goal was to evaluate the nature of the frontal versus posterior subtyping. We determined the degree of PD-related cognitive deficits on these measures using a strict definition of impairment of performance relative to the performance of HC, which is not regularly done in studies of PD cognition. The second goal was to examine cognitive performance within individual PD participants. We hypothesized that PD patients would perform more poorly than HC. In regard to categorization of patients into cognitive-deficit subgroups based on performance of the frontal- and posterior-type tests, we expected that more patients would exhibit frontal-type than posterior-type deficits, as found by Williams–Gray and colleagues using a less strict criterion. Examining group and individual neuropsychological profiles on frontal- and posterior-type measures may provide further information about the PD participants who are classified into neuropsychological deficit subgroups, with implications for tests that could be used to identify early cognitive change.
Methods
Participants
There were 70 individuals in this study: 42 patients with idiopathic PD (21 women, 21 men) and 28 age- and education-matched HC adults (14 women, 14 men; see Table 1). The study protocol was approved by the Boston University Institutional Review Board, with consent obtained according to the Declaration of Helsinki.
Table 1.
Participant Characteristics
| PD participants (N = 42) | HC participants (N = 28) | |
|---|---|---|
| Age | 64.8 (7.7) | 63.9 (8.6) |
| Education | 17.3 (2.1) | 17.3 (1.8) |
| Male: female | 21:21 | 14:14 |
| UPDRS motor score | 20.1 (9.1) | NA |
| PD duration | 6.7 (4.1) | NA |
| Hoehn & Yahr median (range) | 2.0 (1–3) | NA |
| LED | 356.5 (246.0) | NA |
Note. LED = Levodopa equivalent dosage; HC = healthy controls; PD = Parkinson's disease; UPDRS = Unified Parkinson's Disease Rating Scale. All values are mean (SD) unless noted.
Patients with PD were referred from the Parkinson's Disease Center of Boston Medical Center and local support groups, and included patients who met the clinical criteria for mild to moderate PD: Hoehn and Yahr stages I-III (Hoehn & Yahr, 1967). Diagnoses were made by patients' neurologists, using United Kingdom Parkinson's Disease Society Brain Bank clinical diagnostic criteria (Hughes, Daniel, Kilford, & Lees, 1992). The HC were recruited from the general community. Exclusion criteria included coexisting serious chronic illness (including psychiatric or neurological), use of psychoactive medications besides antidepressants and anxiolytics in the PD group, which are commonly prescribed; use of any psychoactive medication in the HC group; history of intracranial surgery, traumatic brain injury, alcoholism or other drug abuse; and visual acuity poorer than 20/40. Participants were not demented as indicated by scores on the modified form on the Mini-Mental State Examination (mMMSE; Stern, Sano, Paulson, & Mayeux, 1987), as described in previous studies (Appleman, Stavitsky, & Cronin–Golomb, 2011; Seichepine et al., 2011). Motor disability was rated with the Unified Parkinson's Disease Rating Scale (UPDRS; Fahn & Elton, 1987), using a total score calculated from the motor section (sum of items 18–44). Psychomotor speed was assessed with the Purdue Pegboard test (Purdue, 1948), using the average number of pegs placed bilaterally.
The majority of patients reported using dopamine agonists (N = 29, 69%) and/or levodopa (N = 26, 62%). Twenty-six (62%) used monamine oxidase inhibitors and/or catechol-O-methyltransferase inhibitors and 9 (21%) used amantadine and/or anticholinergic agents. Eleven (26%) reported using antidepressant or antianxiety medications. Levodopa equivalent dosages (LED) were calculated based on previous reports with LED (Gjerstad, Boeve, Wentzel–Larsen, Aarsland, & Larsen, 2008). All patients were tested in their “on” medication state.
Measures and Procedures
Participants completed a detailed cognitive assessment as described below. We compared performance between PD and HC, and we examined within-individual test performance on variables from all assessments administered. Because there were differences in the proportion of men to women across groups and because some studies find gender differences on cognitive tasks (Miller & Cronin–Golomb, 2010), within-group gender comparisons were conducted. No gender differences were found for either group, and accordingly the data were combined for group analyses. The PD patients were categorized into cognitive deficit subgroups based on performance on a selection of the frontal-type and posterior-type measures that identified the greatest percentage of deficit among the PD patients. Definition of frontal- and posterior-type measures was consistent with that of Williams–Gray and colleagues, with posterior tests defined as those implicating areas and networks posterior to the frontal lobes. Raw scores, total correct, were used unless otherwise indicated.
Cognitive Assessment
Five frontal-type and six posterior-type tests were administered. Tests that have been shown to rely on frontal or posterior regions either in lesion studies or imaging studies were selected (Ibarretxe–Bilbao et al., 2011; Lezak, Howieson, Loring, Hannay, & Fischer, 2004).
Frontal-Type Tests
The Stroop Color–Word task (Stroop, 1935; executive functioning)
Participants named the colors of xxxx's (Stroop Color), read color words (in black ink; Stroop Word), and named the color of ink in which incongruent ink/color words were written (Stroop Color–Word), each as quickly as possible.
The Delis–Kaplan Executive Functioning Systems (D-KEFS) Verbal Fluency task (Delis, Kaplan, & Kramer, 2001)
Phonemic and Switching verbal fluency): Participants named as many words beginning with the letters F, A, and S and as many alternating fruits and pieces of furniture as possible, each in 1-min trials.
The Digit Span subtest from the Wechsler Memory Scale III (Wechsler, 1997; attention [Forward and Backward conditions] and working memory [Backward condition])
Participants first repeated and then reversed verbally presented digit sequences.
The Trail Making Test (Tombaugh, 2004; attention, set-shifting, and executive function)
Participants quickly drew lines connecting numbers in order for Condition A (attention). For Condition B, participants quickly drew lines alternating between numbers and letters in order (set-shifting, executive function). Completion time for Trails A and Trails B were used for analysis.
The Ruff Figural Fluency Test (Ruff, Light, & Evans, 1987; nonverbal fluency)
Participants connected dots to draw unique designs in five trials of 60 s each. Number of total unique designs was used for analysis.
Posterior-Type Tests
The Cube and Pentagon Copying tasks from the mMMSE (visuospatial and visuomotor abilities)
Participants copied a three-dimensional cube and two overlapping pentagons. Scoring systems previously applied to PD by Maeshima and colleagues (cube) (Maeshima, Itakura, Nakagawa, Nakai, & Komai, 1997; Maeshima et al., 2004) and Jefferson and colleagues (pentagon; Jefferson et al., 2002) were used to obtain a total score for each.
The D-KEFS Verbal Fluency task (Delis et al., 2001; semantic fluency)
Participants named as many animals as possible in 1 min.
The Landmark Line Bisection task (Davidsdottir et al., 2008; Lee, Harris, Atkinson, & Fowler, 2001; spatial perception without motor demands)
Participants viewed a computerized horizontal line crossed by a moving vertical mark, and indicated when the mark reached the perceived center of the line. The average of the absolute value of 10 trials was used for analysis.
Visual Dependence task (Azulay, Mesure, Amblard, & Pouget, 2002; Danta & Hilton, 1975; Davidsdottir et al., 2008; visual dependence without motor demands)
Participants viewed a computerized rotating rod and indicated when the rod reached horizontal. The average of 10 trials was used for analysis.
The Delayed condition from the Rey Auditory Verbal Learning Test (RAVLT) (Rey, 1964; delayed memory)
Participants recalled as many words as possible from a previously learned list after a 20-min delay.
Subtyping by Type of Cognitive Deficit
Means and SD were calculated for HC for frontal- and posterior-type tests. The PD scores were compared to these scores, and any PD whose score fell 1.5 SD below the HC mean was considered to have a deficit on that task. Five variables from each category (frontal-, posterior-type) that identified the greatest percentage of cognitive deficit in PD were used for subtyping. Patients with deficits on two or more frontal-type tasks were categorized as having a frontal deficit. If they had deficits on two or more posterior-type tasks, they were categorized as having a posterior deficit. Four groups were established: frontal deficit only, posterior deficit only, frontal and posterior deficit (both), and neither.
Statistical Analyses
Independent groups t tests were performed to compare the effect of group (HC, PD) on neuropsychological test performance. Because we examined a number of frontal- and posterior-type tests, some of which were intercorrelated, a conservative alpha of .01 was used to assess significance. Nonparametric statistics (Mann–Whitney U tests) were used for comparisons when the sample size was small. As the data reflect the results of an ongoing study on PD and cognition, some participants were not administered all tests.
Results
Comparison of HC and PD Cognition
The HC significantly outperformed PD on most variables (see Table 2), including both conditions of the Trail Making Test, A: t(65) = 5.44, p < .001; B: t(60) = 4.56, p < .001, all conditions of the Stroop Tests, Color: t(55) = 3.07, p < .01; Word: t(68) = 5.32, p < .001; Color-Word: t(67) = 2.79, p < .01, Digit Span Backward, t(65) = 2.98, p < .01, Phonemic Fluency, t(48) = 6.76, p < .001 Ruff Figural Fluency, t(66) = 3.03, p < .01, Line Bisection, t(66) = 2.63, p < .01 and Visual Dependence, t(68) = 2.50, p < .01 (see Figure 1). There were trends toward group differences with HC outperforming PD on Digit Span Forward, t(65) = 1.62, p = .06, Cube Copy, t(67) = 1.6, p = .06, Switching Fluency, t(46) = 2.04, p = .03 and RAVLT Delay, t(46) = 1.68, p = .05. Groups were not significantly different on Semantic Fluency, t(66) = 1.16, p = .13 or Pentagon Copy, t(54) = 0.48, p = .32. The HC also significantly outperformed PD on bilateral performance of the Purdue Pegboard test, the screening measure of psychomotor speed, t(68) = 5.31, p < .001.
Table 2.
Comparison of HC and PD Cognitive Performance
| Test name | PD (#) | HC (#) | PD, mean (SD) | HC, mean (SD) | PD-HC significant difference (1-tailed p-value) | # of PD with deficits | % of PD with deficits |
|---|---|---|---|---|---|---|---|
| Frontal-type tests | |||||||
| Phonemic Fluency | 42 | 28 | 39.6 (8.1) | 55.4 (10.4) | <.001 | 22 | 52% |
| Trails A time (sec) | 42 | 28 | 34.3 (9.8) | 24.5 (5.1) | <.001 | 21 | 50% |
| Stroop Word | 42 | 28 | 87.5 (13.4) | 106.4 (16.2) | <.001 | 18 | 43% |
| Trails B time (sec) | 42 | 28 | 86.8 (41.2) | 54.1 (17.6) | <.001 | 15 | 36% |
| Ruff Unique Designs | 40 | 28 | 79.2 (20.0) | 93.9 (19.0) | <.01 | 11 | 28% |
| Switching Fluency | 25 | 23 | 12.7 (3.1) | 14.5 (3.0) | <.05 | 7 | 28% |
| Stroop Color-Word | 41 | 28 | 34.2 (10.6) | 41.0 (9.2) | <.01 | 10 | 24% |
| Stroop Color | 42 | 28 | 62.1 (11.5) | 71.1 (12.4) | <.01 | 7 | 17% |
| Digit Span Backward | 41 | 26 | 7.6 (2.5) | 9.7 (3.1) | <.01 | 6 | 15% |
| Digit Span Forward | 41 | 26 | 10.8 (2.4) | 11.8 (2.3) | .06 | 6 | 15% |
| Posterior-type tests | |||||||
| Line Bisection | 42 | 28 | 1.3 (.62) | 1.0 (.34) | <.01 | 14 | 33% |
| mMMSE Cube Copy | 42 | 27 | 6.0 (1.3) | 6.5 (.94) | .06 | 13 | 31% |
| mMMSE Pentagon Copy | 31 | 25 | 6.9 (.89) | 7.0 (.68) | .32 | 9 | 30% |
| Visual Dependence | 42 | 28 | .53 (.46) | .29 (.25) | <.01 | 10 | 24% |
| Semantic Fluency | 40 | 28 | 21.8 (5.7) | 23.5 (6.0) | .13 | 4 | 13% |
| RAVLT Delay | 25 | 23 | 8.2 (3.3) | 9.9 (3.6) | .05 | 3 | 12% |
Note. mMMSE = Modified Mini-Mental State Examination; RAVLT Delay = Rey Auditory Verbal Learning Test, Delayed Condition; Visual Dependence = mean deviation from horizontal (/10 trials); Line Bisection = absolute mean % deviation from center of line (/10 trials). Test variables are listed in descending order based on percentage of PD deficit. Mean (SD) total score unless indicated otherwise.
Figure 1.
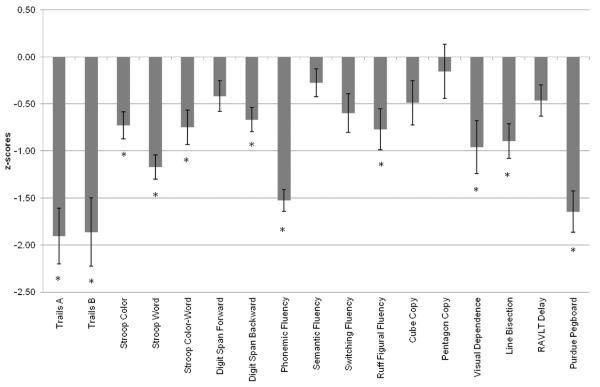
PD performance across neuropsychological tests, as compared with HC performance (HC z-scores = 0).
Individual Performance Across Tests
Deficits at 1.5 SD below the HC mean were calculated for all PD for each test variable. Table 2 lists the number and percentage of deficits in the PD group for all test variables examined. Phonemic Fluency (52%) identified the most deficits for PD, and RAVLT Delay (12%) showed the least. Figure 2 displays PD deficits across tests. The number and severity of deficits based on z-scores is depicted for each individual. Number of deficits across all test variables examined ranged from zero (two individuals) to 12 (two individuals). Severity of deficit on all test variables ranged from no deficit to nearly 11 SD below the HC mean (for one participant on Trail Making B).
Figure 2.

Cognitive Performance for Individual PD Participants. TrA: Trail Making A completion time; TrB: Trail Making B completion time; StC: Stroop Color; StW: Stroop Word; StCW: Stroop Color-Word; DSF: Digit Span – Forward; DSB: Digit Span Backward; PhF: Phonemic Fluency; SwF: Switching Fluency; Ruff: Ruff Figural Fluency; Cube: Cube Copy; Pent: Pentagon Copy; SeF: Semantic Fluency; VsD: Visual Dependence; LnB: Line Bisection; RvD: RAVLT Delay.
Classification into Cognitive Subgroups
Each individual with PD was classified into the frontal, posterior, both, and neither cognitive subgroups as described above, based on the five tests from each category that showed the largest percentage of deficit for the PD group. Frontal-type tests included Phonemic Fluency, Trail Making Test A, Stroop Word, Trail Making Test B, and Ruff Figural Fluency. Posterior-type tests included Line Bisection, Cube Copy, Pentagon Copy, Visual Dependence, and Semantic Fluency. This categorization described 12 individuals with frontal deficit (scores 1.5 SD below the NC mean on two or more frontal tasks), three with posterior deficit (scores 1.5 SD below the NC mean on two or more posterior tasks), 10 both (scores 1.5 SD below the NC mean on two or more frontal tasks and two or more posterior tasks), and 17 neither (scores that did not meet criteria for a deficit subgroup: deficits that did not meet the level (>1.5 SC below the NC mean, or number [two deficits within a domain] criteria; Figure 2 and Table 3). Of those classified as neither, 12 exhibited deficits at a subthreshold level: Nine had one frontal-test deficit, none had a posterior deficit, and three had one deficit in each category.
Table 3.
Comparison of Deficit Groups
| Frontal (N = 12) | Posterior (N = 3) | Both (N = 10) | Neither (N = 17) | |
|---|---|---|---|---|
| Age | 65.2 (7.6) | 63.7 (8.5) | 68.0 (8.4) | 62.8 (7.3) |
| Education | 16.7 (1.4) | 19.7 (1.5) | 15.8 (2.2) | 18.2 (1.9) |
| Male: Female | 6:6 | 2:1 | 5:5 | 8:9 |
| PD duration | 6.0 (2.7) | 5.0 (2.0) | 8.1 (4.0) | 6.6 (5.1) |
| H&Y median (range) | 2 (1.5–2.5) | 1.5 (1–3) | 2 (1.5–3) | 2 (1–3) |
| UPDRS motor | 21.2 (8.5) | 19.7 (10.3) | 27.8 (9.5)* | 15.0 (5.8) |
| LED | 471.3 (301.1) | 226.1 (35.5) | 515.5 (189.3) | 285.0 (205.8) |
Note. H&Y = Hoehn and Yahr staging; UPDRS = Unified Parkinson's Disease Rating Scale; LED = Levodopa equivalent dosage.
Significant difference between both and neither, p < .01.
We then compared the frontal, both, and neither deficit subgroups on demographic and disease characteristics (see Table 3) of age, education, UPDRS motor score, disease duration, and LED. The number of individuals in the posterior subgroup was too small for statistical analysis. The neither subgroup had significantly lower (less impaired) UPDRS motor scores (p < .01) than did the both subgroup, but otherwise did not differ on demographic or disease-related variables. There were no significant differences between frontal and both or between frontal and neither on any demographic or disease characteristic. There were trends toward group differences between frontal and neither on education (p = .031, neither higher educated than frontal) and UPDRS motor score (p = .046, frontal more severe motor scores than neither), and between both and neither on education (p = .015, neither higher educated than both) and LED (p = .056, both with higher medication doses than neither).
Discussion
The nondemented PD patients in this study performed more poorly than HC on several measures of cognition, and they fell into cognitive deficit-based groups. These results supported our hypotheses that PD would perform more poorly than HC and that more patients would exhibit frontal-type than posterior-type deficits. Our results are consistent with the literature on cognitive performance in PD. We found that some tests (Trail Making, Phonemic Fluency) were better at identifying specific deficits than others (Semantic Fluency, RAVLT Delay). Examination of individual test performance for PD across all measures administered, not just those used for categorization, revealed substantial heterogeneity in cognitive performance across tests with respect to number and severity of deficits even within categorization groups (see Figure 2).
Using the five tests from each category that were most sensitive to deficits, we categorized PD into subgroups based on type of deficit. We found that although a number of individuals had a single (frontal) deficit, many other participants were categorized as both or neither and only three participants were categorized as posterior alone. Because we did have a number of individuals in the both deficit group and few in the posterior deficit group, it appears that posterior-type deficits present after frontal-type deficits, or potentially that individuals in our sample who had posterior-type deficits in the past, now had deficits in both domains at the time of testing. Neither explanation is inconsistent with the findings of Williams–Gray and colleagues of the prevalence of frontal-type deficits or their proposal that posterior-type deficits may be indicative of future dementia (Williams–Gray et al., 2009).
Seventeen participants were categorized as neither, meaning that they did not meet the level criterion (>1.5 SD below the NC mean) or number criterion (two deficits within a domain) for deficit group membership. It is worth noting that only five of these 17 PD were free of all cognitive deficits across the 10 variables used for categorization and only two were completely deficit-free when all test variables were considered (see Figure 2). The remaining individuals exhibited potential deficits on these measures at a subthreshold level. Three of the 17 neither participants exhibited one deficit in each of the two domains (frontal- and posterior-type tests); the categorization method required two deficits per domain for inclusion in the category. Dalrymple–Alford et al. proposed that one deficit in each of two domains is sufficient for MCI classification, though two deficits per domain is more robust (Dalrymple–Alford et al., 2011). Longitudinal study is needed to know which of these participants with potential subthreshold deficit will go on to develop functionally and clinically significant cognitive dysfunction. Future studies should further examine demographic and disease characteristics across cognitive deficit subgroups to determine if there is a specific phenotype associated with type of cognitive deficit. It will be important to follow the neither group longitudinally to see if and when individuals in this group develop cognitive deficits. The existence of heterogeneous mild (subthreshold) deficits is consistent with other studies of cognition in nondemented PD patients; this heterogeneity represents a continuing challenge in the literature on classifying cognitive impairment in PD (Jellinger, 2012; Martinez–Horta & Kulisevsky, 2011).
Some of the tests in our study had a motor component. To address the possible relation between motor symptom severity and cognitive performance, we correlated UPDRS motor scores with performance on each of the cognitive tests that included a motor component. For the PD group as a whole, there were significant correlations between the UPDRS motor score and Trail Making Test A and Trail Making Test B (p's <.01), though not between the UPDRS motor score and other measures with a motor component (Ruff Figural Fluency, Cube Copy, Pentagon Copy). We also examined the correlations for each of the categorization groups and found no significant correlations between motor severity score and any cognitive variables. Additionally, we correlated each of the cognitive tests with scores on the Purdue Pegboard, a test of psychomotor speed, which we administered to all of our participants. There were no significant correlations between Purdue Pegboard scores and any cognitive measure with a motor component for the PD group as a whole or when each categorization group was examined separately. The results of these analyses suggest that motor symptom severity is in part, but not wholly, related to cognitive performance on some tests involving motor response. Parkinson's disease affects multiple systems including networks supporting motor and cognitive functions, so this complicated relation is representative of the disease process and does not appear to differentiate individuals in our categorization groups.
The cognitive deficit subgroup results were different from those found by Williams–Gray and colleagues (Williams–Gray et al., 2009; Williams–Gray et al., 2007), who used longitudinal clinical and cognitive data to estimate contributors to dementia status. Our study differed in four principal ways: It was a cross-sectional examination of cognitive performance; our analyses focused on performance on a larger number of frontal- and posterior-type neuropsychological tests; we used a stricter definition of deficit (1.5 SD below the mean rather than 1.0 SD criterion); and we compared PD to control performance as well as examining performance within the PD group. Williams–Gray and colleagues found that semantic fluency and pentagon copy were most predictive of future dementia, but those tests did not differentiate PD from HC in our study and were not the most sensitive tests in our assessment. It may be that even subtle deficits on these measures predict later decline. Alternatively, differences in results could be due to true heterogeneity in PD cognitive performance across our samples. Our entire sample was nondemented, whereas the sample from Williams–Gray and colleagues was an incident cohort followed over time. We also defined deficit more strictly, as noted above.
Though our sample size was not large, we nevertheless found highly significant group differences between patients and an age- and education-matched control group, as have other studies with samples of this size (e.g., Burn et al., 2006; Seichepine et al., 2011). We also saw a pattern of subgroups based on performance deficits emerge from our sample. An advantage of our study over others is that we used a neuropsychological assessment addressing multiple frontal- and posterior-type skills commonly impacted by PD, and we were able to consider differences in multiple disease and demographic characteristics in relation to the cognitive deficit subtypes.
We used an age- and education-matched healthy control group for this study, and all participants (PD, HC) were from the greater Boston area. We used this method rather than using published norms in order to mitigate possible group differences based on these demographic variables. Our goal was to focus on the variables from each test that highlighted the greatest percentage of deficit for PD patients. Because normative data for many neuropsychological tests are not consistent in accounting for demographic variables such as education, we consider our method to be more reliable in identifying participants with mild deficits. Had we used normative data for each of the various tests, deficits that are very real to our well-educated PD patients may have been masked by comparison with a less well-matched control group. Although impairment in our PD patients may have been overemphasized as compared with the general population, our method and results may be useful in determining cognitive decline for PD patients with these demographic characteristics in future longitudinal studies.
The Movement Disorders Society (MDS) Task Force recently listed guidelines for characterizing PD-MCI (Litvan et al., 2012), including recommendations for the types of assessments that should be used for diagnosis. The task force suggested that multiple cognitive domains should be assessed with multiple neuropsychological measures, and that MCI diagnosis should require the presence of deficits on at least two tests within a cognitive domain. The task force highlighted the importance of additional research into the number and type of neuropsychological tests most appropriate for diagnosing MCI in PD. In accordance with these MCI guidelines, future studies using larger neuropsychological assessments should continue to examine test performance both within and across participants. In the current study, although the only statistically significantly difference between subgroups was the UPDRS motor score between the both and neither subgroups, several other demographic variables showed a trend toward group differences. The impact of demographic and disease characteristics such as age, education, duration of disease, and severity of the disease should be formally examined in larger studies of frontal-versus posterior-subgroups, as these variables may provide appropriate characterization of subgroup membership. As previously discussed, several functional imaging studies have also implicated frontal and posterior subtypes of PD. If functional imaging studies show patterns that are analogous to behaviorally based neuropsychological patterns of deficits in PD, and frontal- and posterior-type deficit subgroups continue to be supported as meaningful, the combination of noninvasive imaging and detailed neuropsychological assessment could be useful in identifying early cognitive impairment as well as predicting the course of cognitive decline over time.
The current study provides insight into which of the commonly used neuropsychological tests should be used to highlight PD-specific cognitive deficits, as well as into the extent of heterogeneity in cognitive performance in nondemented individuals with PD. The number of cognitive tests needed for frontal versus posterior classification should be a direction of future research. Additional cross-sectional and longitudinal studies examining frontal and posterior subgroups while implementing the MDS Task Force guidelines will help to answer some of the remaining questions about what constitutes MCI in PD. Our results with neuropsychologically determined PD subgroups may inform future definitions of this construct.
Acknowledgments
Funding for this study was provided by the National Institute of Neurological Disorders and Stroke (R01NS067128 to Alice Cronin–Golomb), by the Parkinson's Disease Foundation Summer Student Fellowship to Ivy N. Miller, and by the Boston University Clara Mayo Memorial Research Fellowship to Ivy N. Miller. There were no financial or other relationships that could be interpreted as a conflict of interest affecting this article. We thank all of the individuals who participated in this study. Our recruitment efforts were supported, with our gratitude, by Marie Saint–Hilaire and Cathi Thomas of Boston Medical Center Neurology Associates, and by Boston area Parkinson disease support groups. We thank Chelsea Toner and Laura Pistorino for expert technical support.
References
- Aarsland D, Bronnick K, Fladby T. Mild cognitive impairment in Parkinson's disease. Current Neurology and Neuroscience Reports. 2011;11:371–378. doi: 10.1007/s11910-011-0203-1. doi:10.1007/s11910-011-0203-1. [DOI] [PubMed] [Google Scholar]
- Aarsland D, Kurz MW. The epidemiology of dementia associated with Parkinson's disease. Brain Pathology. 2010;20:633–639. doi: 10.1111/j.1750-3639.2009.00369.x. doi:10.1111/j.1750-3639.2009.00369.x. [DOI] [PMC free article] [PubMed] [Google Scholar]
- Amick MM, Grace J, Chou KL. Body side of motor symptom onset in Parkinson's disease is associated with memory performance. Journal of the International Neuropsychological Society. 2006;12:736–740. doi: 10.1017/S1355617706060875. doi:10.1017/S1355617706060875. [DOI] [PubMed] [Google Scholar]
- Amick MM, Schendan HE, Ganis G, Cronin-Golomb A. Frontostriatal circuits are necessary for visuomotor transformation: Mental rotation in Parkinson's disease. Neuropsychologia. 2006;44:339–349. doi: 10.1016/j.neuropsychologia.2005.06.002. doi:10.1016/j.neuropsychologia.2005.06.002. [DOI] [PubMed] [Google Scholar]
- Appleman ER, Stavitsky K, Cronin–Golomb A. Relation of subjective quality of life to motor symptom profile in Parkinson's disease. Parkinsons Disease. 2011;2011:472830. doi: 10.4061/2011/472830. doi:10.4061/2011/472830. [DOI] [PMC free article] [PubMed] [Google Scholar]
- Azulay JP, Mesure S, Amblard B, Pouget J. Increased visual dependence in Parkinson's disease. Perceptual and Motor Skills. 2002;95:1106–1114. doi: 10.2466/pms.2002.95.3f.1106. [DOI] [PubMed] [Google Scholar]
- Baddeley A, Della Sala S. Working memory and executive control. Philosophical Transactions of the Royal Society London B Biological Sciences. 1996;351:1397–1403. doi: 10.1098/rstb.1996.0123. discussion 1403-1394. [DOI] [PubMed] [Google Scholar]
- Burn DJ, Rowan EN, Allan LM, Molloy S, O'Brien JT, McKeith IG. Motor subtype and cognitive decline in Parkinson's disease, Parkinson's disease with dementia, and dementia with Lewy bodies. Journal of Neurology, Neurosurgery, and Psychiatry. 2006;77:585–589. doi: 10.1136/jnnp.2005.081711. doi:77/5/585[pii]10.1136/jnnp.2005.081711. [DOI] [PMC free article] [PubMed] [Google Scholar]
- Cronin–Golomb A. Parkinson's disease as a disconnection syndrome. Neuropsychology Review. 2010;20:191–208. doi: 10.1007/s11065-010-9128-8. doi:10.1007/s11065-010-9128-8. [DOI] [PMC free article] [PubMed] [Google Scholar]
- Dalrymple–Alford JC, Livingston L, MacAskill MR, Graham C, Melzer TR, Porter RJ, Anderson TJ. Characterizing mild cognitive impairment in Parkinson's disease. Movement Disorders: Official Journal of the Movement Disorder Society. 2011;26:629–636. doi: 10.1002/mds.23592. doi: 10.1002/mds.23592. [DOI] [PubMed] [Google Scholar]
- Dalrymple–Alford JC, MacAskill MR, Nakas CT, Livingston L, Graham C, Crucian GP, Anderson TJ. The MoCA: Well-suited screen for cognitive impairment in Parkinson disease. Neurology. 2010;75:1717–1725. doi: 10.1212/WNL.0b013e3181fc29c9. doi:10.1212/WNL.0b013e3181fc29c9. [DOI] [PubMed] [Google Scholar]
- Danta G, Hilton RC. Judgment of the visual vertical and horizontal in patients with Parkinsonism. Neurology. 1975;25:43–47. doi: 10.1212/wnl.25.1.43. doi: 10.1212/WNL.25.1.43. [DOI] [PubMed] [Google Scholar]
- Davidsdottir S, Wagenaar R, Young D, Cronin–Golomb A. Impact of optic flow perception and egocentric coordinates on veering in Parkinson's disease. Brain: A Journal of Neurology. 2008;131:2882–2893. doi: 10.1093/brain/awn237. doi:10.1093/brain/awn237. [DOI] [PMC free article] [PubMed] [Google Scholar]
- Delis D, Kaplan E, Kramer JH. Delis-Kaplan Executive Function System (D-KEFS) The Psychological Corporation; San Antonio, TX: 2001. [Google Scholar]
- Fahn S, Elton R. United Parkinson's Disease Rating Scale. In: Fahn S, Mardsen D, Calne D, Goldstein M, editors. Recent developments in Parkinson's Disease. Macmillan Health Care Information; Florham Park, NJ: 1987. [Google Scholar]
- Firbank MJ, Colloby SJ, Burn DJ, McKeith IG, O'Brien JT. Regional cerebral blood flow in Parkinson's disease with and without dementia. Neuroimage. 2003;20:1309–1319. doi: 10.1016/S1053-8119(03)00364-1. doi:10.1016/S1053-8119(03)00364-1. [DOI] [PubMed] [Google Scholar]
- Gjerstad MD, Boeve B, Wentzel–Larsen T, Aarsland D, Larsen JP. Occurrence and clinical correlates of REM sleep behaviour disorder in patients with Parkinson's disease over time. Journal of Neurology, Neurosurgery, & Psychiatry. 2008;79:387–391. doi: 10.1136/jnnp.2007.116830. doi:10.1136/jnnp.2007.116830. [DOI] [PubMed] [Google Scholar]
- Hoehn MM, Yahr MD. Parkinsonism: Onset, progression and mortality. Neurology. 1967;17:427–442. doi: 10.1212/wnl.17.5.427. doi:10.1212/WNL.17.5.427. [DOI] [PubMed] [Google Scholar]
- Hughes AJ, Daniel SE, Kilford L, Lees AJ. Accuracy of clinical diagnosis of idiopathic Parkinson's disease: A clinico-pathological study of 100 cases. Journal of Neurology, Neurosurgery, and Psychiatry. 1992;55:181–184. doi: 10.1136/jnnp.55.3.181. doi:10.1136/jnnp.55.3.181. [DOI] [PMC free article] [PubMed] [Google Scholar]
- Ibarretxe–Bilbao N, Junque C, Marti MJ, Tolosa E. Brain structural MRI correlates of cognitive dysfunctions in Parkinson's disease. Journal of the Neurological Sciences. 2011;310:70–74. doi: 10.1016/j.jns.2011.07.054. doi:10.1016/j.jns.2011.07.054. [DOI] [PubMed] [Google Scholar]
- Jefferson AL, Cosentino SA, Ball SK, Bogdanoff B, Leopold N, Kaplan E, Libon DJ. Errors produced on the mini-mental state examination and neuropsychological test performance in Alzheimer's disease, ischemic vascular dementia, and Parkinson's disease. The Journal of Neuropsychiatry and Clinical Neurosciences. 2002;14:311–320. doi: 10.1176/jnp.14.3.311. doi:10.1176/appi.neuropsych.14.3.311. [DOI] [PubMed] [Google Scholar]
- Jellinger K. Heterogenous mechanisms of mild cognitive impairment in Parkinson's disease. Journal of Neural Transmission. 2012;119:381–382. doi: 10.1007/s00702-011-0716-4. doi:10.1007/s00702-011-0716-4. [DOI] [PubMed] [Google Scholar]
- Lee AC, Harris JP, Atkinson EA, Fowler MS. Evidence from a line bisection task for visuospatial neglect in left hemiparkinson's disease. Vision Research. 2001;41:2677–2686. doi: 10.1016/s0042-6989(01)00129-8. doi:S0042-6989(01)00129-8[pii] [DOI] [PubMed] [Google Scholar]
- Lezak MD, Howieson DB, Loring DW, Hannay JH, Fischer JS. Neuropsychological Assessment. 4th ed. Oxford University Press; Oxford, UK: 2004. [Google Scholar]
- Litvan I, Aarsland D, Adler CH, Goldman JG, Kulisevsky J, Mollenhauer B, Weintraub D. MDS Task Force on mild cognitive impairment in Parkinson's disease: Critical review of PD-MCI. Movement Disorders: Official Journal of the Movement Disorder Society. 2011;26:1814–1824. doi: 10.1002/mds.23823. doi:10.1002/mds.23823. [DOI] [PMC free article] [PubMed] [Google Scholar]
- Litvan I, Goldman JG, Troster AI, Schmand BA, Weintraub D, Petersen RC, Emre M. Diagnostic criteria for mild cognitive impairment in Parkinson's disease: Movement Disorder Society Task Force guidelines. Movement Disorders: Official Journal of the Movement Disorder Society. 2012;27:349–356. doi: 10.1002/mds.24893. doi:10.1002/mds.24893. [DOI] [PMC free article] [PubMed] [Google Scholar]
- Maeshima S, Itakura T, Nakagawa M, Nakai K, Komai N. Visuospatial impairment and activities of daily living in patients with Parkinson's disease: A quantitative assessment of the cube-copying task. American Journal of Physical Medicine & Rehabilitation/Association of Academic Physiatrists. 1997;76:383–388. doi: 10.1097/00002060-199709000-00007. [DOI] [PubMed] [Google Scholar]
- Maeshima S, Osawa A, Maeshima E, Shimamoto Y, Sekiguchi E, Kakishita K, Moriwaki H. Usefulness of a cube-copying test in outpatients with dementia. Brain Injury. 2004;18:889–898. doi: 10.1080/02699050410001671847. doi: 10.1080/02699050410001671847. [DOI] [PubMed] [Google Scholar]
- Martinez–Horta S, Kulisevsky J. Is all cognitive impairment in Parkinson's disease “mild cognitive impairment”? Journal of Neural Transmission. 2011;118:1185–1190. doi: 10.1007/s00702-011-0675-9. doi:10.1007/s00702-011-0675-9. [DOI] [PubMed] [Google Scholar]
- Miller IN, Cronin–Golomb A. Gender differences in Parkinson's disease: Clinical characteristics and cognition. Movement Disorders: Official Journal of the Movement Disorder Society. 2010;25:2695–2703. doi: 10.1002/mds.23388. doi:10.1002/mds.23388. [DOI] [PMC free article] [PubMed] [Google Scholar]
- Pagonabarraga J, Kulisevsky J. Cognitive impairment and dementia in Parkinson's disease. Neurobiology of Disease. 2012;46:590–596. doi: 10.1016/j.nbd.2012.03.029. doi:10.1016/j.nbd.2012.03.029. [DOI] [PubMed] [Google Scholar]
- Paschali A, Messinis L, Kargiotis O, Lakiotis V, Kefalopoulou Z, Constantoyannis C, Vassilakos P. SPECT neuroimaging and neuropsychological functions in different stages of Parkinson's disease. European Journal of Nuclear Medicine and Molecular Imaging. 2010;37:1128–1140. doi: 10.1007/s00259-010-1381-9. doi:10.1007/s00259-010-1381-9. [DOI] [PubMed] [Google Scholar]
- Pereira JB, Junque C, Marti MJ, Ramirez–Ruiz B, Bargallo N, Tolosa E. Neuroanatomical substrate of visuospatial and visuo-perceptual impairment in Parkinson's disease. Movement Disorders: Official Journal of the Movement Disorder Society. 2009;24:1193–1199. doi: 10.1002/mds.22560. doi:10.1002/mds.22560. [DOI] [PubMed] [Google Scholar]
- Purdue F. Purdue Pegboard Test. Lafayette Instrument Co; Lafayette, IN: 1948. [Google Scholar]
- Rey A. L'examen clinique en psychologie. Presses Universitaires de France; Paris, France: 1964. [Google Scholar]
- Ruff RM, Light RH, Evans RW. The Ruff Figural Fluency Test: A normative study with adults. Developmental Neuropsychology. 1987;3:37–51. doi:10.1080/87565648709540362. [Google Scholar]
- Schendan HE, Amick MM, Cronin–Golomb A. Role of a lateralized parietal-basal ganglia circuit in hierarchical pattern perception: Evidence from Parkinson's disease. Behavioral Neuroscience. 2009;123:125–136. doi: 10.1037/a0013734. doi:10.1037/a0013734. [DOI] [PMC free article] [PubMed] [Google Scholar]
- Seichepine DR, Neargarder S, Miller IN, Riedel TM, Gilmore GC, Cronin–Golomb A. Relation of Parkinson's disease subtypes to visual activities of daily living. Journal of the International Neuropsychological Society. 2011:1–12. doi: 10.1017/S1355617711000853. doi:S1355617711000853[pii]10.1017/S1355617711000853. [DOI] [PMC free article] [PubMed] [Google Scholar]
- Stern Y, Sano M, Paulson J, Mayeux R. Modified Mini-Mental State Examination: Validity and reliability. Neurology. 1987;37:179. [Google Scholar]
- Stroop J. Studies of interference in serial verbal reactions. Journal of Experimental Psychology. 1935;18:643–662. doi:10.1037/h0054651. [Google Scholar]
- Tombaugh TN. Trail Making Test A and B: Normative data stratified by age and education. Archives of Clinical Neuropsychology. 2004;19:203–214. doi: 10.1016/S0887-6177(03)00039-8. doi:10.1016/S0887-6177(03)00039-8S0887617703000398[pii] [DOI] [PubMed] [Google Scholar]
- Wechsler D. Wechsler Memory Scale. 3rd ed The Psychological Corporation; San Antonio, TX: 1997. [Google Scholar]
- Williams–Gray CH, Evans JR, Goris A, Foltynie T, Ban M, Robbins TW, Barker RA. The distinct cognitive syndromes of Parkinson's disease: 5 year follow-up of the CamPaIGN cohort. Brain. 2009;132:2958–2969. doi: 10.1093/brain/awp245. doi:10.1093/brain/awp245. [DOI] [PubMed] [Google Scholar]
- Williams–Gray CH, Foltynie T, Brayne CE, Robbins TW, Barker RA. Evolution of cognitive dysfunction in an incident Parkinson's disease cohort. Brain: A Journal of Neurology. 2007;130:1787–1798. doi: 10.1093/brain/awm111. doi:10.1093/brain/awm111. [DOI] [PubMed] [Google Scholar]