

Abstract
Dietary assessment is important in health maintenance and intervention in many chronic conditions, such as obesity, diabetes, and cardiovascular disease. However, there is currently a lack of convenient methods for measuring the volume of food (portion size) in real-life settings. We present a computational method to estimate food volume from a single photographical image of food contained in a typical dining plate. First, we calculate the food location with respect to a 3D camera coordinate system using the plate as a scale reference. Then, the food is segmented automatically from the background in the image. Adaptive thresholding and snake modeling are implemented based on several image features, such as color contrast, regional color homogeneity and curve bending degree. Next, a 3D model representing the general shape of the food (e.g., a cylinder, a sphere, etc.) is selected from a pre-constructed shape model library. The position, orientation and scale of the selected shape model are determined by registering the projected 3D model and the food contour in the image, where the properties of the reference are used as constraints. Experimental results using various realistically shaped foods with known volumes demonstrated satisfactory performance of our image based food volume measurement method even if the 3D geometric surface of the food is not completely represented in the input image.
Keywords: model-based framework, single view 3D/2D registration, active contour model, food volume estimation, quantitative dietary assessment
1. Introduction
Dietary assessment is an important tool for overweight and obese individuals to monitor their caloric intake for an effective weight control. This assessment is also important for patients with certain chronic conditions, such as diabetes, some types of cancer, and cardiovascular diseases [1]. Currently, dietary assessment relies on self-reporting in which the subject recalls the consumed foods and their portion sizes. However, human memory of the past eating events is imperfect; visually gauging the size of a food based on an imaginary measurement unit (e.g., a cup or a tablespoon) is very subjective; and some individuals are unwilling to accurately account all consumed foods and beverages. As a result, the self-reporting method is inaccurate and biased, especially among overweight individuals who often under-report their caloric intake [2][3]. This problem makes the collected dietary data unreliable, which not only causes inaccuracy in the results of scientific studies of obesity, but also prevents the development of effective treatment methods for overweight individuals.
In recent years, camera-enabled cell phones have been studied for their potential application to dietary assessment. Several studies reported that the collection of digital images at the time food is consumed offers a powerful approach to improve the accuracy of dietary assessment [4][5]. Using such images, portion size can be estimated without relying on subject’s recall. However, this approach is intrusive, and might influence food choice. To eliminate the requirement of taking pictures manually, we developed a wearable computer (called “eButton”) [6][7][8], which consists of a low-power, high-performance central processing unit (CPU), a random-access memory (RAM), communication interfaces, a number of peripheral components (mostly electronic sensors), and a Linux or Android operating system. As a chest button worn on a shirt or blouse, this device has many applications using different combinations of available sensors. In this specific study, a camera on the device is utilized to take pictures automatically during eating events (figure 1). Using eButton, dietary assessment thus becomes completely passive, eliminating the behavioral disruption inherent in manual photography.
Figure 1.

(a) eButton; (b) electronic circuit board within the device; (c) a subject wearing the device while eating.
Although the cell phone and eButton acquire food images in different ways, the images obtained are similar. These images must be analyzed by a computer in order to estimate food volume. Then, the volume (e.g., in cubic centimeters) is converted to portion size, which is usually represented in a certain intuitive unit based on a number of commonly used utensils or tools in the kitchen, such as a cup, a teaspoon or a tablespoon. The calories and nutrients in the food are then determined from a database by inputting the food name and portion size. There are several food databases available in the public domain, such as the Food and Nutrient Database for Dietary Studies (FNDDS) developed by the U.S. Department of Agriculture (USDA) [9].
It is clear that, in this procedure, food volume estimation is an essential data analysis step. Traditionally, image-based volume estimation methods have been developed using multi-view images. Puri et al. [10] and Kong et al. [11] proposed a method to estimate food portion size based on a 3D reconstruction algorithm using three images captured around a plate of food by a mobile phone. Although multi-view images can provide more spatial information about food geometry, it is quite inconvenient for the subject to collect multiple images around the food. While food volume estimation based on a single image is often preferred in practice, significant technical problems exist. First, multi-color food textures or shadows in the input image often disrupt the food segmentation process. Second, a single view of a 3D object does not provide complete spatial information (e.g., the back of the object is unobservable). It is thus difficult to obtain an accurate reconstruction. Third, a metric scale (similar to the scale on a map) must be present or implied in the image otherwise it is impossible to know the actual size of the food.
In order to estimate volume, the relevant food objects in the image must be segmented. This is a difficult task because the image background is often complex. Mrey et al. [12] proposed a segmentation method based on a global thresholding. Zhu et al. [13][14] utilized a region-based active contour model (ACM/snake) and a multi-level method for both segmentation and classification. Although the reported methods incorporate statistical feature clusters, region associations, and homogeneity information into the segmentation process, they segment objects mainly based on pixel or regional intensity properties without using object shape constraints. As a result, fragmental regions appear frequently after segmentation due to shadows and multiple colored textures.
Sun et al. [15] proposed an interactive tool to determine the food portion size from a single-view image based on perspective geometry. Chae et al. [16] and Zhu et al. [13] designed model-based methods to infer the food volume from a single-view image. Fellegari et al. [17], Koc et al. [18], and Rashidi et al. [19] utilized ellipsoidal and spherical models to estimate the sizes of kiwi, watermelon, orange and other food items. In these methods, only limited key feature points in the food object are utilized. Therefore, they are sensitive to feature detection errors and are suitable only in limited cases. Moreover, these methods require subjects to place a checkerboard card or a similar referent into the field of view before imaging the food. Again, this requirement is inconvenient, negatively affects the natural dinning environment, and potentially modifies subjects’ eating behavior.
In this paper, we address these challenging problems and develop an efficient, reliable and semi-automatic computational tool for single-view image food volume estimation. We construct a food shape library to confine food objects. This key approach enables us to estimate a 3D volume from a 2D image since the volume of the 3D shape model can be calculated analytically after properly fitting the food object. This new approach takes the advantage that most common foods have roughly known shapes. When compared to conventional methods, our method utilizes global shape properties, rather than only a small number of feature points, to determine food dimensions (e.g., diameter, length, height and/or width). In addition, we develop a combined method with adaptive thresholding and snake model deformation to segment multi-colored food items efficiently.
2. Method
2.1. Overview
The proposed method involves three stages: base plane localization, food segmentation, and volume estimation. The flowchart of this method is shown in figure 2. We first calculate the base plane of the food which is defined as the plane on which the base of the food is sitting with respect to the camera coordinate system. In this process, an input of food name is required to associate the food with a predetermined 3D geometric shape model in the model library. Then, an algorithm using adaptive thresholding and edge-based snake deformation is implemented to extract the contour of the food from the background image. Finally, food volume is estimated from the size of the shape model after registering the 3D shape model to the 2D food contour (here we call it 3D/2D model-to-image registration). The following sections describe the details of these computational steps.
Figure 2.
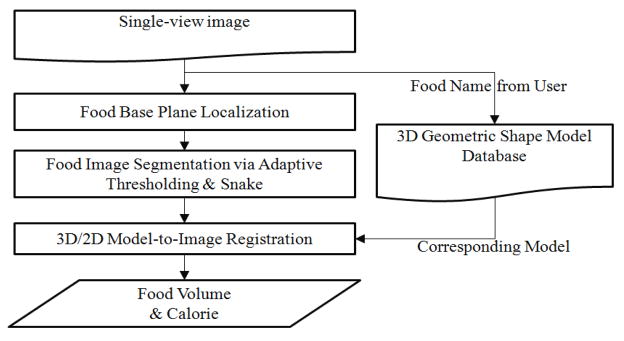
Flowchart of the proposed method.
2.2. Food base plane localization
In this step, we reconstruct the spatial relationships between the food, camera and real world coordinates. Unlike the traditional methods which use a checkerboard card as a referent, in our approach, we use the serving container itself as the referent to link the image scale with the world coordinate system [20]. In the western culture, this container is usually a circular dining plate. In order for the plate to provide a scale reference, its diameter must be measured, while its depth can be either measured or estimated. If a bowl is used as a serving container as usually seen in the Asian culture, both the diameter and height of the bowl must be measured. Since the measurements can be performed by the subject either before or after the dietary study, the subject does not need to place any referent on the dining table, eliminating the disturbance to the actual dining event.
In order to determine the food base plane, we first calculate the perspective matrix Min of the camera via a general calibration procedure [21]. Figure 3 shows the schematic diagram indicating the relationship between the circular dining plate and its projected image on the image plane. The plate projection contour is depicted on the image plane and its shape can be represented by an ellipse equation:
| (1) |
where a′, h′, b′, g′ and f′ are parameters which are known after fitting the plate boundary in the input image. By using this ellipse as the base of a quadric cone, the 3D representation of the cone with respect to the camera coordinate system can be defined as:
| (2) |
where f is the focal length of the camera. It can then be observed from figure 3 that the position and orientation of the plate can be uniquely identified as long as we find a 3D plane P, which intersects with the quadric cone in a perfect circle with radius r. It is further considered that there exists a distance deviation of plate depth (which may be estimated or ignored for a sallow plate) between the plate and food planes. We hence shift plane P with a plate depth value d along the normal of the plate away from the origin O, and consequently obtain the food plane P1: lx + my + nz = q + d, where (l, m, n) represents the surface norm of the food base plane with l2 + m2 + n2 = 1, and q is the distance of the plane to origin O. The detailed derivations of l, m, n, and q can be referred to our previous study [20]. The position and orientation of the food plane provide useful geometric constraints for the following 3D/2D food model registration process.
Figure 3.

Schematic diagram illustrating the process of food plane calculation and the perspective relationship between a circular plate and its image. Origin O is the focus of the camera lens. Symbols XYZ define a real word coordinate system, in which Z is perpendicular to the image plane.
2.3. Food segmentation based on adaptive thresholding and snake model
In this section, we present a combination of adaptive thresholding approach and edge-based snake model to segment foods from the detected plate region. At first, a simple user-drawing step is carried out on the background, as shown in figure 4(a), in order to acquire information of background color distribution. Then, a dissimilarity map Md (figure 4(b)) that characterizes the color difference between each pixel i and the background is calculated:
| (3) |
| (4) |
where P is the set of drawing points, ci and c̃k represent the YCbCr color vectors of pixel i and drawing point k, respectively. A k-d tree data structure [22], which is built based on a binary partitioning process to handle the problem of nearest neighbor search in O(logN), is implemented to speed up the multidimensional search process in equation (4).
Figure 4.
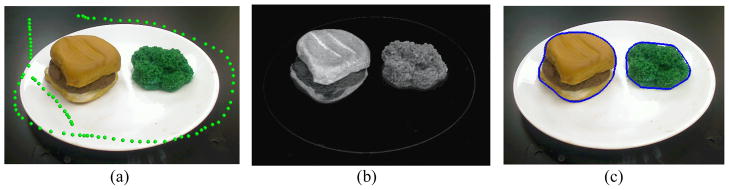
Food segmentation: (a) original image with user-drawn points (green); (b) dissimilarity map Md; (c) segmentation result after the snake deformation.
Next, Otsu’s adaptive thresholding [23], which separates two classes by maximizing inter-class variance, is applied to the dissimilarity map in order to extract the food region. Then, morphological closing is performed to connect adjacent regions segmented, and each connected component with its size greater than a certain minimum value is considered to be a food region. We then build convex hulls, each of which encloses the corresponding food region by using Andrew’s monotone chain algorithm [24]. Each hull serves as an initial contour of snake model in a deformation process which is achieved by minimizing an energy function Esnake, which is defined in terms of deformation degrees of snake model and image evidences for specifying target boundaries:
| (5) |
where Eshape, Econtrast, and Ehomogeneity are, respectively, the shape energy, contrast energy, and homogeneity energy, v(s) is the coordinate of the s-th point of the snake contour, and α and β are weight values determining the relative importance of these energies. The total energy value increases as the model deforms away from the target object. Eshape, which measures stretching and bending degrees of the snake, is defined as
| (6) |
where v′(s) and v″(s) are the first and second order derivatives of the snake contour, respectively.
Human foods often contain multi-color textures. As a result, only using a color gradient as the edge evidence for attracting the snake is very likely to locate undesirable edges inside the food [25]. However, it can be observed that the boundary of a complete food item is mostly between the food and the plate, rather than between ingredients. In order to attract the snake to the target boundary, we hence design the contrast and homogeneity energies (equations (7) and (8)) based on the dissimilarity map.
| (7) |
where n(v(s)) represents the outer-pointing norm of the snake contour at v(s), and λ is a weighting factor whose value is inversely proportional to the average intensity of the neighborhood outside the snake contour. If this neighborhood presents lower pixel values in Md, it has a higher probability that the model is situated at the transition from the food to the plate. For such a case, the value of λ will increase to enhance the food edge evidence. In addition, the homogeneity energy that calculates the regional dissimilarity variances outside the snake contour is defined as
| (8) |
where c is the mean of dissimilarity values outside the snake contour regions. When the snake contour is attracted by undesired edges with a large contrast value, Ehomogeneity will increase, and the energy function ESnake will be penalized. Overall, the contrast and homogeneity energies can efficiently capture the desired food boundaries for segmenting a complete food item, while the shape energy properly constrains the degree of contour deformation to maintain smoothness and avoid excessive distortions. The segmentation result of the snake deformation is shown in figure 4(c).
During our implementation, equation (5) was minimized iteratively by adjusting the snake contour to fit the food boundary. The iteration was stopped when the sum of the changed points in the contour points between the previous and current iterations was less than 5, or when the number of iterations reached 20. To achieve a better convergence during the iterative minimization process, the width of the search region perpendicular to the snake contour decreased progressively from 140 to 30 as the value of α (weight of the shape energy) decreased progressively from 0 to 0.5. The value of β (weight of the contrast energy) was set to 0.6*(1–α) and the weight value of the homogeneity energy was set to 1–α–β. These parameters were empirically determined and the same settings were used throughout all experiments. After the snake deformation, we are able to obtain the segmentation result for the food from the given image, and then proceed to the 3D/2D model-to-image registration.
2.4. 3D/2D model-to-image registration
Based on our observation, the shapes of most real-world foods can be modeled by a set of geometric shapes. Therefore, we construct a 3D geometric shape library, in which correspondences between each model to a group of foods are pre-established based on human knowledge. For each food in the image, we proposed a 3D/2D model-to-image registration scheme to fit a 3D shape model with the food. Then, the volume of the food is estimated based on the analytically calculated volume of the fitted shape model.
2.4.1. 3D geometric shape library
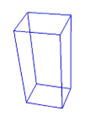
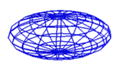
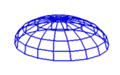
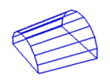
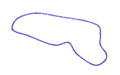
We have established an initial version of the geometric shape library as shown in table 1 where columns 1 to 5 represent the model name, model appearance, examples of the corresponding foods, pose parameters and number of pose parameters, respectively. This initial version contains only nine regularly shaped models, including cuboid, wedge, cylinder, sphere, upper and bottom half spheres, ellipse, half ellipse, and tunnel. The volumes of the regularly shaped models can be directly calculated using established formulas. In addition to these regularly shaped models, we also include an irregularly shaped model in order to measure foods of other shapes, such as a steak. The bottom surface of the irregularly shaped model is adaptively determined by the segmented food contour, and its 3D structure is constructed by stacking the bottom surface in the norm direction of the food base plane. Specifically, the bottom surface area of the food is first calculated by using a 2D region growing method [26]. Then, the volume is obtained by multiplication of the bottom area and the stacking height. For all shape models in the library, the pose parameters (column 4) are optimized through the 3D/2D model-to-image registration (next section) to determine the food volume.
Table 1.
3D geometric shape model library.
| Model | Appearance | Corresponding food examples | Pose parameters | # of parameters |
|---|---|---|---|---|
| Cuboid |
|
Cornbread | Translations (2), rotation (1), scaling (3) | 6 |
| Wedge |

|
Pizza, pie | Translations (2), rotation (1), fan angle (1), radius (1), height (1) | 6 |
| Cylinder |

|
Hamburger, drinks, jelly | Translations (2), radius (2), height (1) | 5 |
| Sphere |

|
Peach, orange | Translations (2), radius (1) | 3 |
| Half sphere |

|
Half peach | Translations (2), radius (1) | 3 |
| Ellipse |
|
Potato | Translations (2), rotation (1), lengths (3) | 6 |
| Half ellipse |
|
Half potato, plate of rice | Translations (2), rotation (1), lengths (3) | 6 |
| Tunnel |
|
Cut carrot | Translations (2), rotation (1), length (1), tunnel radius (2) | 6 |
| Irregular shape |
|
Steak, pork chop | Translations (2), rotation (1), scaling (3) | 6 |
2.4.2. Registration procedure
Figure 5(a) conceptually illustrates the concept of model-to-image registration. First, a 3D model corresponding to the given food item is generated on the food plane. We can project the model onto the image by using the perspective projection matrix Min obtained from the camera calibration procedure. The projection points S′ are obtained by
Figure 5.
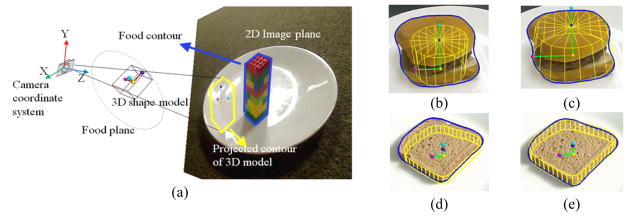
3D/2D model-to-image registration: (a) illustration for the 3D/2D registration; (b)(d) and (c)(e) projected 3D models before and after registration, respectively. Yellow contours are the projections from 3D models, and the blue contours are from food segmentation.
| (9) |
where Mex is the extrinsic matrix specifying the geometric transformation between the camera and world coordinate systems, T is a 4 × 4 transformation matrix which depends on the pose parameters, and S is the set of surface points of the shape model with Θ = (tx, ty, tz, θx, θy, θz, sx, sy, sz) as its pose parameters, including three displacements, three rotation angles and three scales with respect to the camera coordinates. Here, S is written as a homogeneous coordinate matrix for calculation convenience. If the origins of camera and world coordinate systems are assumed to be the same for the camera projection, Mex can be simplified as .
The 3D/2D registration is to find the optimal pose parameters Θ of the 3D shape model such that the projected contour best matches the segmented food contour by minimizing a cost function Freg:
| (10) |
where vj ∈ S′ represents the j-th projected model contour point, m is the number of projected contour points, and IDT is a distance image, which is obtained at the first iteration of the minimization process by using the sequential distance transformation [27]. The value of each pixel in IDT represents its closest distance to the segmented food contour. For the rest iterations, we do not need the searching process for the closest points between the projected model contour and segmented food contour. Instead, we just refer the pixel positions of the distance image, which coincide with the projected contour of the 3D model, and then sum up these pixel values as the value of the cost function. As a result, the time complexity can be reduced from O(N2) to O(N).
When equation (10) is implemented, a non-uniqueness problem may arise that a 3D model with different pose parameters may produce the same projection contour in the single-view image, yielding ambiguous solutions. Since we have known the location of the food plane, the three displacements, tx, ty, and tz, can be represented using only two displacements tx1 and ty1 on the x-y plane of the camera coordinates:
| (11) |
where (u, v, w) = (l, m, n) × (0, 0, 1) with “×” being the cross product, and θP is the rotation angle around (u, v, w). Moreover, the three angles θx, θy, and θz can be replaced with one rotation angle around the norm of the plate. Furthermore, sx, sy, and sz can be simplified depending on whether the selected model needs isotropic or anisotropic scale adjustment. Here, the isotropic scale adjustment means that a shape model is enlarged or shrunk by a scale factor that is identical among all directions, and otherwise, it is so-called anisotropic scaling. Consequently, the dimension of pose parameters of a 3D model can be reduced (less than or equal to six) to accelerate the registration process. Figures 5(b)(d) and 5(c)(e) shows the projection contours of 3D shape models before and after registration, respectively.
3. Results and discussion
Experiments were conducted to evaluate accuracies in food contour segmentation and volume estimation. Seventeen realistically shaped food replicas of known volumes (figure 6) were utilized. Five images were acquired for each food at different locations on the plate with a Logitech webcam (Pro 9000, Logitech). The distance between the food and the camera was around 30 cm. The dimension of each image was 1600 by 1200 pixels, and the pixel size was 0.0028 millimeter. For each image, the proposed method was implemented to estimate food portion size automatically after the background of food image was identified via user drawing. The average processing time was approximately five seconds per image, which may be accelerated considerably since our software was not optimized for computational speed.
Figure 6.
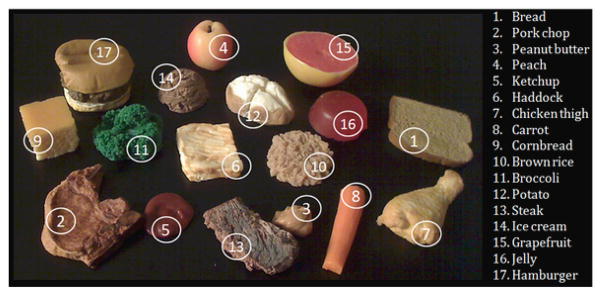
Food items used in the validation experiments.
3.1. Accuracy evaluation of food contour segmentation
The accuracy of food segmentation was quantitatively evaluated by comparing our segmentation results to the ground truth, which was obtained manually by hand identification of the contour. As this process was tedious for the large set of data (eighty-five digital images), we randomly chose one image out of the five images for each food. Thus, only seventeen images were utilized for validation. A contour distance measure based on the mean error (ME) and a spatial dependency measure based on the dice similarity coefficient (DSC) [28] were utilized to evaluate the consistency between the automatic result and the ground truth:
| (12) |
| (13) |
where ai and bj represent the coordinates of the i-th pair of closest contour points of our automatic segmentation result and the ground truth, respectively, Q is the number of contour points of the automatic result, and A and B are the sets of pixels of the automatic result and ground truth, respectively. Table 2 lists the MEs and DSCs of the 17 food images. The averaged ME and DSC were 2.61 ± 0.93 pixels and 97.64 ± 0.78 %, respectively. For each food, the ME was less than 3 pixels, which was quite small compared to the contour length (between 136 and 492). Moreover, the DSC was higher than 0.95, indicating a good overlap between the automatic and manual results [28].
Table 2.
Accuracy evaluation of food segmentation by ME in pixel and DSC in percentage.
| Bread (484.12) | Pork Chop (429.06) | Peanut Butter (136.40) | Peach (279.58) | Ketchup (180.28) | |
|
|
|||||
| ME DSC |
2.15 | 3.16 | 1.95 | 1.813 | 1.23 |
| 98.64 | 97.22 | 96.41 | 98.44 | 98.12 | |
|
|
|||||
| Haddock (422.72) | Chicken Thigh (444.16) | Carrot (410.39) | Cornbread (273.38) | Brown Rice (351.89) | |
|
|
|||||
| ME DSC |
4.27 | 3.13 | 2.29 | 2.64 | 2.27 |
| 97.11 | 96.90 | 96.15 | 97.68 | 98.18 | |
|
|
|||||
| Broccoli (328.44) | Potato (492.25) | Steak (305.81) | Ice cream (258.01) | Grapefruit (275.28) | |
|
|
|||||
| ME DSC |
3.21 | 3.66 | 1.07 | 2.04 | 3.24 |
| 97.45 | 97.58 | 98.76 | 98.09 | 96.86 | |
|
|
|||||
| Jelly (393.58) | Hamburger (417.74) | Average | Std | ||
|
|
|||||
| ME DSC |
2.15 | 4.09 | 2.61 | 0.93 | |
| 98.52 | 97.70 | 97.64 | 0.78 | ||
The value in parentheses represents the maximal length of the food in the image.
3.2. Accuracy evaluation of food volume estimation
In this experiment, we first measured the true volumes of the seventeen foods either manually or using water displacement. Then, the accuracy of the estimation was evaluated based on relative error E:
| (14) |
where VE and VG are, respectively, the estimated and ground truth volumes. For each food item, the relative error, mean and standard deviation were calculated five times using the five available images. The evaluation results for the seventeen foods are listed in Table 3.
Table 3.
Relative error of food volume estimation.
| Sample | True Volume (cm3) | 3D Model | Average Estimation (cm3) | Mean of Es (%) | Std of Es |
|---|---|---|---|---|---|
| Bread | 106 | Irregular Shape | 107.56 | 1.47 | 2.89 |
| Pork Chop | 74 | Irregular Shape | 71.95 | −2.77 | 15.17 |
| Peanut Butter | 15 | Half Sphere | 15.123 | 0.82 | 6.90 |
| Peach | 151 | Sphere | 148.80 | −1.46 | 6.94 |
| Ketchup | 10 | Irregular Shape | 11.44 | 14.49 | 14.20 |
| Haddock | 57 | Cuboid | 69.98 | 22.78 | 8.04 |
| Chicken Thigh | 64 | Irregular Shape | 64.54 | 0.85 | 6.88 |
| Carrot | 24 | Tunnel | 24.15 | 0.66 | 4.63 |
| Cornbread | 93 | Cuboid | 95.17 | 2.33 | 3.11 |
| Brown Rice | 52 | Irregular Shape | 53.17 | 2.25 | 8.99 |
| Broccoli | 107 | Irregular Shape | 102.58 | −4.13 | 5.56 |
| Potato | 113 | Half Ellipse | 117.31 | 3.82 | 6.29 |
| Steak | 42 | Irregular Shape | 42.96 | 2.29 | 7.71 |
| Ice cream | 80 | Half Sphere | 92.76 | 15.95 | 4.04 |
| Grapefruit | 272 | Half Sphere | 267.16 | −1.78 | 2.45 |
| Jelly | 110 | Cylinder | 109.47 | −0.48 | 3.60 |
| Hamburger | 307 | Cylinder | 323.00 | 5.21 | 2.84 |
| Average | 3.69 |
Three foods (ketchup, haddock, and ice cream) showed the largest estimation errors. The cause was found to be their geometric properties. The size of the ketchup was small, which led to higher sensitivity in calculating the relative error. Moreover, although it seems that the shapes of haddock and ice cream could be very well approximated by cuboid/half sphere models, parts of their surfaces were concave, thus their volumes were subject to an over-estimation. However, for most other foods with irregular shapes, our method had an average error of 3.69%. This error was much lower than that made by visual estimation, roughly 20% on average, by subjects in terms of some assistive aids for size comparison, such a golf ball or a deck of card [29]. In addition, it was smaller than the relative errors reported in [30] as 10% and in [31] as 15%.
3.3. Performance evaluation of the proposed system
3.3.1. Statistical analysis on food volume estimation results
The estimation results of food volumes were evaluated using the Bland–Altman plot and linear regression. A Bland–Altman plot, combining with liner regression analysis using 95% confidence and prediction intervals, was generated to quantify agreement between the average estimated result and the true volume for the validation images, as shown in figure 7. The green solid lines represent the mean bias, the solid blue line indicates the regression line, the dashed brown curves indicate the 95% confidence interval, and the dashed orange curves show the 95% prediction interval. Figure 7(a) was obtained from all seventeen food items, while figure 7(b) excludes ketchup, haddock, and ice cream. The plot reveals no obvious systematic error in estimation. Moreover, most estimates fall in the 95% prediction interval, indicating good reliability of the proposed method. It can also be observed that the slope of the regression line is close to 0 and the y-intercept is very small, indicating a high correlation between the food volumes estimated by the proposed method and the true volumes. The resulting plots also show that if ketchup, haddock, and ice cream are excluded from the linear regression analysis, much smaller confidence and prediction intervals are achieved, indicating that the potential estimation errors for most foods obtained by our proposed system are 95% likely to fall in the small range of [+5, −5].
Figure 7.
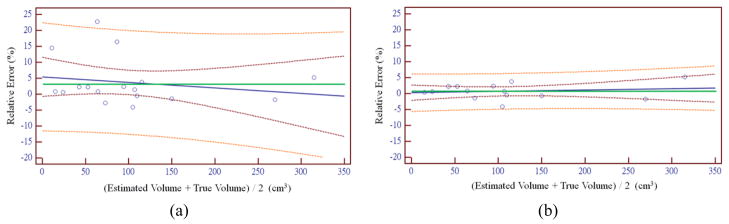
Bland–Altman analysis comparing the proposed method to the ground truth: (a) plot using all the 17 food items. The linear regression line (solid blue line) in (a) is y = 0.54313 – 0.01740 x, with coefficient of determination R2 = 0.038; (b) plot using only the 14 food items (without ketchup, haddock and ice cream). The linear regression line in (b) is y = 0.2740 + 0.004052 x, with coefficient of determination R2 = 0.021. The green solid lines are the mean bias, the dashed brown curves indicate the 95% confidence interval and the dashed orange curves show the 95% prediction interval.
3.3.2. Effect of different plates on food volume estimation
The food plane localization method used in our system requires users to provide the radius and depth parameters of a plate. We were therefore concerned about how different plates would affect volume estimation accuracy. Four plates with different radius and depth values were prepared and used in the experiment. A block of cornbread, whose shape is relatively regular compared to the other foods, was selected in order to minimize the effects of irrelevant factors (e.g., food shape) on the accuracy of registration and segmentation. The cornbread was placed at three locations on each plate and digital images were acquired. Three estimation results were then automatically obtained from each plate image using the proposed method. The results for different plates were then evaluated based on comparison with the ground truth, as listed in table 4. The averaged estimation errors for all the plates were less than 3%. Thus, the evaluation results indicate no obvious association between the errors and the plates. Although a circular plate was adopted as the reference to localize the food base plane in this paper, other regular objects of known dimensions, such as a credit card, iphone, or coin, could be used as an alternative when implementing the proposed model-based measurement system.
Table 4.
Comparison between volume estimation based on different plates by the relative error (%).
| Plate 1 | Plate 2 | Plate 3 | Plate 4 | |
|---|---|---|---|---|
| Radius r (cm) | 13 | 11.5 | 11.35 | 7.25 |
| Depth d (cm) | 1.7 | 1.6 | 3 | 1.3 |
|
| ||||
| Sample | ||||
| 1 | 3.07 | −1.75 | 2.90 | 0.47 |
| 2 | 2.97 | 7.10 | 0.37 | −0.53 |
| 3 | 0.10 | −3.75 | 0.22 | −0.53 |
| Average | 2.05 | 0.53 | 1.16 | −0.20 |
| Std | 1.69 | 5.77 | 1.51 | 0.58 |
The proposed method includes a drawing step to obtain the information of color distribution of the plate. The number of points in the drawing is dependent on the complexity of the plate. As long as the drawing passes a part of the plate to sample its color, there should be enough information to facilitate the food segmentation process. In our experiment, certain variations in shadow and lighting reflections were observed even when the same plate was used for different foods. The drawing step was performed on the YCbCr color space which is relatively immune to the illumination variation [32]. Although the numbers of drawing points were different, the segmentation results (mean error: 2.61 ± 0.93; dice similarity coefficient: 97.64 ± 0.78) were consistent. It hence indicated that, to a certain extent, the segmentation accuracy was not sensitive to the number of drawing points.
3.3.3. Application to the eButton in real eating activity
In this section we describe our experiment on the use of eButton to perform dietary assessment in daily eating activity. The details of the eButton hardware were reported previously [7]. During our experiment, subjects worn the eButton on their chest to record eating process (frame rate: 1 frame/sec; dimension: 640 by 480 pixels). We found that the distance between the eButton and the food on table is usually between 20 and 30 cm when the subject was in the sitting position. To ensure the food(s) can be imaged in such a short distance, a 105° wide-angle camera was installed within the eButton. A sequence of eButton images recording the subject’s eating activity was acquired and then saved in a SD memory card within the eButton.
In the off-line analysis, one of the best images (i.e., without motion blur artifacts and missing parts in the plate of food) was selected for estimating food portion size (see figure 8(a)). In order to achieve an acceptable measurement, we developed the software capable of the model-based measurement and lens distortion correction [33]. Firstly, the software performed the undistortion process on the input image and localized the food base plane (see figure 8(b)). Then, the food in the plate was segmented and an appropriate 3D shape model was initialized as shown in figure 8(c). Next, the 3D shape model was automatically adjusted to fit the segmented food contour using the 3D/2D registration procedure (figure 8(d)). Finally, the food volume was approximated by the volume of the registered shape model. If the food was consumed incompletely, the user can still choose another image after the recorded eating event, estimate the leftover food volume, and subtract the volume from that estimated before eating.
Figure 8.
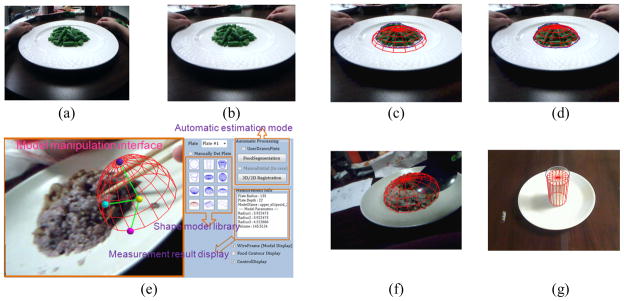
Estimation of food portion size in real eating activity using the eButton: (a) original image; (b) undistorted image; (c) superposition of segmented food contour and initial shape model onto (b); (d) automatically fitted shape model using 3D/2D registration; (e) user interface of the software; (f) case of object occlusion (spoon) showing superposition of manually registered shape model and image; (g) case of a cup of soymilk by manual fitting of the cylinder model.
It was further considered that there were several practical problems in segmentation, such as shadows, reflection, complex food ingredients, motion blurring, and object occlusions, which frequently appear in real eating activity. These problems may cause a failure in automatic segmentation and volume approximation. To make the software more practical in case of such failure, we have further provided a user-friendly interface (see figure 8(e)) to facilitate manual adjustment of the shape model. The user can manipulate all pose parameters with ease by dragging the control points of shape model using a mouse. As a result, an accurate measurement of food volume can still be achieved using the manual estimation mode of our software, even though the foods were partially occluded by an object, such as a spoon as shown by the example in figure 8(f). In addition, it was also found that using a generic multi-view method like the one used in [10], which needs correct correspondence of feature points to reconstruct the 3D surface of food item, could be difficult to handle the case of liquid food. The major reason is because liquid food is usually textureless and is seriously occluded by the container. Figure 8(g) shows an example of estimating volume of a cup of soymilk from a single-view eButton image. We have hence found from these experiments that, if a single-view image was carefully selected from the sequence of eButton images, volume estimation can be performed efficiently by using the proposed virtual shape model.
3.3.4. System limitations
As the eButton data may suffer from certain imaging artifacts, such as the radial distortion of wide-angle lens, we need additional pre-processing steps to correct the food images for the purpose of measuring the portion size. The biases of these pre-processing steps are very likely to be accumulated in the measuring result. We hence tried to simplify the imaging environment and adopted a higher-resolution camera to carry out the above quantitative experiments, so that the effectiveness of the virtual model-based measurement can be evaluated more objectively (without being influenced by other factors). In addition, there are still some unresolved issues in automatic estimation of food volume due to large variations of cooking habits, ingredient types, and dietary cultures in different human populations. One challenging problem is automatic segmentation of the foods with textures and colors similar to their container (e.g., rice and white plate). To handle this issue, other physical features such as infrared radiation, instead of image features, may be required for discriminating the foods from the plate. Moreover, if the eating environment does not contain any known-size referent, it is extremely difficult, if not impractical, to recover the metric scale of food volume measurement that the subject has taken.
4. Conclusion
We have presented a new model-based framework to segment food items from single-view images, register a 3D geometric shape model to the segmentation result, and then estimate food volume based on the registered shape model. This framework has several advantages over the conventional methods. First, we combined the adaptive thresholding algorithm with edge-based snake deformation to efficiently segment foods with multi-color textures. Second, our registration method adopted global shape properties of the 3D food object to compensate the insufficiency of spatial information in a single-view 2D image. Third, during the registration process, the localization result of the food plane was utilized to reduce the solution domain and derive the pose parameters of the 3D shape model from the single-view 2D image. Fourth, the proposed system efficiently recovered the metric scale of the food volume by using a new circular reference approach which integrates the parameters of camera, image and physical food coordinate systems. Our experiments have demonstrated that this framework can provide an average error of 3.69% in food volume estimation despite the incomplete volumetric information in the single-view 2D image. More importantly, this method has been generalized to common foods by utilizing a 3D shape model library which contains both regularly and irregularly shaped models. In the future, we plan to combine different models to further improve food volume estimation results.
Acknowledgments
This work was supported in part by the National Institutes of Health grant U01 HL91736 (PI, the last author) and R01CA165255 (PI, the last author) and a scholarship support from the National Science Council, Taiwan, R.O.C. awarded to the first author.
References
- 1.Key TJ, Schatzkin A, Willett WC, Allen NE, Spencer EA, Travis RC. Diet, nutrition and the prevention of cancer. Public Health Nutrition. 2004;7:187–200. doi: 10.1079/phn2003588. [DOI] [PubMed] [Google Scholar]
- 2.Goris AH, Westerterp-Plantenga MS, Westerterp KR. Undereating and underrecording of habitual food intake in obese men: selective underreporting of fat intake. The American Journal of Clinical Nutrition. 2000;71:130–134. doi: 10.1093/ajcn/71.1.130. [DOI] [PubMed] [Google Scholar]
- 3.Livingstone MBE, Robson PJ, Wallace JMW. Issues in dietary intake assessment of children and adolescent. British Journal of Nutrition. 2004;92:S213–S222. doi: 10.1079/bjn20041169. [DOI] [PubMed] [Google Scholar]
- 4.Boushey CJ, Kerr DA, Wright J, Lutes KD, Eber DS, Delp EJ. Use of technology in children’s dietary assessment. European Journal of Clinical Nutrition. 2009;63:S50–S57. doi: 10.1038/ejcn.2008.65. [DOI] [PMC free article] [PubMed] [Google Scholar]
- 5.Arab L, Estrin D, Kim DH, Burke J, Goldman J. Feasibility testing of an automated image-capture method to aid dietary recall. European Journal of Clinical Nutrition. 2011;65:1156–1162. doi: 10.1038/ejcn.2011.75. [DOI] [PMC free article] [PubMed] [Google Scholar]
- 6.Sun M, Yao N, Hackworth SA, Yang J, Fernstrom JD, Fernstrom MH, Sclabassi RJ. A human-centric smart system assisting people in healthy diet and active living. Proceedings of International Symposium of Digital Life Technologies: Human-Centric Smart Living Technology; Tainan, Taiwan. 2009. [Google Scholar]
- 7.Bai Y, Li C, Jia W, Li J, Mao ZH, Sun M. Designing a wearable computer for lifestyle evaluation. Proc 38th Annual Northeast Bioengineering Conference; Philadelphia, PA, USA. 2012. [DOI] [PMC free article] [PubMed] [Google Scholar]
- 8.Zhang H, Li Y, Hackworth SA, Yue Y, Li C, Yan G, Sun M. The design and realization of a wearable embedded device for dietary and physical activity monitoring. Proc 3rd International Symposium on Systems and Control in Aeronautics and Astronautics; Harbin, China. 2010. pp. 123–126. [Google Scholar]
- 9.Bodner-Montville J, Ahuja JKC, Ingwersen LA, Haggerty ES, Enns CW, Perloff BP. USDA food and nutrient database for dietary studies: released on the web. Journal of Food Composition and Analysis. 2006;19:S100–S107. [Google Scholar]
- 10.Puri M, Zhu Z, Yu Q, Divakaran A, Sawhney H. Applications of Computer Vision. Snowbird, UT: 2009. Recognition and volume estimation of food intake using a mobile device; pp. 1–8. [Google Scholar]
- 11.Kong F, Tan J. Automatic dietary assessment with mobile camera phones. Journal Pervasive and Mobile Computing. (Accepted for publication) [Google Scholar]
- 12.Mrey D, Pedreschi F. Segmentation of colour food images using a robust algorithm. Journal of Food Engineering. 2005;66:353–360. [Google Scholar]
- 13.Zhu F, Bosch M, Woo I, Kim SY, Boushey CJ, Ebert DS, Delp EJ. The use of mobile devices in aiding dietary assessment and evaluation. IEEE Journal of Selected Topics in Signal Processing. 2010;4:756–766. doi: 10.1109/JSTSP.2010.2051471. [DOI] [PMC free article] [PubMed] [Google Scholar]
- 14.Zhu F, Bosch M, Khanna N, Boushey CJ, Delp EJ. Multilevel segmentation for food classification in dietary assessment. 7th International Symposium on Image and Signal Processing and Analysis (ISPA); 2011. pp. 337–342. [PMC free article] [PubMed] [Google Scholar]
- 15.Sun M, Liu Q, Schmidt K, Yang J, Yao N, Fernstrom JD, Fernstrom MH, Delany JP, Sclabassi RJ. Determination of food portion size by image processing. 30th Annual International IEEE EMBS Conference; Vancouver, British Columbia, Canada. 2008. pp. 871–874. [DOI] [PubMed] [Google Scholar]
- 16.Chae J, Woo I, Kim SY, Maciejewsku R, Zhu F, Delp EJ, Boushey CJ, Ebert DS. Volume estimation using food specific shape templates in mobile image-based dietary assessment. Proceeding of SPIE. 2011;7873:78730K. doi: 10.1117/12.876669. [DOI] [PMC free article] [PubMed] [Google Scholar]
- 17.Fellegari R, Navid H. Determining the orange volume using image process. International Conference on Food Engineering and Biotechnology (IPCBEE); 2011. pp. 180–184. [Google Scholar]
- 18.Koc AB. Determination of watermelon volume using ellipsoid approximation and image-processing methods. Postharvest Biology and Technology. 2007;45:366–371. [Google Scholar]
- 19.Rashidi M, Gholami M. Determination of kiwifruit volume using ellipsoid approximation and image-processing methods. International Journal of Agriculture & Biology. 2008;10:375–380. [Google Scholar]
- 20.Jia W, Yue Y, Fernstrom JD, Yao N, Sclabassi RJ, Fernstrom MH, Sun M. Image-based estimation of food volume using crcular referents in dietary assessment. Journal of Food Engineering. 2012;109:76–86. doi: 10.1016/j.jfoodeng.2011.09.031. [DOI] [PMC free article] [PubMed] [Google Scholar]
- 21.Zhang Z. A flexible new technique for camera calibration. IEEE Transaction on Pattern Analysis and Machine Intelligence. 2000;22:1330–1334. [Google Scholar]
- 22.Bentley JL. Multidimensional binary search trees used for associative searching. Communications of the ACM. 1975;18:509–517. [Google Scholar]
- 23.Otsu N. A threshold selection method from gray-Level histograms. IEEE Transactions on Systems, Man, and Cybernetics. 1979;9:62–66. [Google Scholar]
- 24.Andrew AM. Another efficient algorithm for convex hulls in two dimensions. Information Processing Letters. 1979;9:216–219. [Google Scholar]
- 25.Gevers T, Ghebreab S, Smeulders AWM. Color invariant snakes. British Machine Vision Conference.1998. [Google Scholar]
- 26.Gonzalez RC, Woods RE. Digital Image Processing. 3. Prentice Hall; 2007. [Google Scholar]
- 27.Toet A. Technical report, CALMA project. 1994. Target detection and recognition through contour matching. [Google Scholar]
- 28.Zou KH, Warfield SK, Bharatha A, Tempany CM, Kaus MR, Haker SJ, Wells WM, Jolesz FA, Kikinis R. Statistical validation image segmentation quality based on a spatial overlap index. Academic Radiology. 2004;11:178–189. doi: 10.1016/S1076-6332(03)00671-8. [DOI] [PMC free article] [PubMed] [Google Scholar]
- 29.Godwin SL, Chambers E, Cleveland L. Accuracy of reporting dietary intake using various potion-size aids in-Person and via telephone. Journal of the American Dietetic Association. 2004;104:585–594. doi: 10.1016/j.jada.2004.01.006. [DOI] [PubMed] [Google Scholar]
- 30.Rahman MH, Li Q, Pickering M, Bouchey C, Delp E. Food volume estimation in a mobile phone based dietary assessment system. 8th International Conference on Signal Image Technology and Internet Based Systems; 2012. pp. 988–995. [Google Scholar]
- 31.Lee C, Chae J, Schap T, Kerr D, Delp E, Eber D, Boushey C. Comparison of known food weights with image-based portion-size automated estimation and adolescents’ self-reported portion size. Journal of Diabetes Science and Technology. 2012;6:428–434. doi: 10.1177/193229681200600231. [DOI] [PMC free article] [PubMed] [Google Scholar]
- 32.Chen YJ, Li YC, Huang KN, Jen SL, Young MS. Video tracking algorithm of long-term experiment using stand-alone recording system. Review of Scientific Instruments. 2008;79:085108. doi: 10.1063/1.2976035. [DOI] [PubMed] [Google Scholar]
- 33.Li Z, Sun M, Chen HC, Li J, Wang K, Jia W. Distortion correction in wide-angle images for picture-based food portion size estimation. Proc 38th Annual Northeast Bioengineering Conference; Philadelphia, PA. 2012. [Google Scholar]