

Abstract
OBJECTIVE
To present a novel methodology that uses a laser range scanner (LRS) capable of generating textured (intensity-encoded) surface descriptions of the brain surface for use with image-to-patient registration and improved cortical feature recognition during intraoperative neurosurgical navigation.
METHODS
An LRS device was used to acquire cortical surface descriptions of eight patients undergoing neurosurgery for a variety of clinical presentations. Textured surface descriptions were generated from these intraoperative acquisitions for each patient. Corresponding textured surfaces were also generated from each patient’s preoperative magnetic resonance tomograms. Each textured surface pair (LRS and magnetic resonance tomogram) was registered using only cortical surface information. Novel visualization of the combined surfaces allowed for registration assessment based on quantitative cortical feature alignment.
RESULTS
Successful textured LRS surface acquisition and generation was performed on all eight patients. The data acquired by the LRS accurately presented the intraoperative surface of the cortex and the associated features within the surgical field-of-view. Registration results are presented as overlays of the intraoperative data with respect to the preoperative data and quantified by comparing mean distances between cortical features on the magnetic resonance tomogram and LRS surfaces after registration. The overlays demonstrated that accurate registration can be provided between the preoperative and intraoperative data and emphasized a potential enhancement to cortical feature recognition within the operating room environment. Using the best registration result from each clinical case, the mean feature alignment error is 1.7 ± 0.8 mm over all cases.
CONCLUSION
This study demonstrates clinical deployment of an LRS capable of generating textured surfaces of the surgical field of view. Data from the LRS was registered accurately to the corresponding preoperative data. Visual inspection of the registration results was provided by overlays that put the intraoperative data within the perspective of the whole brain’s surface. These visuals can be used to more readily assess the fidelity of image-to-patient registration, as well as to enhance recognition of cortical features for assistance in comparing the neurotopography between magnetic resonance image volume and physical patient. In addition, the feature-rich data presented here provides considerable motivation for using LRS scanning to measure deformation during surgery.
Keywords: Brain shift, Cortical surface, Image-guided surgery, Registration, Visualization
Image-guided neurosurgical techniques have been developed to provide additional spatial reference during surgery. In the past, these positional cues have been provided by correlating a three-dimensional (3D) digitized point within patient space (touching the brain surface with a stylus) to the corresponding point within image space (usually simultaneously rendered on three orthogonal/cardinal slices and one isometric view of the preoperative image volume). Complementary technologies have been created to improve landmark recognition, which include multimodal image fusion, modifications to operating microscopes, virtual head-mounted displays, and enhanced-reality visualization, among others (4, 6–10, 12, 16, 25, 31, 33). Although an impressive myriad of technology has been developed, there has been little quantitative documented benefit with respect to outcome or improved surgical performance. Whereas texturing laser range scanning (tLRS) technology could be seen as another in a list of these innovations, tLRS may have greater potential in that it may facilitate compensation for intraoperative tissue deformation during image-guided surgery (IGS), i.e., the brain shift problem (18, 20). Combined with the low cost of laser optics and charge-coupling device (CCD) arrays, tLRS technology presents an interesting adjunct for IGS work.
In brief, a tLRS system passes a laser stripe over the surface of interest while collecting the reflected light with a high-resolution CCD camera. Through the process of triangulation, the data acquired can be interpreted to reconstruct the 3D surface as a cloud of digitized points. The “texturing” nomenclature refers to a relatively novel feature whereby a second digital image of the field of view (FOV) is acquired at the time of scanning and is subsequently mapped to the 3D geometric point cloud. As a result, a representation of data is captured that contains both geometric and intensity information, i.e., a “textured” brain surface, the shape and visual features of which are associated with the FOV.
Textured surfaces can provide many cues that aid in object recognition and localization, including information about depth, curvature, the orientation of surfaces, and distances between object features (23). For example, the benefit of adding texture to shape information in the field of face recognition is well established (3, 21, 22, 29). Except for some limited studies using vessel bifurcations for image-to-patient registration and point-based brain shift measurement (19, 24), cortical surface texture methods have not been studied with respect to neurosurgical navigation. Nonetheless, several findings from face recognition research may apply to neuronavigation. One of the most important of these is that the recognition speed of features can be enhanced by texture. Similarly, the orientation of the textured surface is important and it may be favorable to use tLRS displays that are reflective of an egocentric reference relevant to the viewer (29, 30). Furthermore, animation and dynamic viewing may be important enhancements for recognition. With respect to visualizing brain shift, it may be more effective for a surgeon to see a dynamic rendering of the tLRS cortical surface to appreciate the degree of motion (11, 13). Given the localized, feature-rich nature of the brain surface (i.e., non-diffuse features), the use of tLRS data should reduce view-point dependencies.
Despite the abundance of recognition research performed, previous work does not entirely apply to IGS visualization. The alignment of cortical tLRS data to a segmented magnetic resonance (MR) grayscale encoded volume rendering of the brain represents two completely different visual modalities. The difference in the geometric and textural representation of these surfaces requires an inherent pattern recognition task that is significantly different. Another dissimilarity is that recognition experiments often involve a learning and testing phase in which the recognition objects contain the same localized features (e.g., geometric structures of subjects do not change, only their pose). In IGS, the exposed cortical surface cannot be visualized before surgery and is markedly dissimilar in texture and appearance than the MR image counterpart (which can be studied preoperatively). This represents a fundamentally more challenging feature recognition task. However, this difficulty may be significantly offset by the level of expertise in the testing population (neurosurgeons).
We conducted a clinical study to assess the extent to which tLRS technology can be used in the operative setting and report the utility of this unique data and the enhanced visualization it provides. We examined two points in this preliminary, prospective clinical study. First, we quantitatively examined a series of image-to-patient registrations in near real-time to assess the fidelity of this registration process. Second, we investigated whether our novel tLRS-to-MR image volume displays could enhance navigational and cortical surface recognition. Our findings suggest that tLRS technology may allow surgeons to better evaluate the fidelity of image-to-patient registration and that tLRS can accurately provide anatomic cues for cortical recognition assistance, which will provide for real-time assessment of intraoperative brain shift.
METHODS
Eight patients (six men; mean age, 48.4 ± 15.6 yr) with brain tumors (primary or metastatic) or medically-intractable mesial temporal lobe epilepsy were included in this study (Table 1). All patients were enrolled after obtaining written informed consent for participation in this study, which was approved by the Institutional Review Board of the Vanderbilt University School of Medicine.
TABLE 1.
Patient and intraoperative characteristicsa
| Patient no. | Age (yr)/sex | Diagnosis | Craniotomy (diameter, cm) | Position | Orientation up (deg)/turn (deg) | Anesthesia | Diuretic type | Resection | Lesion Size (cm) |
|---|---|---|---|---|---|---|---|---|---|
| 1 | 37/M | OA-II | L posterior (9.2) | S | 15/25 to R | A | M | GTR | 3.0 × 3.0 × 2.0 |
| 2 | 34/M | Ganglioglioma | L inferior (4.2) F-T | S | 15/45 to R | A | M | GTR | 2.6 × 2.0 × 1.8 |
| 3 | 50/F | Metastatic Cancer | R posterior (4.6) F | S | 15/15 to R | A | M | GTR | 2.5 × 2.5 × 2.0 |
| 4 | 23/M | Temporal lobe epilepsy | L F-T (6.8) | S | 15/75 to R | G | M, Fd | ATL+AHC | 5.0 × 5.0 × 5.0 |
| 5 | 52/M | GBM | L F-P behind motor strip (7.6) | S | 30/15 to R | A | M | GTR | 3.5 × 3.0 × 3.0 |
| 6 | 26/M | Ganglioglioma | R temporal (8.3) | S | 15/75 to L | A | M | ATL | 5.0 × 5.0 × 5.0 |
| 7 | 64/M | GBM | R Parietal (7.1) | S | 30/25 to L | A | M | NTR | 5.5 × 4.5 × 4.0 |
| 8 | 61/M | Meningioma | L posterior (7.0) F-T | S | 15/25 to L | A | M | GTR | 5.8 × 5.1 × 4.2 |
deg, degree; OA-II, oligoastrocytoma; L, left; S, supine; R, right; A, awake craniotomy; M, mannitol (dose, 1 gm/kg of body weight to maximum of 100 grams); GTR, gross total resection; F-T, frontotemporal; F, frontal; G, craniotomy under general anethesia; Fd, furosemide (dose, 0.25 mg/kg of body weight, to a maximum of 40 mg); ATL, anterior temporal lobectomy; AHC, mygdalohippocampectomy; NTR, near total resection.
All patients were imaged using a 1.5T magnetic resonance imaging scanner the day before surgery (GE Systems, Milwaukee, WI) with integration of 1.5 mm thick axial, gadolinium-enhanced T1-weighted images into a Stealth Station (Medtronic, Minneapolis, MN). After anesthetic induction, the patients were positioned on the operating room table and were secured to the table using the Mayfield three-pin head holder (Ohio Medical, Cincinnati, OH). The frameless stereo-tactic system was calibrated and confirmed. All patients received diuretics (mannitol, 0.5–1.0 g/kg) and steroids (dexamethasone) immediately before incision. Furosemide was used if additional diuresis was required. Surgery was then performed and laser range scanner (LRS) surfaces were obtained after durotomy, but before tumor resection. The laser range scanner used is the Model 200C Real Scan (3D Digital Corp., Sandy Hook, CT). Defined cortical landmarks, such as the veins of Trolard or Labbe or the veins of the Sylvian fissure were identified for each patient by visual inspection and recorded using a digital camera. All patients underwent craniotomy for tumor resection or epilepsy, with cortical mapping. Cranial flap sizes were determined solely by clinical factors. All patients were neurologically stable or improved immediately after surgery and no new deficits developed. No side effects related to participating in this study were noted.
Intraoperative Range Data Acquisition
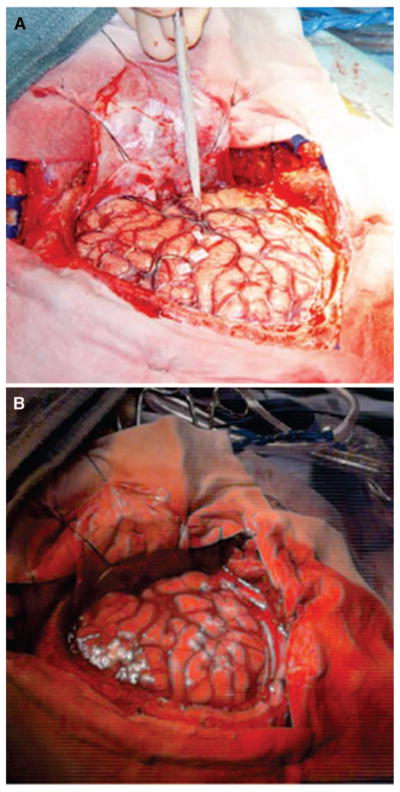
During surgery, the LRS (Fig. 1A) was brought into the surgical FOV to acquire range data of the cortical surface at the surgeon’s discretion. The scanner was mounted on a monopod stand retrofitted with a vibration damping base. In its most compact form, the monopod mount stands 4 feet in height, but may be extended to more than 6 feet. The monopod mount provides the standard degrees of freedom (yaw, pitch, and roll) for accurate alignment of the surgical FOV and the LRS. During acquisition, the monopod mount was placed near the surgical FOV. The stand was extended and yaw, pitch, and roll were adjusted to bring the scanner’s acquisition camera to within 25 to 35 cm of the exposed cortical surface in a normal direction. The scanning extents (left and right scanning margins) were adjusted to encompass the craniotomy. At this point, minor calibration may have been required for the lighting conditions in the operating room (17). After set up and calibration, a vertical laser stripe emitted from the LRS was passed over the exposed cortical surface and range data points were sampled as it passed from the left to right extent. Immediately after range data acquisition, a digital image of the surgical FOV was acquired by the LRS for the texturing process. After the scan the monopod was removed and the surgery proceeded. The entire scanning process (set up, calibration, scan) requires approximately 1 to 2 minutes per scan.
FIGURE 1.

A, the laser range scanner used to generate tLRS point clouds. B, given the surgical FOV in the upper row, the bottom row shows three representations of the data generated by the scanner. From left to right: the point cloud, the range data encoded as colors, and the textured point cloud. C, schematic showing the texturing process using the information provided by the scanner. D, a textured point cloud generated from a preoperative MR volume.
At the conclusion of each acquisition, the scanner generates five-dimensional data representing the geometry and intensity pattern of the cortical surface. An example dataset acquired by the LRS is demonstrated in Figure 1B. The first three dimensions are the x, y, and z coordinates of the LRS sampled cortical surface. The remaining two dimensions, u and v, of the LRS data are dedicated to mapping intensity information in the digital image of the surgical FOV to the range data. Standard computer graphics techniques of texture mapping are used to encode each geometric point with a corresponding color from the digital image of the surgical FOV (Fig. 1C) (5).
LRS Dataset Registration to Preoperative Images
After the intraoperative datasets were obtained, rigid-body registration was performed to align them with the preoperative image data. Registration provides an initial step towards incorporating the intraoperative data within an IGS framework. Related work with the LRS uses serial range datasets to measure cortical shift automatically (27); the cortical shift measurements can subsequently be used in a model-based compensation scheme that can predict subsurface brain shift. Nonetheless, the methods outlined in this report demonstrate the ability of the LRS to provide anatomic cues within the context of data provided by the preoperative images.
Registration of the intraoperative LRS data with preoperative image data necessitated the generation of textured surfaces from preoperative MR tomograms. Manually segmented MR tomograms were subjected to a marching cubes tessellation and radial-basis function smoothing to generate a faceted surface representation of the brain image volume with smooth surface normals. A ray-casting process was used to encode a surface texture onto the smooth polygonal brain surface mesh (17). The end result of this process is shown in Figure 1D.
After generating corresponding datasets, three registration algorithms were used to align the intraoperative scene to its preoperative counterpart and results from each registration algorithm were examined. The first registration method was alignment by minimizing the distance between manually localized surface landmarks in each textured surface through a Procrustes’ least-squares fitting (point-based registration [PBR]) (1, 26). This is similar to the method described by Nakajima et al. (19) for organ-based registration.
The second registration method is the iterative closest point (ICP) algorithm that uses geometry information to register surfaces (2). The ICP algorithm works by determining correspondence between surfaces based on the closest points and then registering via Procrustes’ alignment using the determined correspondence. This process of determining correspondence and Procrustes’ alignment is iterated upon until a termination criteria, such as minimal surface to surface distance, is met.
The final registration protocol is the SurfaceMI (SMI) algorithm which uses both geometry and intensity information to align textured surfaces (17). The SMI algorithm uses closest point criteria to determine corresponding points in the two textured surfaces being registered. Once correspondence has been established, mutual information (14, 32) of the intensities in each point cloud is determined as a measure of registration accuracy. This method is described in previous reports (17, 28). For this study, the SMI algorithm was extended to use a multiscale/resolution paradigm described by Sinha (28).
It should be noted that each registration method tested here is capable of being used, in real-time, within an operating room environment. Each registration process takes on the order of minutes including any preprocessing required for the intraoperative tLRS data. The scale of intraoperative brain shift is significantly longer when compared with the time required to generate registration results and visualizations based on tLRS data. Thus, the use of tLRS and the aforementioned registration methods are amenable to current operative conditions.
Because a “ground-truth” measure of registration was not available at the time of acquisition for each of the patients, the results in this study are assessed visually. For patients with striking features in both preoperative MR textured surfaces and intraoperative textured LRS surfaces, those features were highlighted manually and used to assist in visual assessment of registration accuracy. Furthermore, a feature registration measure is reported for the quality of alignment of these features.
RESULTS
For each patient, the three registration methods were used. However, for brevity and space considerations, only a few representative registrations are demonstrated. In each case, a preoperative and intraoperative (pre-resection) tLRS surface map was obtained. Appropriate landmarks, such as cranial bone edges, cortical veins, sulci, gyri, or the tumor itself, which could be definitively identified on preoperative MR and the intraoperative surgical FOV, were used as reference landmarks.
Intraoperative Acquisition
Figures 2 to 4 demonstrate representative cases of the intra-operative surgical FOV, the textured surface generated from the preoperative MR tomogram, and the segmented intraoperative textured LRS surface.
FIGURE 2.

Patient 1. A, intraoperative high-resolution digital image showing the surgical FOV. The vein of Trolard is highlighted with the forceps. The tumor of interest is just behind the forceps in the image, signified by the heightened vascularization. Preoperative MR textured surface (B) and intraoperative textured LRS surface (C). The vein of Trolard and the tumor region has been indicated in both images.
FIGURE 4.

Patient 3. A, intraoperative high-resolution image showing the surgical FOV with the tumor highlighted using forceps. B, intraoperative high-resolution image showing a significant vessel highlighted. Preoperative MR textured surface (C) and intraoperative textured LRS surface (D). The tumor and vessel highlighted in the digital photographs has been manually highlighted in each textured surface image.
For all patients, the LRS datasets captured significant features in the surgical FOV. Major vessels exposed in the craniotomy were captured in the LRS texture maps and were successfully encoded to the surface point clouds. Concomitantly, sulci, which manifest as dark grooves in the exposed FOV, were also transposed to the surface point cloud. Corresponding features in the textured MR surfaces were seen in all patients. Significant corresponding structures are highlighted for clarity in Figures 2 to 4. In Figure 2B, the tumor shows up as a shadowy area anterior to the vein of Trolard. The corresponding area is highlighted in the tLRS dataset (Fig. 2C). Another sulcal landmark is also evident in both textured MR dataset and tLRS just posterior to the tumor region. Figure 3 shows the relationship between a significant vessel and tumor in the surgical FOV for another patient. However, unlike the previous dataset, the tumor manifests as a brighter area in the preoperative MR textured surface (Fig. 3C). The data in Figure 4 also demonstrate structures similar to those seen in the previous two images. Figure 4C shows another example in which the tumor margins are clearly evident in the preoperative MR, whereas the tumor manifests more as a geometric bulge in the intraoperative tLRS data (Fig. 4D). All other cases demonstrated similar correspondences in surface textures between the preoperative MR data and the intraoperative tLRS datasets.
FIGURE 3.

Patient 2. A, intraoperative high-resolution image showing the surgical FOV with the tumor highlighted using forceps. B, intraoperative high-resolution image showing a significant vessel highlighted. Preoperative MR textured surface (C) and intraoperative textured LRS surface (D). The tumor and vessel highlighted in the digital photographs has been manually highlighted in each textured surface image.
Registration Results
Root mean square (RMS) fiducial registration error (FRE) (15) from the PBR registration results are presented in Table 2. RMS FRE measures the closeness-of-fit of the fiducial sets for the PBR. A low RMS FRE for the PBR registrations presented in this study implies good localization of corresponding surface fiducials in each textured surface, as well as a good registration between the two surfaces based on the fiducials. A high RMS FRE implies poor or incorrect localization of surface fiducials in the two clouds, or significant brain shift has occurred upon duratomy. The lowest RMS FRE was seen in Patient 3, who had an RMS FRE of 1.8 mm. The highest RMS FRE was seen in Patient 4, who had an RMS FRE of 7.2 mm with five fiducials. Removal of the fiducial with worst localization error reduced the RMS FRE for Patient 4’s registration to 1.6 mm, which reduced the average RMS FRE over all patients to 3.3 ± 1.5 mm.
TABLE 2.
Registration results of all patientsa
| Patient no. | RMS FRE in mm (no. of fiducials) |
|---|---|
| 1 | 5.4 (5) |
| 2 | 4.9 (5) |
| 3 | 1.8 (4) |
| 4 | 7.2 (5) |
| 5 | 2.4 (4) |
| 6 | 4.7 (4) |
| 7 | 2.8 (4) |
| 8 | 3.3 (3) |
| Average | 4.1 ± 1.8 (4) |
RMS, root mean square; FRE, fiducial registration error.
Feature registration accuracy (FtRA) for each patient are shown in Table 3. FtRA was calculated as the RMS closest point distance, in millimeters, between corresponding, manually highlighted features in the preoperative MR textured surface and textured LRS dataset. FtRA is subject to highlighting errors, but is a reasonably good metric to measure registration performance of each method relative to each other. The three columns in the table correspond to the feature registration accuracy given a particular registration method. In general, the ICP registration method provided the most accurate feature registration with a mean RMS feature registration accuracy of 2.0 ± 0.9 mm across all patients. SMI registration provided the least feature registration accuracy with a mean RMS measure of 6.8 ± 10.8 mm.
TABLE 3.
Feature registration accuracy for each patienta
| Patient no. | Feature registration error for each registration method (mm)
|
||
|---|---|---|---|
| PBR | ICP | SMI | |
| 1 | 1.2 | 1.8 | 1.8 |
| 2 | 2.3 | 1.3 | 33.1 |
| 3 | 0.6 | 0.7 | 0.8 |
| 4 | 1.1 | 1.4 | 2.3 |
| 5 | 3.8 | 2.3 | 4.7 |
| 6 | 2.1 | 3.0 | 2.7 |
| 7 | 2.6 | 1.9 | 2.8 |
| 8 | 2.9 | 3.4 | 6.5 |
| Average | 2.1 ± 1.1 | 2.0 ± 0.9 | 6.8 ± 10.8 |
PBR, point-based registration; ICP, iterative closest point; SMI, surface MI.
Registration visualizations for all patients are shown in Figure 5. Enhanced visualizations are shown in Figure 6. For brevity and space considerations, only one registration method (i.e., PBR, ICP, or SMI) was chosen to be visualized for each patient. Each registration demonstrated in these figures shows the successful overlay of intraoperative data with pre-operative image information.
FIGURE 5.
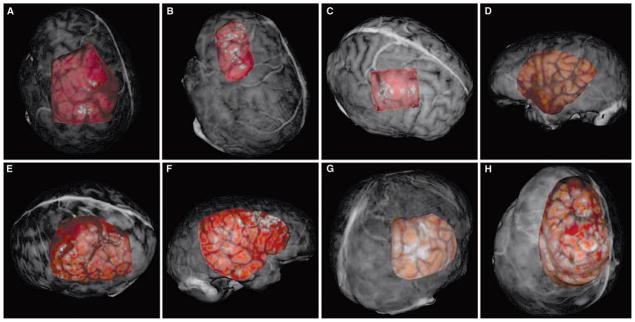
A–H, registration results for each patient presented as overlays to the textured surfaces from the preoperative MR scans. A, Patient 1, PBR; B, Patient 2, ICP; C, Patient 3, SMI; D, Patient 4, PBR; E, Patient 5, ICP; F, Patient 6, SMI; G, Patient 7, ICP; H, Patient 8, PBR.
FIGURE 6.

A–D, enhanced registration results for select patients. The selected overlays have been enhanced by manually highlighting corresponding significant vessel and sulcal patterns before registration. The alignment of the highlighted pattern via registration provides a sense of registration accuracy. A, Patient 1, PBR; B, Patient 2, ICP; C, Patient 3, SMI; D, Patient 7, ICP.
The results for rigid registration of the intraoperative data to preoperative data for Patient 1 are shown in Figures 5A and 6A. The PBR registration provided good correlation of surface features in both surfaces; this is seen by the good alignment of the vein of Trolard and the sulcal groove just posterior. These significant features are highlighted in Figure 6A and help discern the registration performance of the PBR registration on this patient data. The FtRA for the PBR registration on this patient was the lowest (1.2 mm) of the three registration methods. The rigid-registration results for Patient 2 are shown in Figures 5B and 6B. While all three registration methods provided accurate results, the ICP registration provided the most accurate alignment of surface features (FtRA, 1.3 mm). The tumor and vessel just posterior are the most significant structures in each dataset for Patient 2 and both of these structures are aligned correctly in the registered view. In Figure 6B, the vessel structure just posterior to the tumor margin has been highlighted artificially in both datasets to provide insight into the registration accuracy provided by the ICP registration. Patient 3’s rigid registration results (Figs. 5C and 6C) showed excellent results for the SMI registration. The SMI registration demonstrates the ability for texture based registration to perform accurately on intraoperative data (FtRA, 0.8 mm). The dark vessel structure in the intraoperative LRS data is aligned well with the corresponding bright vessel in the preoperative dataset. The registration results for Patient 4 demonstrated a successful registration of LRS data acquired on the temporal region of the brain (Fig. 5D). Patient 5’s registration results are shown in Figure 5E. In this patient, it seems as though ICP registration performed the best at aligning features in each surface (FtRA, 2.3 mm). The results from Patient 6 (Fig. 5F) show the second case performed in the temporal region of the brain registered via SMI. Patient 7’s registration ICP results are shown in Figure 5G. Close inspection of corresponding features in both surfaces show that the ICP registration process accurately registered the two surfaces (Fig. 6D). Patient 8’s results demonstrate the ability to align the feature rich, textured surfaces for a demanding dataset. Figure 5H shows the result of the PBR registration technique on the datasets for this patient. The preoperative dataset was mostly devoid of relevant surface features (i.e., vessel and sulcal patterns) near the surgical FOV.
DISCUSSION
The intraoperative acquisition results from this study demonstrate the ability of laser-range scanning to be used in an operative neurosurgical environment. Our LRS device was amenable to various surgical approaches and provided relevant surface data in every case tested. All intraoperative data acquired by the LRS device resembled, in shape and feature, the surgical FOV examined. Vessel and sulcal patterns evident on the surface of the brain during surgery were captured quickly using the LRS device, with minimal impact to the progress of surgery. In all cases, the LRS acquired significant features of the brain surface highlighted by the surgeon in the digital images (Figs. 2, 3, and 4).
Incorporation of the textured LRS dataset to preexisting imaging modalities, such as MR tomograms, was achieved using three independent registration techniques: PBR, ICP, and SMI, a novel surface/intensity registration method. All three registration methods provided visually compelling results across all patients. PBR generally provided the most consistent alignment of the two textured surfaces. The low mean RMS FRE (having removed the outlier fiducial in Patient 4) provided by PBR registration on all patients (i.e., 3.3 ± 1.5 mm) demonstrates that corresponding fiducials could be localized and registered accurately in both textured surface sets. This mean RMS FRE is also in close agreement with FRE measurements provided by Nakajima et al. (19) for landmark-based registration of the cortical surface.
The feature registration measures calculated using the manually highlighted vasculature provide enhanced understanding of each registration method’s performance in aligning the intraoperative data to the preoperative data. In general, both PBR and ICP performed equally well in aligning the corresponding data-sets. SMI registration was less accurate than PBR and ICP. For example, Patient 2 exhibited a clear outlier in the SMI registration. In this patient, the SMI registration method gravitated towards a nearby feature set that resembled the true target features. This type of misregistration highlights a potential area of enhancement with the SMI registration method, i.e., local minima based on similar intensity patterns near each other. Future work on the SMI registration method may require augmented feature information sets, such as vessel structure and sulcal geometry, for accurate registration. We are currently developing algorithms that couple the geometry and intensity features more intimately during registration. Removing the SMI result from Patient 2 as an outlier brings the mean RMS feature registration accuracy down to 3.1 ± 1.9 mm, a result marginally less accurate than the ICP or PBR registration methods. With every registration comparison presented here (FRE or FtRE), the accuracy is subject to some localization error. For example, vessel patterns do not present exactly the same with respect to feature width and depth between the two modalities (gadolinium-enhanced MR and color digital images). Designating these features within the MR image volume is dependent on the segmentation, surface fitting process, and the level of gadolinium contrast. In addition, the corresponding features in the LRS cloud are subject to inaccuracies in the scanning process, surface fitting and interpolation errors of the point cloud, and increased size owing to the addition of vessel wall width. In fact, in phantom results presented previously (17), it was found that SMI outperformed the other two methods. In light of this, we are currently working on implementing an independent tracking system into the surgical theater that will allow us to carry out intraoperative validation of each registration method. Nonetheless, the current results are encouraging in that all three registration methods provide transformations that are very similar to each other based on the low feature registration errors, as well as to those seen with surface-based registration systems.
Additional potential areas of research that will improve the clinical utility of LRS include technical advances in the design and implementation of the LRS device for real-time assessment of intraoperative brain shift. One LRS enhancement is improved camera optics, similar to those in the digital camera, used to gather images of the surgical FOVs. Comparing the results of a digital photograph of the operative scene with a corresponding texture image of the same FOV shows that the texture image does not resolve the FOV, in terms of fine features, as well as the digital image (Fig. 7). Furthermore, the color contrast between the vessels and sulcal grooves has been reduced such that both surface features are approximated by the same color in the LRS texture. These limitations in the texture image may account for an incorrect global optimum for mutual information and the lower accuracy using SMI in some cases.
FIGURE 7.
Comparison of the digital image quality versus texture image quality provided by the LRS device. A, high-resolution digital image of the surgical FOV. B, texture image of the same FOV. Notice the lack of resolution in the texture image of the surgical FOV. Specifically, fine vessels present in the digital image are masked in the texture image.
In addition to the results presented by each method of registration, the results in Figure 5 are important with respect to the enhancement of anatomic visualization provided by LRS technology. With current approaches to IGS, neurosurgeons often develop a surgical treatment plan by studying the patient’s MR tomogram as a segmented reconstructed gray-scale encoded volume rendering. By visualizing the segmented brain in its three-dimensional state with the MR gray-scale providing anatomic landmarks, the surgeon can identify potentially sensitive, eloquent cortical regions. Unfortunately, these regions are often difficult to recognize intraoperatively owing to the lack of landmark recognition within the surgeon’s FOV, i.e., the intraoperative presentation of the cortical surface requires adjunct methods such as cortical stimulation or intraoperative MR imaging, which can be time consuming, expensive, or available only at specialized referral centers. Although overlays of virtual anatomy have been performed on patients using special displays (8, 9), the work presented here is unique in the degree of correspondence provided between the intraoperative three-dimensional cortical surface and the patient’s MR tomogram. Textured LRS data provide an excellent method to quantitatively record the visual and geometric characteristics of the surgeon’s FOV. It may become especially relevant in the future to permit more focused operative approaches to critical or eloquent cortical targets. The functionality of this data is shown in Figure 5, A–H in two critical aspects: 1) by quantitatively correlating preoperative cortical surface imaging data (MR, fMR, NIR, EEG/MEG, etc.) to the surgeon’s FOV through the process of registration and 2) by providing new anatomic cues to the surgeon during surgery that can assist in navigation.
An extension to the scanning protocol and visualization system presented is the determination of brain surface shift during surgery using serial tLRS measurements (28). Serial acquisitions of the brain surface during surgery, if registered, can be used to determine the motion of the surface over the course of surgery. When used as a feedback system for current image-guided surgery systems, the calculated shift can update position of navigational aids with respect to brain shift. We are currently developing and validating a shift-tracking protocol using the LRS in the operating room. Although more research is still needed to make the technology completely compatible with today’s operating rooms, the visual assistance provided by textured LRS technology warrants continued consideration as essential equipment for neuronavigation.
Acknowledgments
We thank Matthew Pearson, M.D., Daniel Oberer, M.D., Terri Harrel, R.N., and the operating room support staff for their help in data collection. We acknowledge the Vanderbilt Physician Scientist Development Program, the Melvin Burkhardt Chair in Brain Tumor Research, and the Karen Colina Wilson Endowment Fund at the Cleveland Clinic for support provided to RJW. We also acknowledge the Vanderbilt’s Discovery Grant Program and the National Institutes of Health-National Institute for Neurological Disorders and Stroke (Grant no. R01 NS049251-01A1) for funding.
Contributor Information
Tuhin K. Sinha, Department of Biomedical Engineering, Vanderbilt University, Nashville, Tennessee
Michael I. Miga, Department of Biomedical Engineering, Vanderbilt University, Nashville, Tennessee
David M. Cash, Department of Biomedical Engineering, Vanderbilt University, Nashville, Tennessee
Robert J. Weil, Department of Pituitary and Endocrine Surgery, Brain Tumor Institute, The Cleveland Clinic Foundation, Cleveland, Ohio
References
- 1.Arun KS, Huang TS, Blostein SD. Least-squares fitting of 2 3-d point sets. IEEE Trans Pattern Anal Mach Intell. 1987;9:699–700. doi: 10.1109/tpami.1987.4767965. [DOI] [PubMed] [Google Scholar]
- 2.Besl PJ, McKay ND. A method for registration of 3-D shapes. IEEE Trans Pattern Anal Mach Intell. 1992;14:239–256. [Google Scholar]
- 3.Blanz V, O’Toole AJ, Vetter T, Wildo HA. On the other side of the mean: The perception of dissimilarity. Perception. 2000;29:885–891. doi: 10.1068/p2851. [DOI] [PubMed] [Google Scholar]
- 4.Edwards PJ, Hawkes DJ, Hill DL, Jewell D, Spink R, Strong A, Gleeson M. Augmentation of reality using an operating microscope for otolaryngology and neurosurgical guidance. J Image Guid Surg. 1995;1:172–178. doi: 10.1002/(SICI)1522-712X(1995)1:3<172::AID-IGS7>3.0.CO;2-7. [DOI] [PubMed] [Google Scholar]
- 5.Foley JD, Hughes J, van Dam A. Addison-Wesley Systems Programming Series. Reading: Addison-Wesley; 1995. Computer Graphics: Principles and Practice. [Google Scholar]
- 6.Friets EM, Strohbehn JW, Hatch JF, Roberts DW. A frameless stereotaxic operating microscope for neurosurgery. IEEE Trans Biomed Eng. 1989;36:608–617. doi: 10.1109/10.29455. [DOI] [PubMed] [Google Scholar]
- 7.Gallen CC, Bucholz R, Sobel DF. Intracranial neurosurgery guided by functional imaging. Surg Neurol. 1994;42:523–530. doi: 10.1016/0090-3019(94)90083-3. [DOI] [PubMed] [Google Scholar]
- 8.Grimson WEL, Ettinger GJ, White SJ, Lozano-Perez T, Wells WM, 3rd, Kikinis R. An automatic registration method for frameless stereotaxy, image guided surgery, and enhanced reality visualization. IEEE Trans Med Imaging. 1996;15:129–140. doi: 10.1109/42.491415. [DOI] [PubMed] [Google Scholar]
- 9.Grimson WE, Kikinis R, Jolesz FA, Black PM. Image-guided surgery. Sci Am. 1999;280:62–69. doi: 10.1038/scientificamerican0699-62. [DOI] [PubMed] [Google Scholar]
- 10.Hayashi N, Endo S, Kurimoto M, Nishijo H, Ono T, Takaku A. Functional image-guided neurosurgical simulation system using computerized 3D graphics and dipole tracking. Neurosurgery. 1995;37:694–703. doi: 10.1227/00006123-199510000-00013. [DOI] [PubMed] [Google Scholar]
- 11.Hill H, Schyns PG, Akamatsu S. Information and viewpoint dependence in face recognitions. Cognition. 1997;62:201–222. doi: 10.1016/s0010-0277(96)00785-8. [DOI] [PubMed] [Google Scholar]
- 12.King AP, Edwards PJ, Maurer CR, de Cunha DA, Hawkes DJ, Hill DL, Gaston RP, Fenlon MR. System for microscope-assisted guided interventions. Stereotact Funct Neurosurg. 1999;72 :107–111. doi: 10.1159/000029708. [DOI] [PubMed] [Google Scholar]
- 13.Knappmeyer B, Thornton IM, Beulthoff HH. The use of facial motion and facial form during the processing of identity. Vision Res. 2003;43:1921–1936. doi: 10.1016/s0042-6989(03)00236-0. [DOI] [PubMed] [Google Scholar]
- 14.Maes F, Collignon A, Vandermeulen D, Marchal G, Seutens P. Multimodality image registration by maximization of mutual information. IEEE Trans Med Imaging. 1997;16:187–198. doi: 10.1109/42.563664. [DOI] [PubMed] [Google Scholar]
- 15.Mandava VR, Fitzpatrick JM, Maurer CR, Maciunas RJ, Allen GS. Registration of multimodal volume head images via attached markers. Medical Imaging IV: Image Processing; Spie Proceedings; 1992. pp. 271–282. [Google Scholar]
- 16.McDonald JD, Chong BW, Lewine JD, Jones G, Burr RB, McDonald PR, Koehler SB, Tsuruda J, Orrison WW, Heilbrun MP. Integration of preoperative and intraoperative functional brain mapping in a frameless stereotactic environment for lesions near eloquent cortex. technical note. J Neurosurg. 1999;90:591–598. doi: 10.3171/jns.1999.90.3.0591. [DOI] [PubMed] [Google Scholar]
- 17.Miga MI, Sinha TK, Cash DM, Galloway RL, Weil RJ. Cortical surface registration for image-guided neurosurgery using laser range scanning. IEEE Trans Med Imaging. 2003;22:973–985. doi: 10.1109/TMI.2003.815868. [DOI] [PMC free article] [PubMed] [Google Scholar]
- 18.Nabavi A, Black PM, Gering DT, Westin CF, Mehta V, Pergolizzi RS, Ferrant M, Warfield SK, Hata N, Schwartz RB, Wells WM, 3rd, Kikinis R, Jolesz FA. Serial intraoperative magnetic resonance imaging of brain shift. Neurosurgery. 2001;48:787–797. doi: 10.1097/00006123-200104000-00019. [DOI] [PubMed] [Google Scholar]
- 19.Nakajima S, Atsumi H, Kikinis R, Moriarty TM, Metcalf DC, Jolesz FA, Black PM. Use of cortical surface vessel registration for image-guided neurosurgery. Neurosurgery. 1997;40:1201–1208. doi: 10.1097/00006123-199706000-00018. [DOI] [PubMed] [Google Scholar]
- 20.Nimsky C, Ganslandt O, Cerny S, Hastreiter P, Greiner G, Fahlbusch R. Quantification of, visualization of, and compensation for brain shift using intraoperative magnetic resonance imaging. Neurosurgery. 2000;47:1070–1079. doi: 10.1097/00006123-200011000-00008. [DOI] [PubMed] [Google Scholar]
- 21.O’Toole AJ, Price T, Vetter T, Bartlett JC, Blanz V. 3D shape and 2D surface textures of human faces: The role of ”averages” in attractiveness and age. Image and Vision Computing. 1999;18:9–19. [Google Scholar]
- 22.O’Toole AJ, Vetter T, Blanz V. Three-dimensional shape and two-dimensional surface reflectance contributions to face recognition: an application of three-dimensional morphing. Vision Res. 1999;39:3145–3155. doi: 10.1016/s0042-6989(99)00034-6. [DOI] [PubMed] [Google Scholar]
- 23.Palmer SE. Visual Science: Photons to Phenomenology. Cambridge: MIT Press; 1999. [Google Scholar]
- 24.Roberts DW, Hartov A, Kennedy FE, Miga MI, Paulsen KD. Intraoperative brain shift and deformation: A quantitative analysis of cortical displacement in 28 cases. Neurosurgery. 1998;43:749–758. doi: 10.1097/00006123-199810000-00010. [DOI] [PubMed] [Google Scholar]
- 25.Roberts DW, Nakajima T, Brodwater B, Pavlidis J, Friets E, Fagan E, Hartov A, Strohbehn J. Further development and clinical-application of the stereotaxic operating microscope. Stereotact Funct Neurosurg. 1992;58:114–117. doi: 10.1159/000098983. [DOI] [PubMed] [Google Scholar]
- 26.Schonemann PH. Schonemann. A generalized solution of the orthogonal procrustes problem. Psychometrika. 1966;31:1–10. [Google Scholar]
- 27.Sinha TK, Dawant BM, Duay V, Cash DM, Weil RJ, Thompson RC, Weaver KD, Miga MI. Method to track cortical surface deformations using a laser range scanner. IEEE Trans Med Imaging. 2005;24:767–781. doi: 10.1109/TMI.2005.848373. [DOI] [PMC free article] [PubMed] [Google Scholar]
- 28.Sinha TK. Cortical surface characterization using a laser range scanner for neurosurgery. Nashville: Vanderbilt University; 2004. (dissertation) [Google Scholar]
- 29.Troje N, Beulthoff HH. What is the basis for good performance to symmetric views of faces. Invest Ophthalmol Vis Sci. 1996;37:911. [Google Scholar]
- 30.Troje NF. Reference frames for orientation anisotropies in face recognition and biological-motion perception. Perception. 2003;32:201–210. doi: 10.1068/p3392. [DOI] [PubMed] [Google Scholar]
- 31.Unsgaard G, Ommedal S, Muller T, Gronningsaeter A, Hernes TA. Neuronavigation by intraoperative three-dimensional ultrasound: Initial experience during brain tumor resection. Neurosurgery. 2002;50:804–812. doi: 10.1097/00006123-200204000-00022. [DOI] [PubMed] [Google Scholar]
- 32.Viola P, Wells WM., 3rd Alignment by Maximization of Mutual Information. Int J Comp Vis. 1997;24:137–154. [Google Scholar]
- 33.Wagner A, Ploder O, Enislidis G, Truppe M. Image guided surgery. Int J Oral Maxillofac Surg. 1996;25:147–151. doi: 10.1016/s0901-5027(96)80062-2. [DOI] [PubMed] [Google Scholar]