Abstract
Although intercellular bridges resulting from incomplete cytokinesis were discovered in somatic Drosophila tissues decades ago, the impact of these structures on intercellular communication and tissue biology is largely unknown. In this work, we demonstrate that the ~250 nm diameter somatic ring canals permit diffusion of cytoplasmic contents between connected cells and across mitotic clone boundaries, and enable the equilibration of protein between transcriptionally mosaic follicle cells in the Drosophila ovary. We obtained similar, though more restricted, results in the larval imaginal discs. Our work illustrates the lack of cytoplasmic autonomy in these tissues and suggests a role for somatic ring canals in promoting homogeneous protein expression within the tissue.
Ring canals (RCs) are cytoplasmic bridges that form from cells with arrested mitotic cleavage furrows. They provide direct cytoplasmic connections between sibling cells and, in the Drosophila germline, are necessary for the transfer of nurse-cell cytoplasm into the oocyte. In RC-containing tissues where mass-transfer of cytoplasm does not occur, such as in the mammalian germline (1–5) or several somatic tissues in Drosophila (6–9), the role of RCs remains poorly understood because genetic perturbation of RC proteins disrupts cytokinesis. Here, we pursued a series of microscopy-based techniques in ovarian follicle cells (FCs) and larval imaginal discs in Drosophila to investigate the role of somatic RCs in protein movement between cells and across an epithelium.
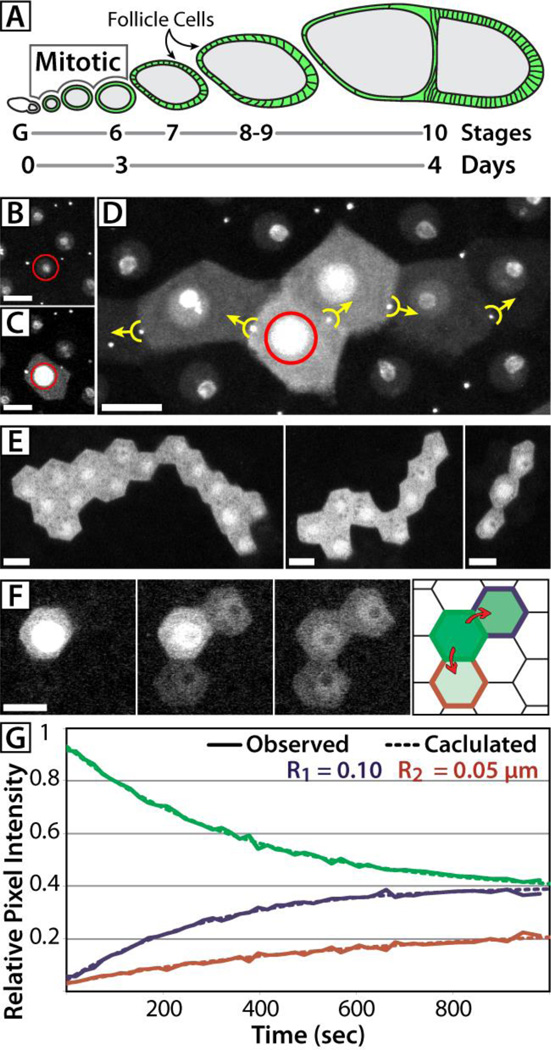
In Drosophila egg chambers, germline cysts are encapsulated by two stem-cell derived lineages of FCs that originate in the germarium and cease mitotic divisions at stage 6; RCs, however, persist until the end of oogenesis indicating a lifespan of 1–4 days (10–12) (Fig. 1A). Ovarian FCs exchange GFP-tagged endogenous proteins and the photoactivatable variant of GFP (PAGFP), which can be used to assay intercellular exchange (11) (Movie S1). To evaluate the contribution of RCs to this movement, we co-expressed PAGFP (13) with the RC marker GFP::Pav (14) and photoactivated single cells. Activated PAGFP moved into neighboring follicle cells only if an intervening RC was present, indicating protein exchange occurs only through direct cytoplasmic contact (Fig. 1B–D). Following single-cell photoactivation, we determined the size of FC syncytia by iteratively activating cells that exchanged PAGFP with the initial cell. Our analysis revealed substantial variability in syncytium size; most syncytia were between 3 and 10 cells (average of 8 cells) (Fig. 1E, Movie S2), with a total observed range of 1–38 cells. We did not find a significant correlation between syncytium size or orientation with respect to polar axes or other morphological features of egg chambers.
Fig 1. Diffusion of PAGFP and syncytial organization of FCs.
(A) Schematic of a Drosophila ovariole from the germarium (G) through a stage 10 egg chamber. The germline cysts (grey) are encapsulated by FCs (green) that continue mitosis until stage 6, completing ~9 cell cycles. (B–D) FCs expressing GFP::Pav and Tub>mC3PAGFP were individually photoactivated (red circle) and images were collected pre-activation (B), post-activation (C), and 18 minutes after activation (D). PAGFP moved only into cells connected by RCs (yellow markers, arrows indicate direction of movement). (E) In tissue expressing Tub>PAGFP, iterative activation revealed the extent of individual syncytia. (F,G) Following a single-cell photoactivation event (F), the fluorescence intensity in FCs was measured and plotted against a model of diffusion (G). Modeled estimates of RC radii shown inset (R1, R2). The cell border colors of the FC schematic (F) correspond to the data series and radii values (green = donor cell; red, blue = recipient cells). Stage 10 egg chambers were used in all panels. Scale bars = 10µm.
Electron microscopy (EM) of somatic RCs reveals no occluding or transverse cytoskeletal structures that might indicate a mechanism for protein gating or regulated transport (11, 15, 16); therefore, we tested whether protein exchange through RCs occurs by diffusion. We quantified the change in fluorescence of FC cytoplasm following a single photoactivation event (Fig. 1F) and compared these data to a computational model of diffusion developed with The Virtual Cell (VCell, http://vcell.org/) (17). Our model estimated radii to be between 0.04 and 0.11 µm (Fig. 1G, S1). This is slightly smaller than radii measured by EM (0.08 – 0.14 µm) (15), which does not account for the visible geometric asymmetry or partially occluding membranous structures in somatic RCs that reduce the effective radius. We conclude that the model of diffusion correctly reports the effective radius of the intervening RC and accurately replicates the movement of PAGFP between cells.
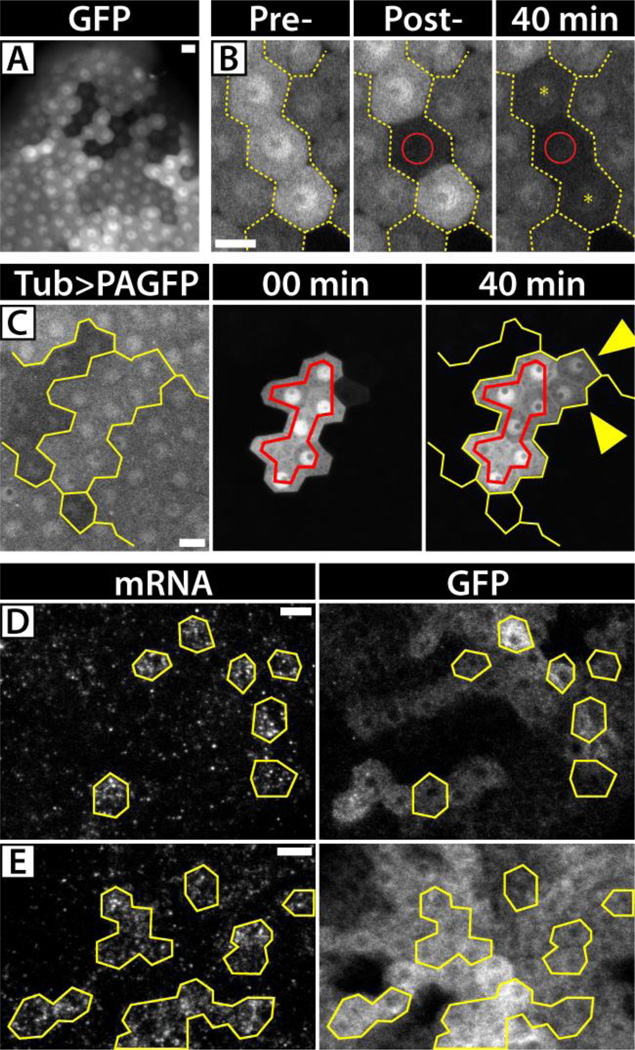
Having observed that GFP is free to diffuse between cells, we sought to investigate the relationship of RC-based syncytia to the patch-like mosaic expression of Gal4/UAS-transgenes in FCs (18) (Fig. 2A). We tested the idea that mosaic patches represent isolated syncytia by conducting fluorescence loss in photobleaching (FLIP) experiments with GFP. Bleaching of single cells within high-expressing patches of cells caused loss of fluorescence only in neighboring cells with the same level of expression (Fig. 2B). In total, we probed 68 mosaic patch boundaries and never observed loss of fluorescence in cells of a different mosaic patch. In a complementary approach, we evaluated the extent of PAGFP diffusion within and between mosaic patches (Fig. 2C). PAGFP diffused into cells within a single patch, but not into cells of a different patch. These data support our hypothesis that mosaic patches represent isolated syncytia and reflect the underlying intercellular connectivity created by RCs.
Fig 2. Protein equilibration in FCs.
(A) Stage 10 FCs expressing c855a>GFP have a mosaic, patch-like distribution of GFP. (B) FLIP analysis evaluates the intercellular connectivity of cells within patches (yellow lines indicate patch boundaries). Upon bleaching single cells (red circles), multiple cells within the patch exhibit FLIP (yellow asterisks). (C) Detection of the low, pre-activation fluorescence of Tub>mC3PAGFP in stage 10 FCs reveals its mosaic, patch-like distribution. Activation (red outline) within a mosaic patch of cells (yellow outline) showed diffusion only within the patch (yellow arrowheads) and no diffusion across a boundary. (D,E) FISH/IF analysis of c855a>GFP egg chambers showed GFP transcript to be significantly more mosaic than GFP protein. Only single, isolated cells in stage 9 egg chambers (D) and small clusters of cells in stage 10 egg chambers (E) (outlined in yellow) had detectable levels of GFP transcript compared to wider distribution of GFP protein at both stages. Scale bars = 10µm.
Given the non-autonomy of GFP, we conducted a fluorescent in situ hybridization (FISH) and immunofluorescence (IF) co-stain to compare the abundance of GFP transcript and GFP protein in FCs expressing UAS-GFP. In stage 9 egg chambers, when the c855a-Gal4 driver begins expression, we found few cells with detectable levels of GFP transcript compared to the distribution of GFP protein (Fig. 2D). In stage 10 egg chambers, where c855a-Gal4 expression is strongest, we found small, dispersed clusters of 2–4 cells with high levels of transcript amongst large groups of cells with high concentrations of GFP protein (Fig. 2E, S2). Thus, under the control of the c885-Gal4 driver, GFP protein is translated in a few, sparse cells and equilibrates within FC syncytia to provide protein to the majority of cells within the epithelium.
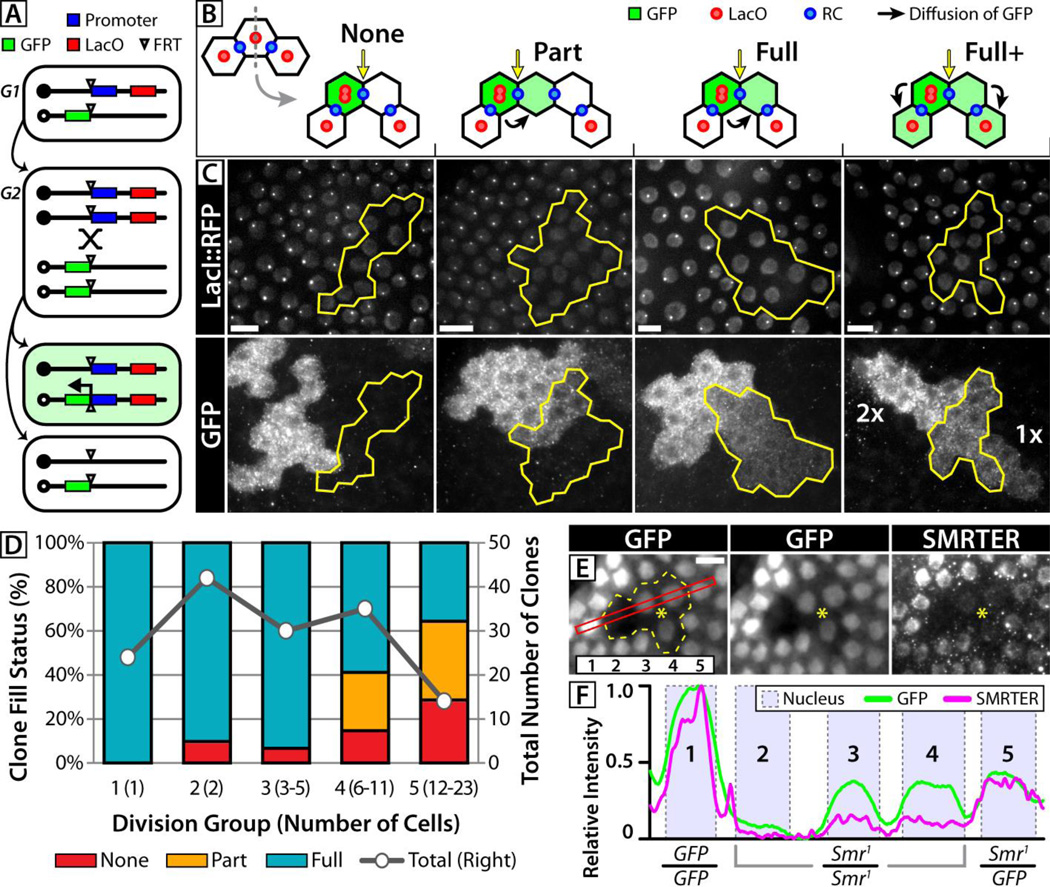
GFP is also a common marker used with FRT-based mitotic recombination, a strategy employed to generate clonal groups of genetically mutant cells within a heterozygous tissue (19). Diffusion of protein into or out of these groups of cells (clones) via RCs could compromise subsequent phenotypic analysis, so we generated a two-part labeling system to investigate this possibility. We combined the LacO/I DNA marker, which reliably marks the recombination status of each cell (20–22), with a diffusible, recombination-induced Ubi-GFP transgene. Following recombination and mitosis, GFP is reconstituted in cells containing two copies of the LacO element (2xLacO) (Fig 3A, supplemental online text). We then look for the presence of GFP in the other, LacO-negative side of the clone as evidence for diffusion through the bridging RC that connects the 2xLacO and LacO-negative cells (Fig 3B). We refer to this method as syncytial tracing by recombination-induced transcription, or STRIT (17).
Fig 3. Non-autonomy of mitotic clones.
(A) Representation of the STRIT marking system in G1, G2, and after mitosis. One recombinant daughter contains 2xLacO and a functional GFP gene, while the other inherits neither. (B) Possible outcomes of STRIT clones: no GFP diffusion (None), diffusion across the bridge RC (yellow arrow) into some (Part) or all LacO-negative cells (Full), and diffusion into non-recombined cells (Full+) through pre-existing RCs. Grey line indicates plane of division. (C) Representative STRIT clones displaying varying degrees of inter-clonal diffusion. In ‘Full+’, GFP from 2xLacO cells (2x) is found in non-recombined, 1xLacO cells (1x) on the far side of the LacO-negative clone. (D) Evaluation of LacO-negative STRIT clones grouped according to the degree of GFP diffusion and clone age, or division group (number of cells). The total number of clones in each division group (grey series) is given on the right axis. (E) A 4-cell Smr1/Smr1 clone (outlined in yellow) in which 3 cells (around yellow asterisk) contain detectable levels of GFP and SMRTER protein. The red rectangle indicates the region quantified in panel G, and cells in the region are numbered (inset). (F) Cells 3 and 4 contain lower, but detectable levels of both GFP and SMRTER, indicating diffusion into the Smr1/Smr1 clone. Scale bars = 10µm.
Our results revealed extensive diffusion of GFP across the two sides of FRT clones and into non-recombinant cells. We categorized 145 isolated clones by the extent of GFP diffusion into the LacO-negative cells: no diffusion across the bridge RC (None), diffusion into part (Part) or all (Full) of the LacO-negative clone, and diffusion beyond the LacO-negative clone into non-recombined cells (Full+) (Fig. 3B,C). In total, 90% of LacO-negative clones contained GFP suggesting that nearly all observable RCs in FCs permit intercellular diffusion.
We further categorized our results by the number of cell-cycles since clone formation (division group) as a measure of the clone’s age (Fig. 3D). We observed an increasing fraction of GFP-negative (None) and “Part” clones in older STRIT lineages, indicating a loss of functional bridge RCs (supplemental online text). These data support an estimated RC half-life of 10 cell cycles, or ~4 days, which is close to the ~4.5 day lifespan of FCs, suggesting that the majority of RCs remain functional throughout oogenesis. We also counted the appearance of non-functional connections within LacO-negative clones of the Part-filled group to be approximately 15% of the total number of divisions (27/179). Because this value is based on the diffusion of GFP, and therefore includes possible non-functional RCs still visible by microscopy, the complementary 85% represents an estimate of the number of functional RCs. In sum, these data supports previous reports that ~90% of FC divisions form RCs (11) and also suggests that an additional ~5% of RCs visible by confocal microscopy no longer connect cells. The functional 85% of RCs directly connect the cytoplasm of cells within their lineage and form many syncytial groups in which diffusible protein is free to equilibrate. Significantly, inter-clonal diffusion of makers (i.e. GFP) or proteins (11) can result in ambiguous clonal boundaries and complicate the interpretation of phenotypes, as evidenced by diffusion of both GFP and SMRTER protein into Smr1 cells (Fig. 3E,F, S4).
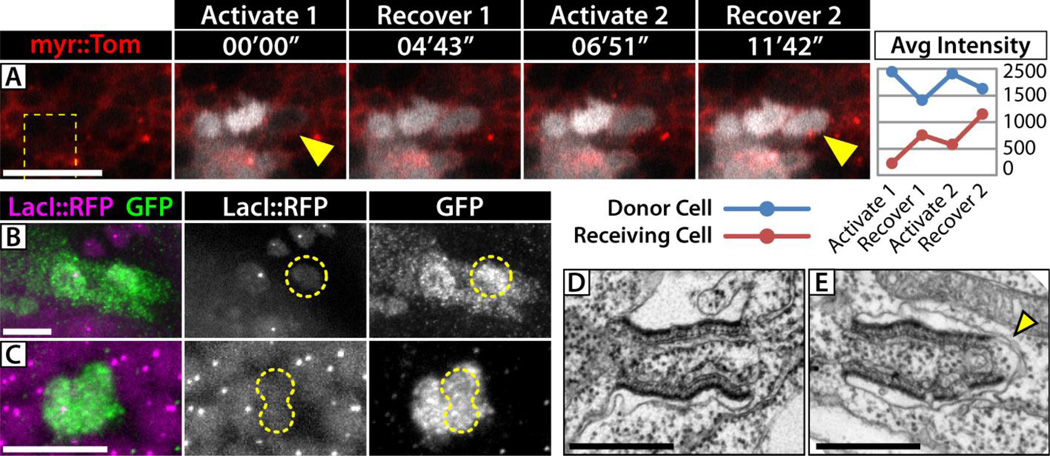
EM and confocal microscopy have also revealed somatic RCs in Drosophila larval imaginal discs (7, 8, 11, 16). We determined that 60%–80% of cellular divisions are represented by GFP::Pav labeled structures in third instar wing discs, equaling approximately 1,500–3,000 potential RCs within the wing blade (Fig. S5). We assayed intercellular connectivity in the wing disc by photoactivation of PAGFP and by STRIT clonal analysis, and observed evidence of intercellular diffusion with both techniques (Fig. 4A–C, S6). Though technical challenges of imaginal disc tissue made reliable identification of intercellular diffusion more difficult, we estimate that <20% of cells showed intercellular diffusion with PAGFP and <10% of STRIT clones showed diffusion across the bridge RC. Importantly, we observed GFP in LacO-negative clones only up to two cells in size, suggesting that bridge RCs have a short functional lifespan (less than two cell cycles). The perdurance of non-functional RCs in the tissue could explain the abundance of GFP::Pav structures observed by microscopy. In support of this hypothesis, EM of the wing imaginal discs revealed both intact RCs and many examples of engulfed, burst, and degrading RCs (Fig. 4D,E, S7). Together, these results suggest that RCs allow intercellular diffusion in imaginal discs as they do in FCs, but since the number of functional RCs in imaginal discs is low, they are unlikely to significantly alter large-scale pattern formation.
Fig 4. Intercellular diffusion in the wing imaginal disc.
(A) Photoactivation of Tub>mC3PAGFP (white channel) in a region of the wing-blade (dashed line) reveals rapid intercellular diffusion (yellow arrowheads). Two consecutive activation and recovery events are shown and quantified on the right (average pixel intensity). Intercellular exchange is evidenced by the decrease in cytoplasmic fluorescence in the activated ‘donor’ cell during the recoveries while the ‘receiving’ cell shows an increase. (B,C) STRIT clones in wing imaginal discs show diffusion of GFP into small LacO-negative clones (yellow outlines). (B) 1-cell clone in the peripodial epithelium, (C) 2-cell clone in the wing-blade epithelium. Scale bars = 10 µm. (D,E) EMs of RCs in the wing imaginal disc. Many longitudinally sectioned RCs connect cells (D), but approximately half do not. (E) Engulfed RC with a membrane cap at one end (yellow arrowhead). Scale bars = 500 nm.
Our results provide strong evidence that somatic RCs act as direct intercellular channels through which cytoplasmic protein can diffuse. In the ovarian FCs, RCs remain functional for several days and result in the formation of syncytial groups that allow equilibration of protein between cells, and in many cases, across mitotic clones. The incomplete autonomy of mitotic clones in FCs urges caution when interpreting mitotic clone data, where clonal markers or proteins of interest may not accurately report the genotypes of cells. We also show that transcriptional disparities underlie the observed mosaicism of Gal4/UAS-GFP within the follicular epithelium, and they are much greater than is evidenced by protein concentration, which equilibrates among the cells of each syncytial group. Interestingly, proteins and protein complexes that display endogenous mosaic expression, including several ribosomal proteins, are also unable to diffuse between cells (11). Thus, the ability to equilibrate levels of some proteins in syncytial clusters may benefit FCs by allowing them to compensate for transcriptional variations across the epithelium.
Supplementary Material
Acknowledgments
We thank S. Zimmerman, N. Peters, and C. Berg (Genome Sciences, University of Washington) for their assistance in troubleshooting the FISH protocol; N. Woodward and J. Carlson (MCDB, Yale University) for providing reagents and support for the FISH experiments; C. Tsai (Neuroscience and Cell Biology, UMDNJ-Robert Wood Johnson Medical School) for the SMRTER reagents; T. Xu (Genetics, Yale University) for the use of the upright Zeiss LSM510 META microscope; and the Bloomington Drosophila Stock Center for flies. For their support in the development of the VCell models, we thank A. Cowan and B. Slepchenko; the described VCell models are available at http://www.vcell.org/ under the shared username peterfoster. The Virtual Cell is supported by NIH Grant Number P41 GM103313 from the National Center for Research Resources. We also thank the CCMI core facility (Yale University) for the use of their microscopes and for assistance with EM acquisition. P.F.M received support from the National Institutes of Health Genetics Training Grant [T32 GM007499]. This work was supported by grants to L.C. from the National Institutes of Health [GM091791, GM043301].
Footnotes
Supplementary Materials:
Materials and Methods
Supplemental Online Text
Figures S1–S7
Movie S1–S2
References (23–34)
References and Notes
- 1.Ventelä S, Toppari J, Parvinen M. Intercellular Organelle Traffic through Cytoplasmic Bridges in Early Spermatids of the Rat: Mechanisms of Haploid Gene Product Sharing. Mol. Biol. Cell. 2003;14:2768–2780. doi: 10.1091/mbc.E02-10-0647. [DOI] [PMC free article] [PubMed] [Google Scholar]
- 2.Dym M, Fawcett DW. Further observations on the numbers of spermatogonia, spermatocytes, and spermatids connected by intercellular bridges in the mammalian testis. Biol. Reprod. 1971;4:195. doi: 10.1093/biolreprod/4.2.195. [DOI] [PubMed] [Google Scholar]
- 3.Greenbaum MP, Iwamori N, Agno JE, Matzuk MM. Mouse TEX14 Is Required for Embryonic Germ Cell Intercellular Bridges but Not Female Fertility. Biol Reprod. 2009;80:449–457. doi: 10.1095/biolreprod.108.070649. [DOI] [PMC free article] [PubMed] [Google Scholar]
- 4.Pepling ME, Spradling AC. Female mouse germ cells form synchronously dividing cysts. Development. 1998;125:3323–3328. doi: 10.1242/dev.125.17.3323. [DOI] [PubMed] [Google Scholar]
- 5.Gondos B. Intercellular Bridges and Mammalian Germ Cell Differentiation. Differentiation. 1973;1:177–182. [Google Scholar]
- 6.Giorgi F. Intercellular bridges in ovarian follicle cells of Drosophila melanogaster. Cell Tissue Res. 1978;186:413–422. doi: 10.1007/BF00224931. [DOI] [PubMed] [Google Scholar]
- 7.Poodry CA, Schneiderman HA. The ultrastructure of the developing leg of Drosophila melanogaster. Dev. Gene. Evol. 1970;166:1–44. doi: 10.1007/BF00576805. [DOI] [PubMed] [Google Scholar]
- 8.Larsen EW. Ultrastructural Aspects of Prepupal Leg Development in Drosophila. Trans. Am. Micro. Soc. 1989;108:159–168. [Google Scholar]
- 9.Kramerova IA, Kramerov AA. Mucinoprotein is a universal constituent of stable intercellular bridges in Drosophila melanogaster germ line and somatic cells. Dev. Dyn. 1999;216:349–360. doi: 10.1002/(SICI)1097-0177(199912)216:4/5<349::AID-DVDY4>3.0.CO;2-X. [DOI] [PubMed] [Google Scholar]
- 10.Nystul T, Spradling A. Regulation of Epithelial Stem Cell Replacement and Follicle Formation in the Drosophila Ovary. Genetics. 2010;184:503–515. doi: 10.1534/genetics.109.109538. [DOI] [PMC free article] [PubMed] [Google Scholar]
- 11.Airoldi SJ, McLean PF, Shimada Y, Cooley L. Intercellular protein movement in syncytial Drosophila follicle cells. J. Cell Sci. 2011;124:4077–4086. doi: 10.1242/jcs.090456. [DOI] [PMC free article] [PubMed] [Google Scholar]
- 12.Lin H, Spradling AC. Germline Stem Cell Division and Egg Chamber Development in Transplanted Drosophila Germaria. Dev. Biol. 1993;159:140–152. doi: 10.1006/dbio.1993.1228. [DOI] [PubMed] [Google Scholar]
- 13.Ruta V, et al. A dimorphic pheromone circuit in Drosophila from sensory input to descending output. Nature. 2010;468:686–690. doi: 10.1038/nature09554. [DOI] [PubMed] [Google Scholar]
- 14.Minestrini G, Mathe E, Glover DM. Domains of the Pavarotti kinesin-like protein that direct its subcellular distribution: effects of mislocalisation on the tubulin and actin cytoskeleton during Drosophila oogenesis. J. Cell Sci. 2002;115:725–736. doi: 10.1242/jcs.115.4.725. [DOI] [PubMed] [Google Scholar]
- 15.Woodruff RI, Tilney LG. Intercellular Bridges between Epithelial Cells in the Drosophila Ovarian Follicle: A Possible Aid to Localized Signaling. Dev. Biol. 1998;200:82–91. doi: 10.1006/dbio.1998.8948. [DOI] [PubMed] [Google Scholar]
- 16.Haglund K, et al. Cindr Interacts with Anillin to Control Cytokinesis in Drosophila melanogaster. Curr. Biol. 2010;20:944–950. doi: 10.1016/j.cub.2010.03.068. [DOI] [PubMed] [Google Scholar]
- 17.Materials and methods are available as supplementary material on Science Online.
- 18.Skora AD, Spradling AC. Epigenetic stability increases extensively during Drosophila follicle stem cell differentiation. PNAS. 2010;107:7389–7394. doi: 10.1073/pnas.1003180107. [DOI] [PMC free article] [PubMed] [Google Scholar]
- 19.Brand AH, Perrimon N. Targeted gene expression as a means of altering cell fates and generating dominant phenotypes. Development. 1993;118:401–415. doi: 10.1242/dev.118.2.401. [DOI] [PubMed] [Google Scholar]
- 20.Robinett CC, et al. In vivo localization of DNA sequences and visualization of large-scale chromatin organization using lac operator/repressor recognition. J. Cell Biol. 1996;135:1685–1700. doi: 10.1083/jcb.135.6.1685. [DOI] [PMC free article] [PubMed] [Google Scholar]
- 21.Vazquez J, Belmont AS, Sedat JW. Multiple regimes of constrained chromosome motion are regulated in the interphase Drosophila nucleus. Curr. Biol. 2001;11:1227–1239. doi: 10.1016/s0960-9822(01)00390-6. [DOI] [PubMed] [Google Scholar]
- 22.Thakar R, Csink AK. Changing chromatin dynamics and nuclear organization during differentiation in Drosophila larval tissue. J. Cell Sci. 2005;118:951–960. doi: 10.1242/jcs.01684. [DOI] [PubMed] [Google Scholar]
- 23.Datta SR, et al. The Drosophila pheromone cVA activates a sexually dimorphic neural circuit. Nature. 2008;452:473–477. doi: 10.1038/nature06808. [DOI] [PubMed] [Google Scholar]
- 24.Pfeiffer BD, Truman JW, Rubin GM. Using Translational Enhancers to Increase Transgene Expression in Drosophila. PNAS. 2012;109:6626–6631. doi: 10.1073/pnas.1204520109. [DOI] [PMC free article] [PubMed] [Google Scholar]
- 25.Heck BW, et al. The transcriptional corepressor SMRTER influences both Notch and ecdysone signaling during Drosophila development. Biol. Open. 2012;1:182–196. doi: 10.1242/bio.2012047. [DOI] [PMC free article] [PubMed] [Google Scholar]
- 26.Senecoff JF, Bruckner RC, Cox MM. The FLP recombinase of the yeast 2-micron plasmid: characterization of its recombination site. PNAS. 1985;82:7270–7274. doi: 10.1073/pnas.82.21.7270. [DOI] [PMC free article] [PubMed] [Google Scholar]
- 27.Venken KJT, He Y, Hoskins RA, Bellen HJ. P[acman]: A BAC Transgenic Platform for Targeted Insertion of Large DNA Fragments in D. melanogaster. Science. 2006;314:1747–1751. doi: 10.1126/science.1134426. [DOI] [PubMed] [Google Scholar]
- 28.Swaminathan R, Hoang CP, Verkman AS. Photobleaching recovery and anisotropy decay of green fluorescent protein GFP-S65T in solution and cells: cytoplasmic viscosity probed by green fluorescent protein translational and rotational diffusion. Biophys J. 1997;72:1900–1907. doi: 10.1016/S0006-3495(97)78835-0. [DOI] [PMC free article] [PubMed] [Google Scholar]
- 29.Peters NC, Thayer NH, Kerr SA, Tompa M, Berg CA. Following the “tracks”: Tramtrack69 regulates epithelial tube expansion in the Drosophila ovary through Paxillin, Dynamin, and the homeobox protein mirror. Dev. Biol. 2013 doi: 10.1016/j.ydbio.2013.03.017. [DOI] [PMC free article] [PubMed] [Google Scholar]
- 30.Lee T, Luo L. Mosaic Analysis with a Repressible Cell Marker for Studies of Gene Function in Neuronal Morphogenesis. Neuron. 1999;22:451–461. doi: 10.1016/s0896-6273(00)80701-1. [DOI] [PubMed] [Google Scholar]
- 31.Tsai CC, Kao HY, Yao TP, McKeown M, Evans RM. SMRTER, a Drosophila Nuclear Receptor Coregulator, Reveals that EcR-Mediated Repression Is Critical for Development. Mol. Cell. 1999;4:175–186. doi: 10.1016/s1097-2765(00)80365-2. [DOI] [PubMed] [Google Scholar]
- 32.Pimpinelli S, Ripoll P. Nonrandom segregation of centromeres following mitotic recombination in Drosophila melanogaster. PNAS. 1986;83:3900–3903. doi: 10.1073/pnas.83.11.3900. [DOI] [PMC free article] [PubMed] [Google Scholar]
- 33.Beumer KJ, Pimpinelli S, Golic KG. Induced Chromosomal Exchange Directs the Segregation of Recombinant Chromatids in Mitosis of Drosophila. Genetics. 1998;150:173–188. doi: 10.1093/genetics/150.1.173. [DOI] [PMC free article] [PubMed] [Google Scholar]
- 34.Margolis J, Spradling A. Identification and behavior of epithelial stem cells in the Drosophila ovary. Development. 1995;121:3797. doi: 10.1242/dev.121.11.3797. [DOI] [PubMed] [Google Scholar]
Associated Data
This section collects any data citations, data availability statements, or supplementary materials included in this article.


