

Abstract
Nanomaterials possess distinctive physicochemical properties and promise a wide range of applications, from advanced technology to leading-edge medicine. However, their effects on living organisms remain largely unknown. Here we report that the purified silver nanoparticles (Ag NPs, 97 ± 13 nm) incite specific developmental stage embryonic phenotypes and nanotoxicity in a dose-dependent manner, upon acute exposure of given-stage embryos to the NPs (0–24 pM) for only 2 h. The critical concentrations of the NPs that cause 50% of embryos develop normally for cleavage, early-gastrula, early-segmentation, late-segmentation, and hatching stage zebrafish embryos are 3.5, 4, 6, 6, and 8 pM, respectively, showing that the earlier developmental stage embryos are much more sensitive to the effects of the NPs than the later stage. Interestingly, distinctive phenotypes (head abnormality and no eyes) are observed only in cleavage and early-gastrula stage embryos treated with the NPs, showing the stage-specific effects of the NPs. By comparing with our study of the smaller Ag NPs (13.1 ± 2.5 nm), we found that the embryonic phenotypes strikingly depend upon the sizes of Ag NPs and embryonic developmental stages. These notable findings suggest that the Ag NPs are unlike any conventional chemicals or ions. They can potentially enable target specific study and therapy for early embryonic development in size, stage, dose, and exposure-duration dependent manners.
Keywords: Biocompatibility, Developmental Nanotoxicity, Silver Nanoparticle, Single Nanoparticle Plasmonic Spectroscopy, Zebrafish Embryos
Introduction
With tiny sizes and exceptional surface properties, nanomaterials could enter living organisms non-invasively, interact with biological structures specifically, and create unique effects upon their fates and functions. They can serve as imaging probes for study of vital biological pathways in vivo, and as smart drug delivery vehicles and novel medicines for effective therapy.1–2 Thus, it is essential to study the dependence of their biological effects upon their physicochemical properties (sizes, doses, chemical compositions), in order to rationally design their biological functions.
Noble metal nanoparticles, especially Ag NPs, possess distinctive plasmonic optical properties and high Rayleigh scattering.3–6 Unlike fluorophores or quantum dots, single Ag NPs resist photobleaching and photoblinking.3, 6–10 Their localized surface plasmon resonance (LSPR) spectra highly depend upon their physicochemical properties and surrounding environments.3–5,8,11–15 These distinctive optical properties enable them to serve as photostable imaging probes for real-time study of living cells and embryos over a long period of time.6–9, 16–23
Zebrafish have been widely used as a vertebrate model organism for study of embryological development, therapeutic effects of drug molecules and environmental effects of toxic chemicals.24–31 Zebrafish embryos are optically transparent and develop outside their mothers, enabling direct observation of embryonic development in vivo. Their small size, short breeding cycle, and wealth information for molecular genetic manipulation, make it a superior model organism over others (mouse, rat, human).24–26 Furthermore, the majority of their developmental mutations have close counterparts in other vertebrates,25, 32–34 suggesting that it can effectively serve as a model for understanding the developmental processes of higher organisms, including humans.
Currently, conventional ensemble toxicology methods and in vitro cell assays are widely used to study the cytotoxic effects of nanomaterials.35–37 Single types of the cultured cells are studied individually, which can miss vital and specific cell-to-cell interactions. In contrast, embryos enable one to simultaneously study the effects of NPs upon a wide variety of cells and detect all related pathways, including reactive oxygen species formation, engagement of apoptotic pathways and disruption of regulatory signaling in the developing embryos.29, 35–37 Furthermore, massive amount of embryos can be generated rapidly (over night) at very low cost. Thus, they can serve as ultrasensitive and high-throughput in vivo assays to study developmental processes upon their exposure to nanomaterials, and to characterize their effects on embryonic development.6, 19–23
Although several studies have used zebrafish embryos to study nanotoxicity,6, 19–23, 38–39 theirs effectiveness as in vivo assays has not yet been fully validated. In our previous studies, we selected the cleavage-stage embryos and exposed them to the various sized Ag or Au NPs chronically for 120 h, and found that the embryos died or developed to deformed zebrafish in a dose, size, surface-charge, and chemical dependent manners.6, 19–23 However, none of these studies can determine whether the NPs incite stage-specific abnormalities. In this study, we select cleavage, early-gastrulation, early-segmentation, late-segmentation, and hatching stage embryos (five vital developmental checkpoints), acutely expose them to the purified and stable Ag NPs (97 ± 13 nm) for only 2 h, and characterize their development in egg water over 120 h. This study aims to determine embryonic developmental stage-dependent effects of the NPs and to identify the most sensitive embryos for screening biocompatibility and toxicity of nanomaterials and vital embryonic developmental stages for further analysis.
Materials and Methods
Synthesis and Characterization of Purified and Stable Ag NPs (97 ± 13 nm)
The Ag NPs were synthesized and characterized as we described previously.12, 23 Briefly, sodium citrate (20 mL, 34 mM in deionized (DI) water) was rapidly added into AgNO3 (500 mL, 1.06 mM in DI water) under stirring and refluxing. The colors of the mixture turned from colorless to straw yellow, then opaque yellow, and finally muddy yellow, during the 95-min stirring and refluxing. We stopped the heating, continued refluxing and stirring the solution until it was cooled to room temperature, then immediately filtered it using 0.22-μm filters.
The NPs were washed three times with nanopure DI water using centrifugation to remove the chemicals involved in NP synthesis. The supernatants of NP solution after the third washing were collected for control experiments to study the effect of trace chemicals involved in NP synthesis on the embryonic development. We used the nanopure DI water (18 MΩ, Barnstead) to prepare solutions and rinse glassware. All chemicals were purchased from Sigma and used as received.
The concentrations, optical properties, and sizes of NPs were characterized using UV-vis spectroscopy (Hitachi U2010), dark-field optical microscopy and spectroscopy (DFOMS), dynamic light scattering (DLS, Nicomp 380ZLS particle sizing system), and high-resolution transmission electron microscopy (HR-TEM, JEOL, JEM-2100 F). We have fully described our DFOMS for real-time imaging and spectroscopic characterization of single NPs in solutions, single live cells and single embryos, and for single molecule detection.3, 6–9, 16–18, 20, 22, 40 In this study, dark-field microscope equipped with Multispectral Imaging System (MSIS, N-MSI-VIS-FLEX, CRi, Hopkiton, MA) is used to image and characterize LSPR spectra of single Ag NPs. The MSIS is an integrated system of a CCD camera (SonyICX 285) and liquid-crystal-tunable-filter. The dark-field microscope consists of a dark-field condenser (oil, 1.43–1.20), a microscope illuminator (Halogen lamp, 100 W), and a 100× objective (Plan fluor 100×, N.A. 0.5–1.3, oil).
Breeding and Monitoring of Zebrafish Embryos
Wild type adult zebrafish (Aquatic Ecosystems) were housed in a stand-alone system, maintained, bred, and collected, as described previously.6, 10, 19–23, 41 Briefly, male and female zebrafish at a ratio of 1 to 2 were placed in a clean 10-gallon breeding tank at 28.5 °C, and a light (14 h)/dark (10 h) cycle was used to trigger breeding and fertilization of embryos. Each given developmental stage embryos were collected, transferred into a petri dish containing egg water (1.0 mM NaCl in DI water), and washed three times with egg water to remove the surrounding debris. All experiments involving embryos and zebrafish were conducted in compliance with the IACUC guidelines.
Quantitative Study of Dose and Stage-Dependent Toxicity of the Ag NPs
The given-stage embryos were incubated with a dilution series of the Ag NPs (0, 2, 4, 8, 16, and 24 pM) or (0, 6.03, 12.06, 24.12, 48.24, and 72.36 mg/L) in a 24-well plate with four embryos per well at 28.5 °C (water bath) for 2 h (acute treatment). The embryos were then thoroughly rinsed with egg water to remove external NPs, and re-placed in the wells of a new well-plate containing egg water with 4 embryos per well. As control experiments, the embryos that had been incubated with egg water (blank control) or supernatant of the last-washing of the NPs (in the absence of NPs) for 2 h were rinsed and placed in two rows of the same well-plates, aiming to determine any potential effects of trace chemicals from NP synthesis upon embryonic development.
The embryos in the well-plates were incubated in the water bath at 28.5°C, and directly imaged at room temperature every 24 h using an inverted microscope (Zeiss Axiovert) equipped with a CCD camera (CoolSnap, Roper Scientific) and a digital color camera (Sony). Each experiment was carried out 4 times. The 48 embryos at each given-stage (4 repeat experiments with 3 replicates of 4 embryos per measurement) were studied for each given NP concentration to gain representative statistics.
Imaging and Characterization of Ag NPs Embedded inside Zebrafish
The given-stage embryos were incubated with given concentrations of the Ag NPs (0–24 pM) for 2 h, thoroughly rinsed with egg water, and developed to normal or deformed zebrafish in egg water at 120 hpf. The normal and deformed zebrafish were rinsed with DI water to remove any external NPs, fixed using a tissue processor (Microm STP-120 Spin, Thermo Fisher Scientific), then embedded with paraffin using a tissue embedding center (Shandon Histocentre™ 3 Embedding Center), and finally sectioned to prepare thin-layer tissue samples (2–4 μm thickness) using a microtome (HM360 rotary microtome, Thermo Fisher Scientific), as we described previously.6, 20–21, 23 Individual Ag NPs embedded in the tissues of interest was determined using their LSPR spectra acquired by DFOMS-MSIS.
Statistical Analysis
For characterization of sizes, shapes, LSPR spectra, and stability (non-aggregation) of single Ag NPs, 300 individual NPs were studied for each sample with a minimum of 100 NPs per measurement. For study of dose and stage-dependent biocompability and toxicity of Ag NPs toward embryonic development, 48 embryos at each given-stage were studied for each NP concentration with 4 repeating measurements, and each measurement has 12 embryos with 4 embryos per well. We used statistical analysis (ANOVA, Tukey’s, SigmaStat 3.5, with p = 0.05) to examine significant differences among our observations of normal, dead and deformed zebrafish in different concentrations of Ag NPs and different-stage of embryos.
Results and Discussion
Synthesis and Characterization of Purified and Stable Ag NPs (97 ± 13 nm)
We have synthesized and purified the Ag NPs as described in Methods.12, 23 TEM image and histogram of size distribution of single Ag NPs show the polygon NPs with average sizes of 97 ± 13 nm, ranging from 72 to 147 nm with aspect ratios of 0.97–3.9 (Figure 1A and B). The dark-field optical images of single Ag NPs and their LSPR spectra (Figure 1C and D) show individual plasmonic green, yellow and red NPs, with peak wavelengths (full-width-at-half-maximum), λmax (FWHM), of 565 (146), 585 (129), and 615 (132) nm, respectively.
Figure 1.

Characterization of sizes, shapes and plasmonic optical properties of single Ag NPs suspended in egg water (24 pM) at 28.5°C over 120 h. (A) HRTEM images show polygon shaped NPs. (B) Histogram of the size distribution of single Ag NPs measured by HRTEM shows the average sizes of (97 ± 13) nm. The size of each NP is determined by averaging its length and width. (C) Dark-field optical image of single Ag NPs shows individual green, yellow and red/orange NPs. (D) LSPR spectra of single Ag NPs in (C) show λmax (FWHM): (a) 565 (146); (b) 585 (129); and (c) 615 (132) nm. Scale bars are 100 nm in (A) and 2 μm in (C). The scale bar in (C) shows the distances among individual NPs, but not their sizes due to the optical diffraction limit.
To characterize the solubility and stability (non-aggregation) of the Ag NPs suspended in egg water over 120 h at 28.5 °C, we determine their number, concentrations and sizes over time using DFOMS, UV-vis spectroscopy and DLS, respectively. The results show that the number of NPs suspended in egg water remains essentially unchanged over 120 h (Figure 2A). Their UV-vis absorption spectra show that their peak absorbance of 2.1 at 459 nm (FWHM = 100 nm) and their shoulder peak absorbance of 1.9 at 400 nm (FWHM = 76 nm) remain unchanged (Figure 2B). Their sizes in egg water measured by DLS at 0 and 120 h are (89 ± 17) nm and (92 ± 19) nm, respectively. The results indicate that their sizes remain essentially unchanged over 120 h (Figure 2C). Taken together, the results (Figure 2) show that the Ag NPs (24 pM) are stable (non-aggregated) and fully suspended in egg water over 120 h.
Figure 2.

Study of stability (non-aggregation) and solubility of the Ag NPs dispersed in egg water (CNPs = 24 pM) at 28.5°C for 120 h. (A) The average number of single NPs acquired by DFOMS over time shows 167 ± 3, 171 ± 8, 167 ± 1, 172 ± 10, 180 ± 11, and 179 ± 3 NPs per image at 0, 24, 48, 72, 96, and 120 h, respectively. Each image represents an effective detection volume (area) to determine the number of single NPs in egg water over time for 120 h. We acquire 60 images in three replicate measurements with 20 images per measurement at each time point, enabling sufficient statistics that represent bulk analysis of the NPs at single NP resolution. (B) UV-Vis absorption spectra of Ag NPs in egg water at 28.5 °C for (a) 0 and (b) 120 h show that the peak absorbance of 2.1 at 459 nm (FWHM = 100 nm) and the absorbance of 1.9 at a shoulder peak of 400 nm (FWHM = 76 nm) remain essentially unchanged over 120 h. (C) Histograms of size distributions of the NPs in egg water measured by DLS show that their average sizes are (89 ± 17) nm and (92 ± 19) nm at (a) 0 and (b) 120 h incubation, respectively.
It is crucial to use purified and stable NPs to study their dose, size and stage-dependent effects on embryonic development, because the unpurified NPs could contain undetermined amounts of various chemicals involved in NP synthesis, which can cause various toxic effects and lead to inconclusive or irreproducible results. Furthermore, if the NPs were aggregated during their exposure, their sizes could increase and their concentrations could decrease over time, making the study of dose and size dependent nanotoxicity unreliable.
Specific Embryonic Developmental Stages
The five embryonic developmental stages (Figure 3): (A) cleavage (2 hours-post-fertilization, hpf), (B) early-gastrula (6 hpf), (C) early-segmentation (12 hpf), (D) late-segmentation (21 hpf), and (E) hatching stage (48 hpf), are vital checkpoints of embryonic development. Here we name them (A–E) as stage I–V embryos for easy comparison, respectively. We incubate each given stage embryos with given doses of the Ag NPs for only 2 h (acute treatment), thoroughly rinse them with egg water to remove external NPs, and then incubate and monitor their development in egg water at 28.5 °C over 120 h until they fully develop.
Figure 3.
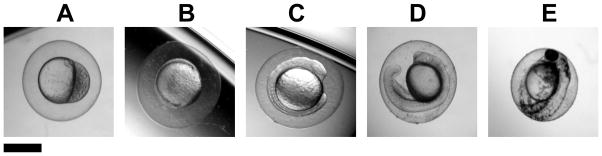
Optical images of zebrafish embryos used to incubate with the Ag NPs for 2 h: (A) cleavage (2 hpf), (B) early-gastrula (6 hpf), (C) early-segmentation (12 hpf), (D) late-segmentation (21 hpf), and (E) hatching stage (48 hpf) embryos. Here we name them (A–E) as stage I–V embryos, respectively. Scale bar is 500 μm.
Upon their 2-h exposure to the NPs, cleavage-stage embryos (stage-I: 2–4 hpf) undergo rapid cellular division and embryonic pattern formation to set forth for the development of different organs.42–43 Gastrula-stage embryos (stage-II: 6–8 hpf) undergo cell movements and migrations to rearrange two largely separable tissues, form germ layers and establish the early organ systems.44–47 Early-segmentation stage embryos (stage-III: 12–14 hpf) begin morphological cell differentiation, morphological movements, somitogenesis and notochord formation, which is important for proper development of the axial skeleton, the vertebrate spinal column, and the skeletal muscle.47 Late-segmentation stage embryos (stage IV: 21–23 hpf) undergo development of the circulatory system and the formation of heart.44 The hatching stage embryos (stage V: 48–50 hpf) are completing their embryonic development and all related organs have been formed.47
Dose and Stage-Dependent Biocompatibility and Toxicity of Ag NPs
We expose each given-stage embryos to a dilution series of the Ag NPs (0–24 pM, 0–72 μg/mL) for 2 h and monitor their development in egg water over 120 h. We characterize the molar concentrations of NPs in egg water, as we described previously.6, 20–21, 23 Note that unlike weigh/volume concentration, molar concentrations of the NPs are proportional to their number and surface area, which are more appropriate to describe their surface-dependent effects, and are used throughout our studies.6, 10, 19, 21–23 The results show that the NPs incite dose and stage-dependent nanotoxicity toward the embryonic development (Figure 4). The earlier developmental stages of embryos are more sensitive to the effect of the NPs than the later stages of embryos. Furthermore, the percentages of embryos that develop normally decrease and the percentages of dead embryos increase, as the NP concentration increases from 0 to 24 pM.
Figure 4.

Study of dose and stage-dependent effects of the Ag NPs on embryonic developments. Histograms show that the percentages of stages I–V embryos that have been incubated with (A–E) the Ag NPs or (F) supernatant for 2 h, develop to normal and deformed zebrafish or die in egg water over 120 hpf. The 48 embryos at each given stage are used for 4 repeated experiments. Each experiment includes 4 replicated measurements with 4 embryos per measurement. The means and standard deviations (error bars) of each four replicated experiments are presented. The supernatant concentration (24 pM) represents the same dilution factor of the supernatant collected from the last-washing of NPs as those prepared for 24 pM NPs from the original NP solution.
Upon the exposure of stage-I embryos to 2 pM Ag NPs (Figure 4A), (82 ± 11)% of the embryos develop normally, (16 ± 9)% of them die and (2 ± 4)% of them develop abnormally. As the NP concentration increases, the percentages of normally developed zebrafish decrease drastically. At 4 pM NPs, (42 ± 10)% of embryos develop normally, (48 ± 15)% of them die and (11 ± 7)% of them develop abnormally. At 8 pM NPs, only (22 ± 10)% of the embryos develop normally, (78 ± 10)% of them die and none of them develop abnormally. At 16 pM NPs, only (2 ± 4)% of the embryos develop normally and (98 ± 4)% of them die. At 24 pM NPs, all embryos die.
For stage-II embryos (Figure 4B), the percentages of embryos that develop normally decrease more gradually than stage-I embryos as the NP concentration increases. At 2 pM NPs, (59 ± 11)% of the embryos develop normally, (36 ± 10)% of them die, and (5 ± 5)% of them develop abnormally. At 4 pM NPs, (56 ± 15)% of embryos develop normally, (39 ± 17)% of them die, and (4 ± 4)% of them develop abnormally. At 8 pM NPs, (32 ± 14)% of the embryos develop normally, (63 ± 11)% of them die, and (5 ± 4)% of them develop abnormally. At 24 pM NPs, (13 ± 12)% of the embryos still develop normally, (82 ± 14)% of them die, and (5 ± 4)% of them develop abnormally.
For stage-III embryos (Figure 4C), they either develop normally or die, and few develop abnormally upon their acute exposure to the NPs. The percentages of embryos that develop normally decrease nearly as rapidly as the stage-I embryos as the NP concentration increases. At 2 pM NPs, (98 ± 4)% of the embryos develop normally, only (2 ± 4)% of them die, and none of them develop abnormally. At 4 pM NPs, (76 ± 15)% of embryos develop normally and (24 ± 15)% of them die. At 8 pM NPs, only (25 ± 11)% of the embryos develop normally, (72 ± 9)% of them die, and (2 ± 4)% of them develop abnormally. At 16 pM NPs, only (2 ± 4)% of the embryos develop normally, (98 ± 4)% of them die, and none of them develop abnormally. At 24 pM NPs, all embryos die.
For stage-IV embryos (Figure 4D), they either develop normally or die, and few develop abnormally upon their acute exposure to the NPs, as those observed in stage-III embryos. The percentages of embryos that develop normally decrease slightly more gradually than the stage-III embryos as the NP concentration increases. At 2 pM NPs, all embryos develop normally. At 4 pM NPs, (88 ± 13)% of embryos develop normally, (8 ± 14)% of them die and (4 ± 7)% of them develop abnormally. At 8 pM NPs, only (25 ± 13)% of embryos develop normally, (75 ± 13)% of them die and none of them develop abnormally. At 16 pM NPs, only (4 ± 4)% of the embryos develop normally, (96 ± 7)% of them die and none of them develop abnormally. At 24 pM NPs, only (4 ± 7)% of the embryos develop normally, (96 ± 7)% of them die and none of them develop abnormally, which is similar to those observed at 16 pM NPs.
For stage-V embryos (Figure 4E), they either develop normally or die, and few develop abnormally upon their acute exposure to the NPs, similar to those observed in stages III–IV embryos. The percentages of embryos that develop normally decrease much more gradually than the stage-IV embryos as the NP concentration increases. At 2 pM NPs, (94 ± 6)% of embryos develop normally, (4 ± 3)% of them die and (2 ± 3)% of them develop abnormally. At 4 pM NPs, (88 ± 16)% of embryos develop normally, and (12 ± 16)% of them die, none of them develop abnormally. At 8 pM NPs, only (50 ± 13)% of embryos develop normally, (44 ± 6)% of them die, and (6 ± 6)% of the embryos develop abnormally. At 16 pM NPs, (23 ± 14)% of the embryos develop normally, and (77 ± 10)% of them die. At 24 pM NPs, (24 ± 10)% of the embryos still develop normally, and (76 ± 10)% of them die.
We conduct two control experiments simultaneously by incubating stage I–V embryos with egg water alone (blank control) and supernatant collected from the last washing of the NPs for 2 h, and monitoring the embryonic development in egg water over 120 h. We use the same dilution factors to prepare the supernatant solutions as those to prepare NP solution. Similar to those of blank control, (94–100)% of embryos develop normally, and none of embryos develop to deformed zebrafish, and they are independent upon the concentrations (dilution factors) of supernatant (Figure 4F). The control experiments with the supernatants enable us to eliminate potential toxic effects of trace chemicals (e.g., Ag+, citrate) resulted from the Ag NP synthesis or their potential degradation over time, and to validate that the observed toxic effects of the NPs on embryonic development are attributed to the NPs.
Taken together, these interesting findings show unambiguous stage and dose dependent toxic effect of the Ag NPs upon embryonic development. The results show that stage-I embryos are most sensitive to the toxic effects of the NPs with the lowest critical concentration of NPs (3.5 pM), which is followed closely by stage-II (4 pM), stages III and IV embryos (6 pM), while stage-V embryos are most resistant to the NPs with a critical concentration of 8 pM (Table I). Here we define the critical concentration of the NPs at which only 50% of embryos develop normally.
Stage-Specific Embryonic Phenotypes
Upon the exposure of stages I and II embryos to the NPs for 2 h, some of the embryos develop to deformed zebrafish with seven types of abnormalities: (a) finfold abnormality and tail/spinal cord flexure; (b) cardiac malformations/edema, yolk sac edema, finfold abnormality and tail flexure; (c) eye abnormality, cardiac malformations/edema, yolk sac edema, finfold abnormality, and tail flexure; and (d) no eyes, head abnormality, cardiac malformations/edema, yolk sac edema, finfold abnormality, and tail flexure (Figure 5A and B), respectively. Notably, head abnormality with an enlarged brain and no eyes (Figure 5d) are only observed in the treated stages I and II embryos to 4 and 24 pM NPs, respectively. Multiple abnormalities are observed in the same zebrafish.
Figure 5.

Optical images of (A–E) deformed and (F) normal zebrafish, and (G) dead embryo: (A–E) Deformed zebrafish are observed after stages I–V embryos have been incubated with the Ag NPs for 2 h, and develop in egg water over 120 hpf, respectively. Multiple types of abnormalities occur in the same zebrafish: (a) finfold abnormality and tail flexure; (b) cardiac malformation/edema, yolk sac edema, finfold abnormality, and tail/spinal cord flexure; (c) eye abnormality, cardiac malformation/edema, yolk sac edema, finfold abnormality, and tail/spinal cord flexure; and (d) no-eye, head deformity, cardiac malformation/edema, yolk sac edema, finfold abnormality, and tail/spinal cord flexure (the most severe and rare deformities). Scale bar is 500 μm for all images.
Interestingly, we observe only five types of abnormalities (a–c) (Figure 5C and D), without no-eye and head abnormality, in the treated stages III and IV embryos. Furthermore, we observe only four types of abnormalities without eye and head abnormalities in the treated stage V embryos (Figure 5E). Similar to those observed in stages I and II embryos, multiple abnormalities are also observed in the same zebrafish.
Finfold abnormalities without fin rays and tissue structures are one type of shared abnormalities of deformed zebrafish developed from the treated stages I–V embryos. In normally developed zebrafish (Figure 5F), the finfold is a clear, thin membrane, composed of several epidermal layers that surround the entire trunk region. In deformed zebrafish, the finfold structure is disordered and in some cases non-existent, which are typically accompanied by tail flexures (Figure 5a–d, Table S1 in supporting information, SI).
Abnormal tail/spinal cord flexures are the other shared defects of deformed zebrafish developed from the treated stages I–V embryos. In normally developed zebrafish (Figure 5F), the notochord and spinal cord develop straight to the posterior-most tip of the tail. However, in the deformed zebrafish, the tail regions are flexed to some extent. In the severest cases, the tail is completely bent, kinked and truncated (Figure 5a–d, Table S1).
Cardiac malformations/edema is another type of the shared abnormalities of the deformed zebrafish developed from the treated stages I–V embryos. In contrast to normally developed zebrafish (Figure 5F), the pericardial sac region of deformed zebrafish developed from the treated embryos is swollen and enlarged. In the severest cases, the pericardial sac is extremely large and the size of cardiac ventricle is reduced (Figure 5b–d, Table S1).
Yolk sac edema is another type of the shared abnormalities of deformed zebrafish developed from the treated stages I–V embryos. In normally developed zebrafish (Figure 5F), the yolk sac region is a bulbous area containing yolk that provides nutrients to the developing embryos and it shrinks during the later developmental stages. In contrast, the deformed zebrafish show swollen and enlarged yolk sac region (Figure 5b–d, Table S1). In some cases, they also display edema of the pericardial sac region. Interestingly, yolk sac edema is accompanied by cardiac malformations/edema, abnormal tail/spinal cord flexures, and finfold abnormalities.
Eye abnormality is observed only in the deformed zebrafish developed from the treated stages I–IV embryos. In normal zebrafish, the eye is darkly pigmented with a well developed retina surrounded by a lens (Figure 5F). In deformed zebrafish, the eyes are either smaller, with abnormal structures and shapes, or without the lens (Figure 5c–d, Table S1).
The most rare and severe deformities are observed in deformed zebrafish developed from the treated stages I and II embryos. The head is swollen and enlarged with abnormal shapes and without eye (Figure 5d, Table S1). Interestingly, for both stages, these deformities are concomitant with finfold abnormality, tail flexure, cardiac malformations/edema, yolk sac edema, and eye abnormality. These results indicate that developmental events occurring during stage I and II treatments are the most critical to embryonic development and they are most sensitive to the NPs.
For stage-I embryos (Figure 6A), finfold abnormalities are the primary defects with accumulation percentage of (32 ± 2)% (sum of their percentages observed in all NPs concentrations). The percentage of finfold abnormalities increases from 5% to 26% as the NP concentration increases from 2 to 4 pM. The tail/spinal cord flexures are the secondary defects with (21 ± 1)%. Cardiac malformations/edema and yolk sac edema are the tertiary abnormalities, each with (16 ± 1)%. The eye abnormalities, head edema and no-eye are the rarely observed quaternary defects, each with (5 ± 1)%.
Figure 6.

Characterization of dose and stage-dependent embryonic developmental abnormalities: (A–E) stages I–V embryos. Histograms of the percentages of the given stage embryos, which have been incubated with given concentrations of the NPs for 2 h, and develop to deformed zebrafish in egg water at 120 hpf with: (a) finfold abnormality; (b) tail/spinal cord flexure; (c) cardiac malformation/edema; (d) yolk sac edema; (e) eye abnormality; (f) head abnormality; (g) no eye, for (A) stage-I and (B) stage-II embryos; (a–e) for (C) stage-III and (D) stage-VI embryos; and (a–d) for stage V embryos. For each given stage embryos, the percentages of the embryos that develop to each given type of the abnormality are calculated by the number of embryos that develop to that type of abnormality by the total number of embryos that develop to all types of deformities.
For stage-II embryos (Figure 6B), finfold abnormalities and tail/spinal cord flexures are the primary defects of deformed zebrafish, each with (25 ± 1)%, which is closely followed by cardiac malformations/edema and yolk sac edema as secondary and tertiary abnormalities of (20 ± 1)% and (18 ± 1)%, respectively. The eye abnormalities, head edema and no-eye are the quaternary defects of (8 ± 1)%, 3% and 3%, respectively.
For stages III and IV embryos (Figure 6C and D), finfold abnormalities, tail/spinal cord flexures, cardiac malformations/edema, yolk sac edema, and eye abnormalities are the primary defects, each with (20 ± 2)%. In contrast, for stage V embryos, cardiac malformations/edema and yolk sac edema are the primary defects, each with (30 ± 2)%, while finfold abnormalities and tail/spinal cord flexures are the secondary defects, each with (20 ± 2)%.
For stages I–II embryos, all organ structures (e.g., finfold, tail, cardiac, eye, and head) are not yet developed. However, cleavage-stage embryos (2–4 hpf) undergo rapid cell division and embryonic pattern formation.42–43 The gastrula-stage embryos (6–8 hpf) undergo substantial changes in cell shape, adhesion and migration.47 Gene regulatory systems are actively programming the embryonic tissues for their eventual roles in development.48 These earliest determinative events to generate the organ structures are ongoing. Therefore, the defects we observed 4 days later (120 hpf) must have been downstream effects of disruptions of the earliest determinative events, which include gene transcription, cell signaling, cell-cell communication, cell division and migration. Treatment of stages I and II embryos uniquely produces head and no-eye defects (Figure 5d). The occurrence of these defects is notable given that the formation of head and eye structures does not occur until many hours following the exposure, suggesting that the NPs target regulatory molecules during these determinative stages of development.
In contrast, the stage-III embryos undergo the differentiation of organ structures and formation of somites and notochord. These structures are important for proper development of the axial skeleton, the vertebrate spinal column, and the skeletal muscle.47 Thus, the effects of the NPs upon the stage-III embryos are likely to be more direct, perhaps disrupting protein synthesis and/or cytoskeletal formation required to support finfold and somite formation and their proper organization.49 Interestingly, the equal percentages of finfold abnormalities, tail/spinal cord flexures, cardiac malformations/edema, yolk sac edema, and eye abnormalities are observed.
For stage-IV embryos, the last somites, circulatory system and heart are formed, and the heart is preparing for its first contraction.44, 47 Like stage-III embryos, the effects of the NPs upon the developmental abnormalities are likely to be more direct, perhaps disrupting the formation of circulatory system and heart, which leads to the cardiac malformations/edema with extremely large pericardial sac and small cardiac ventricles. Notably, the equal percentages of cardiac malformations/edema, yolk sac edema, eye abnormalities, finfold abnormalities, and tail/spinal cord flexures are observed.
For stage-V embryos, all organs required for survival have already been developed.47 Yet, the heart is newly formed and yolk sac is still shrinking. Similar to stages III–IV embryos, the effects of the NPs upon embryonic developments are likely to be direct, perhaps disrupting the heart function and the shrinking of the yolk sac, which leads to the primary cardiac malformations/edema and yolk sac edema with extremely large pericardial sac and small cardiac ventricles.
Characterization of Single Ag NPs Embedded in Tissues of Zebrafish
To determine whether the NPs stay inside the embryos throughout their development upon their 2-h incubation with the embryos, we characterize single Ag NPs embedded in various tissues of zebrafish developed from the given stage of embryos treated with the NPs using DFOMS-MSIS. Longitudinal thin-layer sections (2–4 μm thickness) of deformed zebrafish with all types of the deformities show the NPs embedded in its eye (retina), pericardial space (heart), and tail, as characterized by distinctive LSPR spectra of individual Ag NPs (Figure 7A–C). The red shift of LSPR spectra of individual Ag NPs embedded in the tissues with much larger FWHM could be attributed to the changes of their surrounding environments and surface properties (e.g., dielectric constant of embedded medium) which differ from egg water (Figure 1D), and/or the increase of their sizes.
Figure 7.

Imaging and characterization of individual Ag NPs embedded in the tissues of (AC) deformed zebrafish and (D–F) normal zebrafish (control) using DFOMS-MSIS. Optical image of thin-layer longitudinal section of fixed (A) deformed zebrafish with five types of deformities; and (D) normal zebrafish. (C) and (F): zoom-in optical images of the tissue sections of (a–c) as highlighted in (A) and (D), respectively: (a) eye (retina), (b) pericardial space, and (c) tail. (B) LSPR spectra of individual Ag NPs as circled in (C) show distinctive λmax (FWHM): (a) 567 (176), (b) 688 (185), and (c) 759 (179) nm. (E) Scattering intensity of the tissues of normal zebrafish in (F) shows background (non-distinctive plasmonic colors). Scale bars in (A and D) are 250 μm and in (C and F) are 5 and 30 μm, respectively.
We did not observe the blue-shift of the LSPR spectra of single Ag NPs embedded in the tissues of zebrafish. The results show that the Ag NPs are not degraded (broken apart or dissolved) during their incubation with the embryos. If the Ag NPs were degraded, dissolved or broken apart, we would have observed the blue-shift of their LSPR spectra due to the decrease of their sizes.50 Note that our DFOMS-MSIS is sufficiently sensitive to detect the change of single molecules on the surface of single NPs.3, 7
Using the same approaches, we also prepare the thin-layer sections of the normally developed zebrafish from the control experiments (acute exposure of the embryos to egg water or supernatant for 2 h, and fully develop in egg water at 120 hpf) and characterize the scattering spectra of the tissues using DFOMS-MSIS (Figure 7D–F). The scattering spectra of the tissues of the eyes, heart and tails show broad background (Figure 7E), which are unlike the distinctive LSPR spectra of single Ag NPs (Figure 7B).
Taken together, these results show that such large Ag NPs (97 ± 13 nm) enter the developing embryos during their 2-h incubation, and the NPs remain inside the embryos throughout their development. The results demonstrate that LSPR spectra of single Ag NPs embedded in the tissues can be used to unambiguously identify and determine single Ag NPs in the tissues (Figure 7B), even though the optical images themselves (Figure 7A, C) cannot clearly display the NPs due to the high background scattering of the tissues. The results (Figure 7) clearly show that the LSPR spectra of single Ag NPs can be used for quantitative and qualitative detection of single Ag NPs in tissues. Unlike any conventional methods (e.g., ICP-MS or atomic absorption spectroscopy), DFOMS-MSIS offers single NP sensitivity, the sub-micrometer spatial resolution, simple sample preparation, and high-throughput capability for in situ analysis of single NPs embedded in the tissues. Furthermore, DFOMS-MSIS is a non-invasive method, and can preserve tissue samples, especially rare phenotypes, for further analysis.
Summary
In summary, we have synthesized and characterized stable and purified Ag NPs (97 ±13 nm). We found that the Ag NPs stayed inside the embryos throughout their developments (120 h) upon their 2-h incubation with each given stage of embryos. Notably, the Ag NPs incite distinctive stage-dependent toxicity and create stage-specific phenotypes. The cleavage-stage embryos are most sensitive to the toxic effect of the NPs with the lowest critical concentration of NPs (3.5 pM), which is followed by gastrula-stage embryos (4 pM), and early and late-segmentation stage embryos (6 pM), while hatching embryos are most resistant to the NPs (8 pM). Cleavage-stage and gastrula-stage embryos develop to seven types of abnormalities, including head abnormality and no-eye, while early and late-segmentation stage embryos develop to only five types of abnormalities without head and no-eye deformities, and hatching embryos develops to four types of abnormalities without eye and head deformities. The observed abnormalities developed from the treated cleavage and gastrula-stage embryos suggest that NPs disrupt early determinative events (e.g., cell signaling and gene transcription) and create downstream effects upon embryonic development. The observed abnormalities developed from the treated segmentation-stage and hatching embryos suggest direct effects of the NPs upon embryonic development. The disruption of the early determinative events is more effective to create abnormalities and they are more deadly than the direct effects of the NPs. The toxic effects of NPs on embryonic development increase with their concentration, showing an unclear threshold, which indicates that Ag NPs differ from conventional chemicals. In comparison with our study of the smaller Ag NPs (13.1 ± 2.5 nm),51 we found striking size, stage and dose-dependent toxic effect of Ag NPs upon embryonic development, suggesting that the NPs can create specific target in embryonic development using their sizes and doses. Work is in progress to identify their possible regulatory targets, and their related molecular mechanisms.
Supplementary Material
Table 1.
Summary of Critical Concentrations of Ag NPs (97 ± 13 nm) toward Embryonic Development
Developmental stage of zebrafish used to incubate with Ag NPs for 2 h.
Concentration of Ag NPs that leads to only 50% of embryos develop normally
Acknowledgments
Funding Sources
This work is supported in part by NSF (NIRT: CBET 0507036) and NIH (R01 GM0764401). Lee, Browning, and Nallathamby are grateful for the support of NSF-GRAS (CBET 0541661), NIH-GRAS (R01 GM076440-01S1), and Dominion Scholar Fellowship, respectively.
Abbreviations
- Ag
silver
- Au
gold
- DFOMS
dark-field optical microscopy and spectroscopy
- DI
deionized
- DLS
dynamic light scattering
- hpf
hours-post-fertilization
- HRTEM
high-resolution transmission electron microscope
- LSPR
localized surface plasmon resonance
- MSIS
multi-spectral imaging system
- nm
nanometer
- NP
nanoparticles
- w/v
Weight/volume
Footnotes
Table SI: Summary of normal and deformed zebrafish developed from given-stage embryos acutely treated with the Ag NPs (97 ± 13 nm) for 2 h
This information is available free of charge via the Internet at http://pubs.acs.org/
References
- 1.Xu X-HN, Patel RP. Imaging and Assembly of Nanoparticles in Biological Systems. In: Nalwa HS, editor. Handbook of Nanostructured Biomaterials and Their Applications in Nanobiotechnology. American Scientific Publishers; Los Angeles, California: 2005. pp. 435–456. [Google Scholar]
- 2.Bao G, Mitragotri S, Tong S. Multifunctional Nanoparticles for Drug Delivery and Molecular Imaging. Annu Rev Biomed Eng. 2013;15:253–282. doi: 10.1146/annurev-bioeng-071812-152409. [DOI] [PMC free article] [PubMed] [Google Scholar]
- 3.Huang T, Nallathamby PD, Xu X-HN. Photostable single-molecule nanoparticle optical biosensors for real-time sensing of single cytokine molecules and their binding reactions. J Am Chem Soc. 2008;130:17095–17105. doi: 10.1021/ja8068853. [DOI] [PMC free article] [PubMed] [Google Scholar]
- 4.Kelly KL, Coronado E, Zhao LL, Schatz GC. The optical properties of metal nanoparticles: the influence of size, shape, and dielectric environment. J Phys Chem B. 2003;107:668–677. [Google Scholar]
- 5.Kreibig U, Vollmer M. Optical Properties of Metal Clusters. Springer; Berlin: 1995. pp. 14–123. [Google Scholar]
- 6.Lee KJ, Nallathamby PD, Browning LM, Osgood CJ, Xu XHN. In vivo imaging of transport and biocompatibility of single silver nanoparticles in early development of zebrafish embryos. ACS Nano. 2007;1:133–143. doi: 10.1021/nn700048y. [DOI] [PMC free article] [PubMed] [Google Scholar]
- 7.Huang T, Browning LM, Xu XHN. Far-field photostable optical nanoscopy (PHOTON) for real-time super-resolution single-molecular imaging of signaling pathways of single live cells. Nanoscale. 2012;4:2797–2812. doi: 10.1039/c2nr11739h. [DOI] [PubMed] [Google Scholar]
- 8.Huang T, Nallathamby PD, Gillet D, Xu X-HN. Design and synthesis of single nanoparticle optical biosensors for imaging and characterization of single receptor molecules on single living cells. Anal Chem. 2007;79:7708–7718. doi: 10.1021/ac0709706. [DOI] [PMC free article] [PubMed] [Google Scholar]
- 9.Nallathamby PD, Lee KJ, Desai T, Xu XHN. Study of multidrug membrane transporters of single living pseudomonas aeruginosa cells using size-dependent plasmonic nanoparticle optical probes. Biochemistry. 2010;49:5942–5953. doi: 10.1021/bi100268k. [DOI] [PMC free article] [PubMed] [Google Scholar]
- 10.Nallathamby PD, Lee KJ, Xu XHN. Design of stable and uniform single nanoparticle photonics for in vivo dynamics imaging of nanoenvironments of zebrafish embryonic fluids. ACS Nano. 2008;2:1371–1380. doi: 10.1021/nn800048x. [DOI] [PMC free article] [PubMed] [Google Scholar]
- 11.Mie G. Beitrag zur optik truber medien, speziell kolloidaler metrall sungen. Annu Phys. 1908;25:377–445. [Google Scholar]
- 12.Nallathamby PD, Huang T, Xu XHN. Design and characterization of optical nano rulers of single nanoparticles using optical microscopy and spectroscopy. Nanoscale. 2010;2:1715–1722. doi: 10.1039/c0nr00303d. [DOI] [PMC free article] [PubMed] [Google Scholar]
- 13.Mulvaney P. Surface plasmon spectroscopy of nanosized metal particles. Langmuir. 1996;12:788–800. [Google Scholar]
- 14.Huang T, Xu X-HN. Synthesis and characterization of tunable rainbow colored silver nanoparticle solutions using single-nanoparticle plasmonic microscopy and spectroscopy. J Mater Chem. 2010;20:9867–9876. doi: 10.1039/C0JM01990A. [DOI] [PMC free article] [PubMed] [Google Scholar]
- 15.Pastoriza-Santos I, Liz-Marzan LM. Colloidal silver nanoplates. state of the art and future challenges. J Mat Chem. 2008;18:1724–1737. [Google Scholar]
- 16.Lee KJ, Browning LM, Huang T, Ding F, Nallathamby PD, Xu X-HN. Probing of multidrug ABC membrane transporters of single living cells using single plasmonic nanoparticle optical probes. Anal Bioanal Chem. 2010;397:3317–3328. doi: 10.1007/s00216-010-3864-8. [DOI] [PMC free article] [PubMed] [Google Scholar]
- 17.Xu XHN, Brownlow WJ, Kyriacou SV, Wan Q, Viola JJ. Real-time probing of membrane transport in living microbial cells using single nanoparticle optics and living cell imaging. Biochemistry. 2004;43:10400–10413. doi: 10.1021/bi036231a. [DOI] [PubMed] [Google Scholar]
- 18.Xu X-HN, Chen J, Jeffers RB, Kyriacou SV. Direct measurement of sizes and dynamics of single living membrane transporters using nano-optics. Nano Lett. 2002;2:175–182. [Google Scholar]
- 19.Browning LM, Huang T, Xu XHN. Real-time in vivo imaging of size-dependent transport and toxicity of gold nanoparticles in zebrafish embryos using single nanoparticle plasmonic spectroscopy. Interface Focus. 2013;3:20120098. doi: 10.1098/rsfs.2012.0098. [DOI] [PMC free article] [PubMed] [Google Scholar]
- 20.Browning LM, Lee KJ, Huang T, Nallathamby PD, Lowman J, Xu XHN. Random walk of single gold nanoparticles in zebrafish embryos leading to stochastic toxic effects on embryonic developments. Nanoscale. 2009;1:138–152. doi: 10.1039/b9nr00053d. [DOI] [PMC free article] [PubMed] [Google Scholar]
- 21.Lee KJ, Browning LM, Nallathamby PD, Desai T, Cherukui P, Xu X-HN. In vivo quantitative study of size-dependent transport and toxicity of single silver nanoparticles using zebrafish embryos. Chem Res Toxico. 2012;25:1029–1046. doi: 10.1021/tx300021u. [DOI] [PMC free article] [PubMed] [Google Scholar]
- 22.Lee KJ, Browning LM, Nallathamby PD, Xu XHN. Study of charge-dependent transport and toxicity of peptide-functionalized silver nanoparticles using zebrafish embryos and single nanoparticle plasmonic spectroscopy. Chem Res Toxicol. 2013;26:904–917. doi: 10.1021/tx400087d. [DOI] [PMC free article] [PubMed] [Google Scholar]
- 23.Lee KJ, Nallathamby PD, Browning LM, Desai T, Cherukui P, Xu XHN. Single nanoparticle spectroscopy for real-time in vivo quantitative analysis of transport and toxicity of single nanoparticles in single embryos. Analyst. 2012;137:2973–2986. doi: 10.1039/c2an35293a. [DOI] [PubMed] [Google Scholar]
- 24.den Hertog J. Chemical Genetics: Drug Screens In Zebrafish. Biosci Rep. 2005;25:289–297. doi: 10.1007/s10540-005-2891-8. [DOI] [PubMed] [Google Scholar]
- 25.Hill AJ, Teraoka H, Heideman W, Peterson RE. Zebrafish as a model vertebrate for investigating chemical toxicity. Toxicol Sci. 2005;86:6–19. doi: 10.1093/toxsci/kfi110. [DOI] [PubMed] [Google Scholar]
- 26.Kahn P. Zebrafish hit the big time. Science. 1994;264:904–905. doi: 10.1126/science.8178149. [DOI] [PubMed] [Google Scholar]
- 27.Langheinrich U. Zebrafish: a new model on the pharmaceutical catwalk. Bioessays. 2003;25:904–912. doi: 10.1002/bies.10326. [DOI] [PubMed] [Google Scholar]
- 28.Lieschke GJ, Currie PD. Animal models of human disease: zebrafish swim into view. Nat Rev Genet. 2007;8:353–367. doi: 10.1038/nrg2091. [DOI] [PubMed] [Google Scholar]
- 29.Peterson RT, Macrae CA. Systematic approaches to toxicology in the zebrafish. Annu Rev Pharmacol Toxicol. 2012;52:433–453. doi: 10.1146/annurev-pharmtox-010611-134751. [DOI] [PubMed] [Google Scholar]
- 30.Pichler FB, Laurenson S, Williams LC, Dodd A, Copp BR, Love DR. Chemical discovery and global gene expression analysis in zebrafish. Nat Biotechnol. 2003;21:879–883. doi: 10.1038/nbt852. [DOI] [PubMed] [Google Scholar]
- 31.Ali S, Champagne DL, Spaink HP, Richardson MK. Zebrafish embryos and larvae: a new generation of disease models and drug screens. Birth Defects Res C Embryo Today. 2011;93:115–133. doi: 10.1002/bdrc.20206. [DOI] [PubMed] [Google Scholar]
- 32.Howe K, et al. The zebrafish reference genome sequence and its relationship to the human genome. Nature. 2013;496:498–503. doi: 10.1038/nature12111. [DOI] [PMC free article] [PubMed] [Google Scholar]
- 33.Woods IG, Kelly PD, Chu F, Ngo-Hazelett P, Yan YL, Huang H, Postlethwait JH, Talbot WS. A comparative map of the zebrafish genome. Genome Res. 2000;10:1903–1914. doi: 10.1101/gr.10.12.1903. [DOI] [PMC free article] [PubMed] [Google Scholar]
- 34.Woods IG, Wilson C, Friedlander B, Chang P, Reyes DK, Nix R, Kelly PD, Chu F, Postlethwait JH, Talbot WS. The zebrafish gene map defines ancestral vertebrate chromosomes. Genome Res. 2005;15:1307–1314. doi: 10.1101/gr.4134305. [DOI] [PMC free article] [PubMed] [Google Scholar]
- 35.Fischer HC, Chan WC. Nanotoxicity: The growing need for in vivo study. Curr Opin Biotechnol. 2007;18:565–571. doi: 10.1016/j.copbio.2007.11.008. [DOI] [PubMed] [Google Scholar]
- 36.Khlebtsov N, Dykman L. Biodistribution and toxicity of engineered gold nanoparticles: a review of in vitro and in vivo studies. Chem Soc Rev. 2011;40:1647–1671. doi: 10.1039/c0cs00018c. [DOI] [PubMed] [Google Scholar]
- 37.Sayes CM, Reed KL, Warheit DB. Assessing toxicity of fine and nanoparticles: comparing in vitro measurements to in vivo pulmonary toxicity profiles. Toxicol Sci. 2007;97:163–180. doi: 10.1093/toxsci/kfm018. [DOI] [PubMed] [Google Scholar]
- 38.Bar-Ilan O, Albrecht RM, Fako VE, Furgeson DY. Toxicity assessments of multisized gold and silver nanoparticles in zebrafish embryos. Small. 2009;5:1897–1910. doi: 10.1002/smll.200801716. [DOI] [PubMed] [Google Scholar]
- 39.George S, Xia T, Rallo R, Zhao Y, Ji Z, Lin S, Wang X, Zhang H, France B, Schoenfeld D, Damoiseaux R, Liu R, Lin S, Bradley KA, Cohen Y, Nel AE. Use of a high-throughput screening approach coupled with in vivo zebrafish embryo screening to develop hazard ranking for engineered nanomaterials. ACS Nano. 2011;5:1805–1817. doi: 10.1021/nn102734s. [DOI] [PMC free article] [PubMed] [Google Scholar]
- 40.Huang T, Xu XHN. Multicolored nanometer-resolution mapping of single protein-ligand binding complex using far-field photostable optical nanoscopy (PHOTON) Nanoscale. 2011;3:3567–3572. doi: 10.1039/c1nr10182j. [DOI] [PubMed] [Google Scholar]
- 41.Westerfield M. The zebrafish book: A Guide for the Laboratory Use of Zebrafish (Danio Rerio*) 4. 1–4. University of Oregon Press; Eugene, Eugene, Oregon: 2000. [Google Scholar]
- 42.Luckenbill-edds L. Introduction: Research News in Developmental Biology in 1895 and 1995. Amer Zool. 1997;37:213–219. [Google Scholar]
- 43.Strehlow D, Heinrich G, Gilbert W. The fates of the blastomeres of the 16-cell zebrafish embryo. Development. 1994;120:1791–1798. doi: 10.1242/dev.120.7.1791. [DOI] [PubMed] [Google Scholar]
- 44.Kunz YW. Fish and Fisheries Series. Springer; Netherlands: 2004. Developmental Biology of Teleost Fishes; pp. 267–428. [Google Scholar]
- 45.Helde KA, Wilson ET, Cretekos CJ, Grunwald DJ. Contribution of early cells to the fate map of the zebrafish gastrula. Science. 1994;265:517–520. doi: 10.1126/science.8036493. [DOI] [PubMed] [Google Scholar]
- 46.Adams RJ, Kimmel CB. Morphogenetic Cellular Flows During Zebrafish Gastrulation. In: Stern CD, editor. Gastrulation: From Cells to Embryo. Cold Spring Harbor Laboratory Press; New York: 2004. pp. 305–328. [Google Scholar]
- 47.Kimmel CB, Miller CT, Moens CB. Stages of embryonic development of the zebrafish. Developmental Biology. 1995;203:253–310. doi: 10.1002/aja.1002030302. [DOI] [PubMed] [Google Scholar]
- 48.Mathavan S, Lee SG, Mak A, Miller LD, Murthy KR, Govindarajan KR, Tong Y, Wu YL, Lam SH, Yang H, Ruan Y, Korzh V, Gong Z, Liu ET, Lufkin T. Transcriptome analysis of zebrafish embryogenesis using microarrays. PLoS Genet. 2005;1:260–276. doi: 10.1371/journal.pgen.0010029. [DOI] [PMC free article] [PubMed] [Google Scholar]
- 49.Giudicelli F, Ozbudak EM, Wright GJ, Lewis J. Setting the tempo in development: an investigation of the zebrafish somite clock mechanism. PLoS Biol. 2007;5:e150. doi: 10.1371/journal.pbio.0050150. [DOI] [PMC free article] [PubMed] [Google Scholar]
- 50.Huang T, Cai W, Elsayed-Ali HE, Xu XHN. High-throughput ultrasensitive characterization of chemical, structural and plasmonic properties of EBL-fabricated single silver nanoparticles. Nanoscale. 2012;4:380–385. doi: 10.1039/c1nr11368b. [DOI] [PubMed] [Google Scholar]
- 51.Lee KJ, Browning LM, Nallathamby PD, Xu X-HN. Silver nanoparticles induce developmental stage-specific embryonic phenotypes in zebrafish. Nanoscale. 2013 doi: 10.1039/c3nr03210h. in press. [DOI] [PMC free article] [PubMed] [Google Scholar]
Associated Data
This section collects any data citations, data availability statements, or supplementary materials included in this article.