

Abstract
Depression is known to be associated with a wide array of environmental factors. Such associations are due at least in part to genetic influences on both. This issue has been little explored with preadolescent children. Measures of family chaos and parenting style at age 9 and child depressive symptoms at age 12 were completed by 3,258 twin pairs from the Twins Early Development Study and their parents. Quantitative genetic modeling was used to explore common and unique genetic and environmental influences on both family environment and later depressive symptoms. Depressive symptoms at age 12 were significantly heritable. Moderate genetic effects influenced parenting style and family chaos at the age of 9, indicating gene–environment correlation. There were significant genetic correlations between family environment and depressive symptoms. There was some evidence of a Gene×Environment interaction, with stronger genetic effects on depressive symptoms for children with more suboptimal family environment. There was an Environment×Environment interaction, with effects of nonshared environment on depressive symptoms stronger for twins with more adverse parenting experiences. There is some evidence for gene–environment correlation between aspects of family environment in middle childhood and subsequent depressive symptoms. This suggests that one of the mechanisms by which genes lead to depressive symptoms may be by themselves influencing depressogenic environments.
Rates of depressive disorder increase greatly during adolescence (Angold & Costello, 2001). Although full depressive disorder is rarer in preadolescence, with a prevalence at ages 9–12 of 1%–2% (Angold & Costello, 2001), a larger number of preadolescent children have subthreshold depressive symptoms. Such symptoms themselves may be distressing and impairing in their own right. In addition, higher depressive symptoms at this age significantly predict the later development of depressive disorder in adolescence (Goodyer, Bacon, Ban, Croudace, & Herbert, 2009; Goodyer, Herbert, Tamplin, & Altham, 2000; Rueter, Scaramella, Wallace, & Conger, 1999). This may reflect several mechanisms: above average depressive symptoms in preadolescence are the start of a gradual upward trajectory of depressive symptoms culminating in depressive disorder (Goodyer et al., 2000; Rueter et al., 1999); prior depressive symptoms make adolescents more vulnerable to the depressogenic effects of life events (Goodyer et al., 2000); depressive symptoms increase the risk of (dependent) life events, which themselves increase the risk of depression (Kendler, Gardner, & Prescott, 2002, 2006); and measured “depressive symptoms” mark the presence of temperament/personality traits that increase the risk for depression, such as neuroticism and low self-esteem (Kendler et al., 2002, 2006). It is also possible that such depressive symptoms at a younger age are not on the causal pathway for later depression but are instead markers of depression vulnerability factors including genes, hormonal dysregulation, and neural dysfunction (Goodyer, 2008; Wilkinson & Goodyer, 2011). Environmental adversity may trigger subthreshold depressive symptoms in vulnerable pre-adolescents but lead to full depressive disorder in these same individuals postpubertally, when social and endocrine factors further increase depression risk (Joinson et al., 2012).
Given that preadolescent increased depressive symptoms may be on the longitudinal etiological pathway leading to adolescent depressive disorder, it is important to develop a greater understanding of their development. This may advise us as to interventions at an early age that may reduce the later onset of depression.
The etiology of depression is highly complex and multifactorial, with both genetic and environmental mechanisms (including family environment) important (Kendler et al., 2002, 2006). Traditionally, quantitative genetic studies have partitioned variance for phenotypes (including depression) into genetic and environmental sources. This assumes that genetic and environmental effects are independent and additive. However, these assumptions are not necessarily correct: there can be a complex interplay between genetic and environmental factors.
There is the phenomenon of gene–environment correlation (rGE), whereby genes influence individual variations in exposure to adverse, and/or protective, environments. Three separate types of rGE have been described: passive, evocative/ reactive, and active (Plomin, DeFries, & Fulker, 1977). In passive rGE, parents pass on genes and also provide an environment, both of which influence the child’s development. For example, depressed parents are likely to pass on depressogenic genes to their children. They are also less likely to provide high levels of warmth and emotional support and more likely to model maladaptive thinking styles. These correlated genetic and environmental influences increase the risk of depressive symptoms in the child. In evocative rGE, heritable traits influence the reaction of others and hence the environment provided by others. For example, a shy child (partly genetically influenced) may be less fun to other children, making other children less likely to want to spend time with him or her. This adverse environment may then lead to depressive symptoms. In active rGE, a child’s heritable traits influence his or her choice of environment. For example, a shy child may have reduced motivation to go out and do enjoyable peer activities. This reduced exposure to positive environments may increase depressive symptoms. The presence of significant correlation between genetic and environmental factors can make interpretation of results difficult, because it is difficult to distinguish whether it is the genes, the environment, or both that influence an outcome of interest.
Life events have been shown to be heritable in a wide array of samples. Considering childhood and adolescence specifically, substantial heritability was shown in both the Cardiff Twin Register (ages 8–17 years; Silberg et al., 1999) and the Virginia Twin Registry (8- to 16-year-old girls; Thapar, Harold, & McGuffin, 1998). Both studies also showed a correlation between the genetic influences on life events and those on depressive symptoms (a phenomenon described as “genetic correlation”; Silberg et al., 1999; Thapar et al., 1998). Thus, the same genes may influence both depressive symptoms and the life events that increase the risk of depressive symptoms. This would suggest a possible etiological pathway for depression risk, whereby the effect of genes is (in part) mediated by their influence on exposure to depressogenic environments. (Of course, reverse causation is also possible: genes may increase the risk of depressive symptoms, and it is the depressive symptoms that themselves increase the risk of exposure to environmental adversity.)
Genetic influences have also been demonstrated for a wide variety of other environmental variables relevant to depression risk, including parental discipline style (Lau, Rijsdijk, & Eley, 2006), parent–child mutuality (Deater-Deckard & O’Connor, 2000), family environment (Plomin, Reiss, Hetherington, & Howe, 1994), parent–child bonding (Perusse, Neale, Heath, & Eaves, 1994), sibling relationships (Pike, McGuire, Hetherington, Reiss, & Plomin, 1996), peer rejection (Brendgen et al., 2009), and divorce (Jockin, McGue, & Lykken, 1996). A meta-analysis of environmental risk factors for psychiatric disorder confirmed a pooled heritability of 27% (Kendler & Baker, 2007).
Most quantitative behavioral genetic studies on rGE relevant to depression have used adult or adolescent samples. Three exceptions were studies demonstrating significant rGE for parent–child mutuality in 3-year-olds (Perusse et al., 1994), peer acceptance/rejection in 6-year-olds (Brendgen et al., 2009), and family chaos in 9- to 12-year-olds (Hanscombe, Haworth, Davis, Jaffee, & Plomin, 2010). In one further cross-sectional study, rGE was tested separately for negative life events and depressive symptoms in children under age 11 and those age 11 and older (Rice, Harold, & Thapar, 2003). There were significant genetic effects on total life events in both age groups but only in older children for behavior-dependent life events. The same genetic factors were found to influence both life events and depressive symptoms in the older (age 11 and over) children (i.e., genetic correlation). In addition, there were significant genetic effects on depressive symptoms in older children only. The authors concluded that this greater heritability of depressive symptoms in older children/adolescents is partly due to the greater opportunity for children to select and influence their environment as they age, leading to an increase in rGEs. Although the model fitting demonstrated that the genetic correlation was significantly stronger for older than younger children, the model coefficients were positive (albeit nonsignificant) for younger children. Because the sample of younger children was smaller, this negative finding may have been a Type 2 error in this age group. Therefore, larger studies are needed to test whether there is such genetic correlation (i.e., the same genetic effects influencing both environment and depressive symptoms) in younger children.
In addition to rGE, it is possible that genetic effects moderate those of environmental influences, a phenomenon labeled as gene–environment (G × E) interaction. This has been demonstrated for a number of environmental variables associated with depression in adolescence including both life events and parenting (Eaves, Silberg, & Erkanli, 2003; Lau & Eley, 2008). Although most studies, including those cited above, demonstrate that genetic effects are stronger in those with environmental adversity, one study in 6-year-old children demonstrated opposite findings, with genetic factors having a weaker effect on depressive symptoms in children who had experienced greater peer rejection (Brendgen et al., 2009). It is possible that the difference in results for this latter study may reflect age differences in the interplay between genetic and environmental influences on depressive symptoms in early childhood compared with adolescence. To date, such gene–environmental interplay has not been investigated in middle childhood.
The presence of rGE may confound studies testing for G × E interaction (Lau & Eley, 2008). It is therefore important for such studies to take such rGE into account. A number of methods have been proposed to do this. Early studies included only environmental variables that the individual, and his or her family, cannot have influence over, thus effectively excluding rGE (Rice, Harold, Shelton, & Thapar, 2006; Silberg, Rutter, Neale, & Eaves, 2001). More recently, statistical models have been developed that can simultaneously take into account rGE and G × E interaction (Price & Jaffee, 2008). Studies using such approaches with adolescent twin samples have found that when rGE was taken into account, genetic effects were greater in individuals exposed to higher levels of each environmental adversity (e.g., Eaves et al., 2003; Lau and Eley, 2008).
Although genetic factors have been unequivocally shown to increase the risk for depressive disorder, there are multiple mechanisms by which they do so, as described above. In addition, genetic factors may operate differently at different ages. Our study investigated the etiology of depressive symptoms at the age of 12 years, given that depressive symptoms at this age may be on the developmental trajectory of depressive disorder at adolescence. There is a substantial literature detailing the associations between suboptimal family environment in childhood and adolescent depressive symptoms (Dunn et al., 2011; Kendler et al., 2002, 2006). We therefore measured family environment, with questionnaires rating parental discipline, parental feelings, and family chaos. We chose questionnaires that we have previously demonstrated to be reliable and moderately heritable. This family environment was measured when children were age 9; such longitudinal analysis makes it more likely that environment causes depressive symptoms rather than depressive symptoms causing environment. Given that family environment is heritable, rGE may confound the environment–depression association (i.e., the genes lead to both the environment and the depressive symptoms, rather than the environment causing depressive symptoms). Therefore, our model included rGE terms. One developmental pathway whereby genes influence depression risk may be by causing depressogenic environments, which act as a mediator. To try to identify this, our model therefore tested separate rGE pathways: genetic factors specific to the environment and those shared with the environment and depressive symptoms (genetic correlation and mediation pathway). Another pathway whereby genes may influence the risk of depressive symptoms in childhood is by influencing individual vulnerability to environmental adversity, rather than directly affecting depressive symptoms. Our model therefore also included G×E interaction terms. Clearly, all the above processes may occur, and results from the different associations may confound each other. We therefore chose a model including all pathways (direct, rGE, and G × E interaction) so we could find independent effects of each pathway. This is the first such longitudinal investigation in children as young as 12.
Methods
Participants
The sample for this study was taken from the ongoing Twins Early Development Study (TEDS; Oliver & Plomin, 2007). TEDS is a population-based longitudinal study of approximately 15,000 pairs of twins born in England and Wales between 1994 and 1996. The twins’ zygosity was determined using a parent-rated measure of similarity that yielded 95% accuracy when compared to zygosity established from DNA markers (Price et al., 2000). Uncertainties were followed up with DNA marker testing. The sample has been shown to be reasonably representative of the UK population (Kovas, Haworth, Dale, & Plomin, 2007). The project is approved by the Institute of Psychiatry Ethics Committee, and all data were collected after obtaining informed consent. The current sample comprised those who participated in data collection waves at ages 9 and 12, which after medical exclusions consisted of approximately 3,200 twin pairs and approximately 5,600 twin pairs, respectively. Reduction of the sample size at age 9 was a result of data collection from just two of three cohorts. It was therefore not affected by a representational bias often caused by attrition.
Measures
Depressive symptoms
Depressive symptoms were rated using the short Moods and Feelings Questionnaire at age 12 (sMFQ; Angold et al., 1995). The Strengths and Difficulties Questionnaire (SDQ; Goodman, 1997, 2001; Goodman & Scott, 1999) was also completed by participants in the study. Two items in the sMFQ (“I felt miserable or unhappy” and “I was very restless”) were contextually identical to two items in the SDQ (“I am often unhappy, downhearted, or tearful” and “I am restless, I cannot stay still for long”). Thus, to prevent repetition and reduce participant load, the two items were removed from the sMFQ and replaced with the SDQ items. Internal consistency of our sMFQ composite measure (11 sMFQ items and 2 SDQ items) was high, with standardized Cronbach α of 0.86 for child-rated sMFQ and 0.85 for parent-rated sMFQ.
Environmental influences
Three aspects of the environment related to depressive symptoms were assessed when the children were 9 years: chaos in the family, parenting discipline styles, and parental feelings toward their children.
The Confusion, Hubbub, and Order Scale (CHAOS) consists of six items: “You can’t hear yourself think in our home,” “It’s a real zoo in our home,” “I have a regular bedtime routine,” “We are usually able to stay on top of things,” “There is usually a television turned on somewhere in our home,” and “The atmosphere in our house is calm” (Asbury, Dunn, & Plomin, 2006). It is designed to measure the level of routine, noise, and general environmental confusion. It is a shortened version of the original 11-item CHAOS scale (Matheny, Wachs, Ludwig, & Phillips, 1995). High CHAOS scores are correlated with objective measures of high household noise, crowding, traffic patterns, and parents being less likely to give individual children attention (Matheny et al., 1995). The perception of family home CHAOS was rated by children on a 3-point scale (very true, quite true, and not true), and the frequency was assessed over the last 3 months. Because quantitative behavioral genetic models are based on twin-specific phenotypes, child reports of CHAOS (which could vary across twins in a pair) were used. We could not use maternal reports, because they would be identical for both twins and hence have zero intertwin variance. The CHAOS scale has good rerest reliability and moderate internal consistency (Cronbach α = 0.58), as has already been demonstrated on the TEDS sample used in this study, and has been demonstrated to be moderately heritable (Hanscombe et al., 2010; Matheny et al., 1995). We hypothesize that high levels of such chaos (and the associated lack of parental attention) make it harder for children to develop the ability to regulate their own affect and are therefore associated with higher future depressive symptoms.
The parental discipline scale consisted of four items in response to the stem “When my child misbehaves, I use the following methods”: “Give a smack,” “Tell him/her off or shout at him/her,” “Explain or reason with him/her,” and “Be firm or calm with him/her.” Questions were derived from a valid semi-structured interview (Deater-Deckard et al., 1998). The parental feelings scale consisted of a seven-item shorter form of the Parental Feelings Questionnaire (Deater-Deckard, 2000): “I feel impatient with my child,” “I feel happy about my relationship with my child,” “I am amused by my child,” “I sometimes wish my child would leave me alone for a few minutes,” “My child makes me angry,” “I feel close to my child,” and “I feel frustrated by my child.” Scoring of some items was reversed to associate negative feelings with the higher value. These parenting items were scored on a 3-point scale referring to how often parents used these discipline methods/had those feelings with no specific time frame (child: very true, quite true, not true; parent: often, sometimes, rarely or never). The composites were made by taking the mean, requiring that at least 50% of the data were present. That is, the mean was drawn only if at least half of the questions were answered. Both measures were completed by parents (separately for each twin) and by the twins themselves. These scales have moderate test–retest reliability at 1 year and internal consistency (Cronbach α: parental discipline = 0.51, parental feelings = 0.70) in the TEDS sample used in this analysis, and there is a moderate correlation between monozygotic (MZ) twins (Asbury, Dunn, Pike, & Plomin, 2003; Asbury et al., 2006). Within-twin pair differences in these two questionnaires at age 4 correlates significantly with within-pair differences in anxiety, hyperactivity, conduct problems, prosocial behavior, and academic achievement at age 7, demonstrating some predictive validity of these scales (Asbury et al., 2006). All original scales were normalized using van der Wearden transformation (Lehmann, 1975). We hypothesize that overstrict discipline would be associated with higher depressive symptoms in our sample (Dunn et al., 2011). We hypothesize that lower levels of parental positive emotions toward their children would lead to greater depressive symptoms in those children.
Questionnaire booklets (separate for parents and children) were mailed to families. At the age of 9, questionnaire order was CHAOS, parental discipline, and parental feelings. Both parenting scales and the CHAOS scale have been used repeatedly in the sample whose results are presented in this manuscript. Therefore, the above reliability and consistency figures from previous papers refer to this study sample.
Statistical analysis
Environmental variables
Five measures of environment were used: parent and child-rated parental feelings and discipline, and child-rated CHAOS. Our plan was to carry out separate analyses for parent-rated and child-rated questionnaires. If similar significant results are found across raters, then they are less likely to be due to chance or confounding by factors that influence how one individual rates questionnaires. Parental ratings of a child’s environment will be less confounded by the child’s current emotional state than ratings by the child. To reduce multiple testing and make analysis more parsimonious, we used principal components analysis of the five questionnaires to try to generate a smaller set of environment measures. (The aim was to reduce the number of measures, rather than test the factor structure of the questionnaires. Therefore principal components analysis was just performed on the total scores for each of the five questionnaires, rather than all individual questionnaire items.) If there was a high correlation between parent and child ratings (making it more appropriate to use a combined measure), then parent/child ratings would load onto the same principal components. The “direct oblimin rotation” was used in the analyses to allow principal components to correlate. Principal components analysis was performed using R (R Development Core Team, 2010).
Twin model fitting
Information obtained from MZ and dizygotic (DZ) twins can be used to partition variance/covariance of traits into sources of genetic and environmental variation. MZ twins are 100% genetically identical, whereas DZ twins share on average 50% of their segregating alleles. The classical quantitative genetic twin model thus estimates the additive genetic component (A) as twice the difference between MZ and DZ correlations, and the shared-environmental (C) component is calculated as the difference between the MZ correlation and A. Because MZ twins are 100% genetically identical and share 100% C, the extent to which they do not correlate for a given trait has to be due to unique (nonshared) environmental influences (E). This estimate also includes measurement error. Detailed descriptions of twin designs and the related issues are discussed elsewhere (e.g., Plomin, DeFries, McClearn, & McGuffin, 2008; Rijsdijk & Sham, 2002).
The most comprehensive evaluation of genetic and environmental influences can be achieved with structural equation model fitting using maximum likelihood. All our analyses were executed in R (R Development Core Team, 2010), and model fitting was achieved using OpenMx, one of R’s packages (Boker et al., in press).
We used separate bivariate Cholesky decomposition models that calculated influences on both depressive symptoms (trait) and each measured environmental variable (moderators). These models allowed us to calculate accurate parameters in the presence of both G×E interaction and rGE (Purcell, 2002). Figure 1 provides an illustration of these models. First, each model partitioned the genetic influence on the variance of depressive symptoms into that which was common with measured environment (and thus represents genetic correlation, ac) and that which was unique (aU). In addition, the model partitioned genetic influence on the variance of measured environment (rGE) into that which was common to depressive symptoms (again ac) and that which was unique to environment (aM). Second, the models allowed us to calculate whether the moderators influenced the relationship between genetic factors and depressive symptoms (G × E interaction). This could be separated into G ×E interaction in the presence of rGE (i.e., when it is on the shared path, with the same genes that influence environment also moderating response to that environment, βxc) and G × E interaction independent of rGE (on the unique path, βxu). Third, although Figure 1 represents just the genetic parameters within the model, all parameters were similarly calculated for shared (C) and nonshared (E) environmental factors. All parameters are presented for each model, with 95% confidence intervals. Where the confidence interval does not include 0, this suggests that the association represented by that parameter is unlikely to be due to chance.
Figure 1.
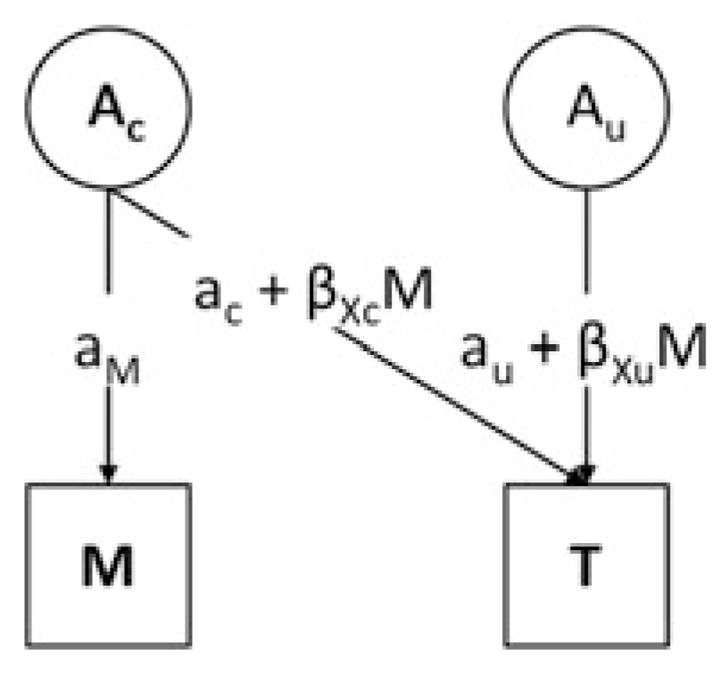
Extended Gene×Environment model to allow for gene–environment correlation (rGE). This path diagram is a simplification of a full model representing only the genetic component of that model; shared-environmental and unique environmental parts are not shown. M, moderator (measured environmental variable); T, trait (depressive symptoms); Ac, common additive genetic component (genetic component that influences both the measured environmental variable and depressive symptoms); Au, unique additive genetic component (genetic component that influences depressive symptoms but not the measured environmental variable); aM, rGE specific to the moderator; aC, rGE common to the moderator and depressive symptoms; βX c, gene–environment interaction common to the moderator and depressive symptoms; aU, genetic effect unique to the depressive symptoms; βX u, gene–environment interaction unique to the depressive symptoms.
We used a univariate heterogeneity model to test each of our variables for quantitative sex differences (is the magnitude of genetic influence different for boys and girls?) and qualitative sex differences (do the same genes affect both sexes?). The heterogeneity model is a univariate Cholesky model, which estimates A, C, and E separately for boys and girls and calculates a genetic correlation between opposite-sex DZ twins. If there was no evidence of quantitative or qualitative sex differences, the plan was for results for both genders to be combined, to maximize statistical power.
Results
Sample
Table 1 presents questionnaire scale scores and the number of twin pairs from whom data were available. Mean scores for parent- and child-rated sMFQ were, respectively, 1.80 and 3.35, both considerably lower than the recommended cutoff for likely depression of 8.0 (Angold et al., 1995). Ninety-four percent of the baseline sample were White European and 47% were male.
Table 1.
Descriptive statistics of untransformed scales and final composites
| Age | Rater | Variable | Mean | SD | Skew | Kurtosis | N (MZ) | N (DZ) |
|---|---|---|---|---|---|---|---|---|
| 9 | Parent | Parental feelings | 3.36 | 2.08 | 0.65 | 0.81 | ||
| Parental discipline | 2.39 | 1.21 | 0.46 | −0.05 | ||||
| Parenting PC | 0.00 | 0.84 | 0.17 | 0.09 | 1,204 | 2,054 | ||
| Child | Parental feelings | 4.34 | 2.27 | 0.43 | 0.10 | |||
| Parental discipline | 3.20 | 1.58 | 0.39 | −0.17 | ||||
| Parenting PC | 0.00 | 0.87 | 0.08 | 20.07 | 1,158 | 1,977 | ||
| CHAOS | 4.46 | 2.32 | 0.42 | −0.13 | ||||
| CHAOS PC | 0.00 | 1.00 | 0.07 | 20.14 | 1,113 | 1,878 | ||
| 12 | Parent | sMFQ | 1.80 | 2.82 | 2.94 | 11.97 | ||
| sMFQa | 0.00 | 0.87 | 0.69 | 20.29 | 2,011 | 3,549 | ||
| Child | sMFQ | 3.35 | 3.90 | 1.94 | 4.38 | |||
| sMFQa | 0.00 | 0.93 | 0.36 | 20.39 | 2,009 | 3,562 |
Note: The scales that were used in the final gene–environment model are in bold. MZ, monozygotic twin pairs, DZ, dizygotic twin pairs; PC, principal component; CHAOS, Confusion, Hubbub, and Order Scale; sMFQ, Mood and Feelings Questionnaire, Short Form; N, number of twin pairs with no missing values.
van der Wearden transformed.
Questionnaire psychometrics and principal components analysis
The proportion of questionnaires with all items completed ranged from 94% to 99%. Internal consistency of questionnaires was moderate. For parental feelings, the Cronbach αs were 0.67 (parent rated) and 0.63 (child rated). For parental discipline, the αs were 0.44 (parent rated) and 0.41 (child rated).
The scree plot from the principal components analysis of the five environmental questionnaire composites suggested a three or four principal component solution would be most appropriate. As there was no significant difference in fit between the three and four principal component solutions, a three principal component solution was chosen, because it gave greater parsimony. The CHAOS composite loaded highly (0.83) onto the first principal component (named “child-rated CHAOS”), the second principal component consisted of the parent-rated discipline and the feelings subscales (0.76 and 0.81, respectively, principal component named “parent-rated parenting”), and the child-rated discipline and feelings subscales loaded onto the third principal component (0.71 and 0.88, respectively, principal component named “child-rated parenting”).
The parent–child correlation coefficient for rating of parenting was 0.41. This was reflected in the principal components analysis in which parent-rated and child-rated parenting loaded onto separate principal components. The parent–child correlation coefficient for rating of depressive symptoms was 0.41. This supported our separate analysis for child/parent-rated measures.
Attrition
Eighty percent of participants who provided data on environment at 9 years also provided data on depressive symptoms at 12. There were no significant differences in measured baseline environment data between those who stayed in and those who dropped out of the study (all Cohen d < 0.07, all t < 1.4, all p > .15). Attrition was not related to ethnicity ( p = .8). Boys had greater attrition (22%) than girls (18%), a difference that was small but statistically significant (χ2 = 18, p < .0005).
Phenotypic analyses
The correlations between depressive symptoms and each of the environmental measures are presented in Table 2. All correlations were modest but statistically significant. Correlations were stronger for within-rater than for cross-rater analyses.
Table 2.
Phenotypic correlations between environment measures and depressive symptoms
| Moderator | Parent-Rated MFQ
|
Child-Rated MFQ
|
||
|---|---|---|---|---|
| r2 | N | r2 | N | |
| Parent-rated parenting | .25 (.21–.28) | 2608 | .19 (.16–.23) | 2,607 |
| Child-rated parenting | .15 (.12–.19) | 2570 | .22 (.18–.26) | 2,572 |
| Child-rated CHAOS | .20 (.16–.24) | 2510 | .28 (.24–.32) | 2,512 |
Note: The 95% confidence intervals are in parentheses. MFQ, Mood and Feelings Questionnaire; N, number of twin pairs with no missing values; CHAOS, Confusion, Hubbub, and Order Scale.
Genetic analyses
Table 3 provides the intraclass correlations for MZ and DZ twins on our principal components derived from our questionnaires. The results of the univariate heterogeneity model indicated no significant qualitative or quantitative sex differences (i.e., there was no difference in the magnitude of genetic influence between sexes, and no evidence that different genes affect both sexes; this does not mean that depressive symptoms nor environments were the same between sexes, just that genetic effects did not differ between sexes; results available from corresponding author on request). Therefore, results from male and female twins were combined for all analyses. In addition, the lack of different effects between sexes rendered it unnecessary to further explore the differential attrition of males and females.
Table 3.
Intraclass twin correlations of environment measures and depressive symptoms
| Variable | MZ | DZ |
|---|---|---|
| Parent-rated parenting | .94 (.94–.95) | .76 (.74–.78) |
| Child-rated parenting | .60 (.56–.63) | .45 (.41–.48) |
| Child-rated CHAOS | .66 (.63–.69) | .52 (.49–.56) |
| Parent-rated sMFQ | .72 (.69–.74) | .46 (.43–.48) |
| Child-rated sMFQ | .49 (.46–.53) | .30 (.27–.33) |
Note: The 95% confidence intervals are in parentheses. MZ, monozygotic twin pairs, DZ, dizygotic twin pairs; CHAOS, Confusion, Hubbub, and Order Scale; sMFQ, Mood and Feelings Questionnaire, Short Form.
Correlations were higher between MZ than DZ twins for all measures, suggesting all measures were under some genetic influence. All twin–twin correlations were lower for child-rated measures than the same parent-rated measure, suggesting a greater influence of nonshared environment on child-rated measurement. Table 4 provides parameter estimates (with 95% confidence intervals) for genetic, shared-environmental, and nonshared environmental components, taking into account rGE and G×E interaction.
Table 4.
Parameter estimates (95% confidence intervals) of additive genetic, common environment, and unique environment components
| Measure of Environment | Measure of Depressive Symptoms | |||||
|---|---|---|---|---|---|---|
| Additive Genetic Parameters | aM | aC | aU | βXc | βXu | |
|
| ||||||
| Parent-rated parenting | Parent-rated sMFQ | .50 (.48–.53) | .18 (.13–.24) | .62 (.57–.67) | .04 (−.03–.09) | .02 (−.03–.07) |
| Child-rated sMFQ | .50 (.48–.53) | .07 (.00–.14) | .61 (.52–.67) | .10 (.04–.17) | .01 (−.07–.09) | |
| Child-rated parenting | Parent-rated sMFQ | .41 (.31–.48) | .00 (.00–.09) | .65 (.60–.70) | .02 (−.08–.11) | .02 (−.03–.07) |
| Child-rated sMFQ | .41 (.32–.49) | .04 (.00–.18) | .60 (.53–.65) | .07 (−.04–.15) | .05 (−.01–.10) | |
| Child-rated CHAOS | Parent-rated sMFQ | .51 (.42–.58) | .05 (.00–.14) | .65 (.60–.70) | .01 (−.08–.11) | .06 (.01–.11) |
| Child-rated sMFQ | .50 (.42–.58) | .22 (.09–.35) | .56 (.45–.58) | .08 (−.08–.16) | −.01 (−.08–.08) | |
|
| ||||||
| Shared Environment Parameters | cM | cC | cU | βYc | βYu | |
|
| ||||||
| Parent-rated parenting | Parent-rated sMFQ | .63 (.60–.66) | .10 (.05–.15) | .32 (.22–.40) | −.01 (−.06–.05) | .08 (−.02–.16) |
| Child-rated sMFQ | .63 (.60–.66) | .16 (.10–.21) | .19 (.00–.34) | −.05 (−.10–.01) | .04 (−.17–.18) | |
| Child-rated parenting | Parent-rated sMFQ | .51 (.45–.57) | .22 (.14–.27) | .25 (.08–.35) | .01 (−.06–.08) | .06 (−.06–.14) |
| Child-rated sMFQ | .51 (.45–.56) | .28 (.19–.35) | .00 (.00–.26) | −.05 (−.11–.02) | .00 (−.13–.13) | |
| Child-rated CHAOS | Parent-rated sMFQ | .63 (.57–.69) | .21 (.14–.28) | .24 (.00–.34) | .04 (−.04–.09) | .02 (−.10–.14) |
| Child-rated sMFQ | .63 (.58–.69) | .21 (.12–.30) | .16 (.00–.33) | −.03 (−.09–.05) | .08 (−.16–.17) | |
|
| ||||||
| Nonshared Environment Parameters | eM | eC | eU | βZc | βZu | |
|
| ||||||
| Parent-rated parenting | Parent-rated sMFQ | .20 (.19–.20) | .05 (.03–.08) | .43 (.42–.45) | −.01 (−.05–.02) | .07 (.04–.09) |
| Child-rated sMFQ | .20 (.19–.20) | .03 (.00–.07) | .65 (.63–.68) | −.04 (−.08–.01) | .03 (.00–.06) | |
| Child-rated parenting | Parent-rated sMFQ | .56 (.54–.59) | .00 (.00–.02) | .44 (.42–.46) | −.01 (−.04–.03) | .02 (.00–.05) |
| Child-rated sMFQ | .56 (.54–.58) | .04 (.00–.08) | .65 (.62–.68) | .01 (−.04–.05) | .04 (.01–.07) | |
| Child-rated CHAOS | Parent-rated sMFQ | .59 (.56–.61) | .02 (.00–.05) | .44 (.42–.46) | −.02 (−.05–.01) | .00 (−.02–.02) |
| Child-rated sMFQ | .59 (.56–.61) | .01 (.00–.05) | .66 (.63–.69) | −.01 (−.05–.04) | .03 (.00–.06) | |
Note: Where 95% does not include zero, figures are presented in bold. rGE, Gene–Environment correlation; sMFQ, Short Mood and Feelings Questionnaire; CHAOS, Confusion, Hubbub, and Order Scale; aM, rGE specific to the moderator (measured environmental variable); aC, rGE common to the moderator and depressive symptoms; aU, genetic effect specific to the trait; βXc, Gene×Environment interaction common to the moderator and depressive symptoms; βXu, Gene × Environment interaction specific to depressive symptoms; where the respective c and e replace a, common environment and nonshared environment replace additive genetic; βX, genetic interaction terms; βY, shared environment interaction terms; βZ, nonshared environment interaction terms.
Additive genetic influences
All environmental variables, as rated by both parents and twins, at age 9 were significantly heritable (aM pathways, representing unique effects of genes on environmental variables, in Table 4 were significant). This indicates rGE. Depressive symptoms at age 12 were heritable (au estimates in Table 4). Of particular note, there were correlations between the genetic influences on parent-rated parenting at age 9 and parent-reported child depressive symptoms at age 12, and between the genetic influences on child-rated CHAOS at age 9 and child-reported depressive symptoms at age 12 (aC estimates). However, although these genetic correlation analyses for other combinations of raters of environment/depression symptoms were positive, these coefficients were not statistically significant.
There was limited evidence for G×E interaction. Genetic effects (common to both measured parenting styles and depressive symptoms) on child-rated depressive symptoms were stronger in children with poorer parent-rated parenting. Genetic effects (unique to depressive symptoms) on parent-rated depressive symptoms were stronger in children with higher child-rated CHAOS. Again, other G × E interaction with different rater combinations were not statistically significant.
Shared environmental influences
Shared environment influences contributed significantly to the variance of all three environmental variables (CM estimates, Table 4). In addition, there were correlations between shared environmental influences on all measured environmental variables and depressive symptoms (Cc). Shared environmental influences specific to depressive symptoms (i.e., that did not influence the measured environmental variable in the model) were only found for child- and parent-reported parenting with parent-reported depressive symptoms. There were no significant interactions between measured environmental variables and unmeasured shared environment.
Nonshared environmental influences
As with shared environment, nonshared environment for twins contributed significantly to the variance for all environmental variables (eM estimates, Table 4). For all three environmental variables there were nonshared environment influences that were specific to depressive symptoms (i.e., that did not influence the measured environmental variable included in the model).
Finally, there were significant interactions between the specific measured environments of both parent- and child-rated parenting and the broad nonshared environment that is specific to depressive symptoms (i.e., does not influence the measured environment). Thus, at less optimal levels of parenting, the relative influence of nonshared environment was stronger on depressive symptoms. This can be seen graphically in Figure 2. However, this was only found when the same rater scored both depressive symptoms and parenting, and was nonsignificant (albeit positive) for cross-rater analyses.
Figure 2.
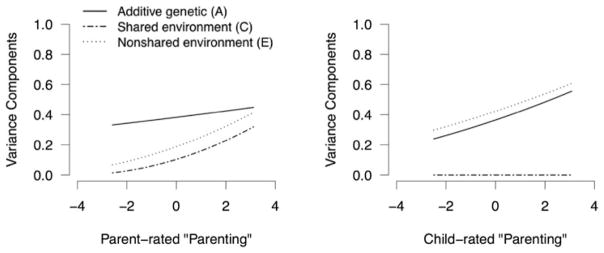
Relative influences of additive genetic, shared environmental, and nonshared environmental factors on depressive symptoms at the age of 12 and at different levels of suboptimal parenting at the age of 9, on the unique paths (i.e., environmental factors that influence depressive symptoms but not parenting). Parenting scores are van der Wearden transformed principal components. Higher scores represent more suboptimal parenting.
Discussion
This paper set out to investigate gene–environment and environment–environment interplay in the relationship between parenting style and family chaos at age 9 and depressive symptoms at age 12. By using bivariate statistical modeling, we were able to simultaneously test for rGE and G×E interaction, controlling for the confounding effects of each, and test whether common or unique factors influenced home environment and depressive symptoms.
This is the first such longitudinal study to investigate gene–environment interplay in depressive symptoms in middle childhood. The longitudinal design, with family environment measured when the twins were 9 years of age and depressive symptoms when they were 12, made it less likely that current depressive symptoms would confound reporting of environment. (It is still possible that child or parent depressive symptoms at age 9, which would be correlated with child depressive symptoms at age 12, could cause environment at age 9.) In addition, we used both parental and child reports of environmental adversity and child depressive symptoms to demonstrate whether significant effects would be seen across all rater combinations.
First, all the environmental factors we measured were correlated with depressive symptoms, consistent with substantial past research, which has demonstrated that early family environment is associated with later depressive symptoms (Kendler et al., 2002, 2006). Second, depressive symptoms at the age of 12 were significantly heritable, in models taking into account gene–environment interplay for a range of family environment measures. Thus, this heritability of depressive symptoms is not confounded by rGE (the environment, not the depression, being heritable).
Third, genetic factors (within the children) were significantly associated with both parenting and family chaos, across all raters: rGE. This is consistent with much prior research demonstrating that measures of family environment are strongly heritable in adolescents and adults (Deater-Deckard & O’Connor, 2000; Lau et al., 2006; Perusse et al., 1994; Plomin, 1994). Multiple mechanisms of rGE may operate here. Parents share on average half of their genes with their children. These genes may influence their own parenting style and the degree of chaos there is in the house (passive rGE). In addition, children’s genes may influence their behavior, and this may influence how their parents act toward them, how they feel toward them, and the degree of chaos there is in the house (evocative rGE). It is unlikely that active rGE processes operate here (children do not actively choose which family they live in or the parenting style their parents use).
Fourth, we found a significant genetic correlation with depressive symptoms for two of our three environmental measures: overlapping genetic factors influenced depressive symptoms at age 12, and parent-rated parenting and child-rated family chaos at age 9. This supports prior findings from cross-sectional data in adolescents (Lau & Eley, 2008; Rice et al., 2003). This is the first study to demonstrate this effect using longitudinal data spanning middle to late childhood. There are several possible explanations. (a) Depressogenic genes in parents may lead to them being overstrict/ less positive with their children and less able to provide an ordered household; and these genes are inherited by their child, leading to higher depressive symptoms (passive rGE). (b) Emotionality is moderately heritable, is stable over time, and influences depressive symptoms (Roberts & DelVecchio, 2000; Tackett, Waldman, Van Hulle, & Lahey, 2011). A child with higher emotionality at age 9 (with associated depressive symptoms) may evoke more negative parenting or family chaos; in addition, this emotionality is likely to lead to a higher risk of depressive symptoms at the age of 12 (evocative rGE). (c) There may be an indirect pathway, whereby genes influence parenting and family chaos (and not depressive symptoms), but this (heritable) suboptimal family environment leads to depressive symptoms. Although it is possible all three mechanisms operate, our study was not able to disentangle these putative pathways. It is also important to be cautious about these findings, because they were not found across all rater combinations; in particular, they were only seen when the same person rated both environment and depressive symptoms. Correlation coefficients were positive for these analyses for all combinations, providing some support for the positive findings. A larger sample size is needed to establish the reliability of this finding.
Fifth, we found some evidence for G×E interaction, with stronger genetic effects on depressive symptoms for children who experienced family chaos or poor parenting. This suggests that children are more vulnerable to depressive symptoms if they have the combination of vulnerability genes and suboptimal family environment. This is consistent with prior quantitative genetic findings in older adolescents and with molecular genetic findings that adults with specific genotypes are more vulnerable to the depressogenic effects of environmental adversity (Bradley et al., 2008; Karg, Burmeister, Shedden, & Sen, 2011; Lau & Eley, 2008). However, this interaction was found in some combinations of raters only, and may have been a chance finding. We should therefore be cautious about interpreting these results. These results do suggest it would be useful to test whether such a G×E interaction occurs in children in larger samples. If replicated, this would suggest that children’s genes influence their emotional reaction to family environment at age 9. To date, a G× E interaction has not been found at such a young age. However, if larger studies fail to replicate this finding, this would suggest that genes do not influence the susceptibility to environmental adversity of 9-year-old children or that genes simply do not influence the susceptibility to the family environments that have been measured. It could be possible that genes could influence susceptibility to nonfamily environment; therefore, it would be ideal if such a study would measure both family and extrafamilial environments.
It is interesting that a prior quantitative genetic study investigating G ×E interaction in 6-year-old children found a negative G × E interaction (i.e., genetic factors having a weaker effect on depressive symptoms in children who had experienced greater peer rejection; Brendgen et al., 2009). The authors’ interpretation of that finding was that at such a young age, there is little variability in how children react to and cope with peer rejection, and hence there is little opportunity for genes to influence such reactions. This is in contrast to teenagers, in whom genetic factors may contribute to such behavior and hence variability in emotional reaction. In younger children, the effect of social adversity may be so strong that genetic factors become less relevant in contributing to depressive symptoms. Our findings suggest that there may be a genetic contribution to the variation in vulnerability to familial suboptimal environment at the age of 9. However, our study is not able to answer whether this is due to variability in response and coping styles at the age of 9 or to the development of depressive symptoms over the subsequent 3 years. Replication in a larger sample is needed, with measurement of potential coping styles and depressive symptoms over multiple time points to help establish when and how genes may influence susceptibility to environmental adversity.
Environment–environment interplay
Only two facets of environment (family chaos and parenting) were directly measured in this study. However, a very large number of facets of the environment operate in the etiology of depressive symptoms. Our design allowed us to estimate the influence of unmeasured environmental variables, both those shared and those not shared between co-twins.
Both our measures of home environment had significant proportions of their variance accounted for by both shared (CM) and nonshared (EM) environmental factors. This is not a novel finding. However, what is a more novel finding is that shared environmental factors influencing measured variables of home environment at age 9 also influenced depressive symptoms at age 12 (Cc was significant for all measured environmental variables). Almost all shared-environment influencing depressive symptoms also influenced the measured environmental variables. Note that it is imperative to recognize the distinction between the terms shared environment and environments that are shared. The former relates to the experience of the environment that makes two members of the family similar, whereas the latter indicates whether the environments themselves are the same or different. Thus, one of the reasons whereby co-twins were similar in depressive symptoms at 12 may be because of shared family environment already present at age 9. These environments could have existed long before age 9 and continue up until age 12; therefore, this could indicate a cumulative effect of the environmental adversity. We did not find consistent evidence of shared environment specific to depressive symptoms. Conversely, there was a strong specific influence on depressive symptoms from non-shared environment, but only a weak common influence on both measured environmental variables and depressive symptoms. Such a pattern is not surprising: The measured family environmental variables are likely to be a component of shared environment (i.e., living in the same family home).
We found a significant interaction between parenting at age 9 (as reported by parents or children) and broad non-shared environment that is specific to depressive symptoms (i.e., does not influence the measured environment) on depressive symptoms at age 12. This suggests that if children experience less optimal parenting, they are more vulnerable to the depressogenic effects of aspects of their environment that are not shared with their twin. Because the three main domains of a child’s environment are family, school, and peers, and because twins share many components of family environment, nonshared environment may in the large part be measuring peer relationships and school. One possible conclusion from this is that it is the combination of both family and school/peer adversity that leads to depressive symptoms, and conversely that children who experience more positive parenting are more robust to difficulties with their peers or at school. However, it must be stressed that these conclusions are speculative, because this study did not specifically measure nonfamily environmental variables. It is also possible that these are chance findings; because this was not an a priori hypothesis, such results were only significant when the same rater measured environment and depressive symptoms and confidence interval lower limits were close to zero.
Even though the precise environments cannot be delineated from this study, a finding of an Environment×Environment interaction would be consistent with findings from as far back as the 1970s that there is a nonlinear relationship between environmental adversities and depression risk, with multiple adversities having a much greater effect on depression than the sum of their parts (Brown & Harris, 1978; Rutter, 1985). Despite this evidence, a lot of epidemiological research investigating environmental risk factors for depression uses an additive approach, summing adversities, an approach that has been recently criticized (Dunn et al., 2011). Our findings suggest that more complex multiplicative approaches, whereby the effects of combinations of risk factors are considered, may be more appropriate.
Limitations
Our study just measured depressive symptoms, not clinically significant depressive disorder. However, depression is likely to be a continually distributed quantitative trait, with an arbitrary cutoff (Plomin, Haworth, & Davis, 2009; Wilkinson, 2010). It is likely that the greatly reduced power from a dichotomous clinical diagnosis would outweigh any advantages from the greater accuracy of such a diagnosis compared to a continuous rating scale. Depression itself is relatively rare in this age group, yet depressive symptoms have been demonstrated to be a risk factor for subsequent depression, making this a valid end point for this sample (Goodyer et al., 2000, 2009; Rueter et al., 1999).
We did not measure depressive symptoms at the age of 9. Controlling for depressive symptoms at the time of environmental assessment would have allowed us to control for any effects of symptoms on rating of environment data. A longitudinal design with a 3-year interval reduced, but did not eliminate, this potential confounder. Future data collections on TEDS, including concurrent measures of depressive symptoms and environmental experiences, will allow us to test this in later adolescence.
Some findings were robust across all combinations of raters: genetic effects on parenting and chaos, genetic effects on depressive symptoms, and shared environmental factors influence on parenting and chaos at age 9 and also depressive symptoms at age 12. Significant cross-rater results would therefore not be confounded by the same person rating both environment and depressive symptoms. However, some of our other findings were only statistically significant for some environment–depressive symptom rater combinations. We cannot therefore be confident that these are robust results, and they may simply be Type 1 errors. They may also be caused by bias and may reflect the response tendency of individuals (e.g., an individual is likely to rate all questionnaires with high scores, even over a 3-year period). They may also be Type 2 errors, given the positive but nonsignificant coefficients. Although such complex modeling is needed to take account of both rGE and G×E interaction, even larger samples are needed to clearly demonstrate such genetic–environmental correlations.
Our measures of environment have been shown to have only moderate internal consistency and reliability in our (and other) samples. Some caution is therefore needed in interpreting results based on these questionnaires.
Future directions for translating research on rGE into intervention
This study has demonstrated, using multiple combinations of raters, that parenting styles and family chaos when a child is age 9 are likely to be influenced by a child’s genes (rGE); that these aspects of the family environment when the child is 9 are associated with depressive symptoms when those children are age 12; and that depressive symptoms at the age of 12 are significantly heritable. Shared environmental factors influenced parenting and chaos at age 9 and also depressive symptoms at age 12, suggesting a cumulative effect of these environmental factors. It is also possible that the same genetic factors influence both parenting and family chaos at age 9 and depressive symptoms at age 12; therefore, these environmental measures may partly mediate the effects of genes on risk for depressive symptoms. Given the strong association between depressive symptoms at age 12 and later major depressive disorder, it is possible that these aspects of the home environment are associated with subsequent onset of depressive disorder. Our study has demonstrated more robust evidence that genetic factors operate on the risk of childhood depressive symptoms by influencing the risk of depressogenic environment (rGE) than that they do so by influencing susceptibility to suboptimal family environment (an alternative pathway of G×E interaction).
Genetic studies have long demonstrated that genetic factors are partly responsible for the risk of depression. One response to this is to state that we cannot prevent the genetic causes of depression because the gene sequence is not alterable. However, another approach is to establish the mechanisms by which genes cause depression and, if possible, intervene on intermediate steps of the genes to depression pathway. We know that the etiological pathway for depression is complex, with long-lasting effects of childhood environmental adversity (Dunn et al., 2011; Kendler et al., 2002, 2006). Our study has suggested that suboptimal parenting and family chaos at the age of 9 increase the risk of later depressive symptoms (and hence depressive disorder at later ages). If we intervene to improve family environment at this age, we may reduce depression risk. In doing so, we would partially mitigate the effects of “depression genes.”
Further research is necessary. First, simultaneous modeling of rGE and G ×E interaction, although necessary, requires a very large sample size to have adequate power. The newness of this technology makes sample size estimation difficult. This paper has suggested that a sample size of 3,000 is inadequate, especially in a younger sample where there is less variance of depressive symptoms. A larger study would clarify whether the same genes are likely to influence both environment and depressive symptoms and home environment. A larger sample is certainly needed to test for the role of G ×E interaction. We also need to test this in samples of older adolescents, to test the effects on depressive disorder. We are following up the TEDS sample so shall be able to investigate the genetic relationships between environment at age 9 and depressive symptoms through adolescence. We hope that this follow-up study will have greater statistical power, given the greater variance in depressive symptoms at older ages.
We also need to test whether intervention to improve family environment does reduce risk of later depressive symptoms and ideally reduce risk of later depressive disorder over long-term follow-up. Much recent research has demonstrated that parent-training programs, often in a group format, improve parenting style and child behavior; such results persist over time (Scott, 2010). Such evidence-based treatment for childhood behavior disorders is now being rolled out through many parts of the United Kingdom through the Children and Young People’s Improved Access to Psychological Therapies program (http://www.iapt.nhs.uk/cyp-iapt/). Adding measures of child depressive symptoms to evaluations of such programs would be of little extra cost. If this demonstrates improved emotional health, then this would provide further evidence for the cost effectiveness of such programs and a mechanism whereby we can mitigate some of the genetic risk for depression. By making such studies of intervention genetically informed (e.g., by stratifying samples based on genetic risk for disorder), this will help us to elucidate whether such intervention mitigates the effects of genes on depressive (as well as behavior) disorders.
Acknowledgments
We gratefully acknowledge the ongoing contribution of the parents and children in the Twins Early Development Study, which is supported by a program grant (G0500079) from the UK Medical Research Council. Our work on environments is also supported by the US National Institutes of Health (HD44454). Claire Haworth is supported by a research fellowship from the British Academy.
References
- Angold A, Costello EJ. The epidemiology of depression in children and adolescents. In: Goodyer IM, editor. The depressed child and adolescent. 2. Cambridge: Cambridge University Press; 2001. pp. 143–178. [Google Scholar]
- Angold A, Costello EJ, Messer SC, Pickles A, Winder F, Silver D. The development of a short questionnaire for use in epidemiological studies of depression in children and adolescents. International Journal of Methods in Psychiatric Research. 1995;5:1–12. [Google Scholar]
- Asbury K, Dunn JF, Pike A, Plomin R. Nonshared environmental influences on individual differences in early behavioral development: A monozygotic twin differences study. Child Development. 2003;74:933–943. doi: 10.1111/1467-8624.00577. [DOI] [PubMed] [Google Scholar]
- Asbury K, Dunn JF, Plomin R. Birthweight-discordance and differences in early parenting relate to monozygotic twin differences in behaviour problems and academic achievement at age 7. Developmental Science. 2006;9:F22–F31. doi: 10.1111/j.1467-7687.2006.00469.x. [DOI] [PubMed] [Google Scholar]
- Boker S, Neale MC, Maes H, Wilde M, Spiegel M, Brick T, et al. OpenMx: An open source extended structural equation modelling framework. Psychometrika. doi: 10.1007/s11336-010-9200-6. (in press) [DOI] [PMC free article] [PubMed] [Google Scholar]
- Bradley RG, Binder EB, Epstein MP, Tang Y, Nair HP, Liu W, et al. Influence of child abuse on adult depression: Moderation by the corticotropin-releasing hormone receptor gene. Arch Gen Psychiatry. 2008;65:190–200. doi: 10.1001/archgenpsychiatry.2007.26. [DOI] [PMC free article] [PubMed] [Google Scholar]
- Brendgen M, Vitaro F, Boivin M, Girard A, Bukowski WM, Dionne G, et al. Gene–environment interplay between peer rejection and depressive behavior in children. Journal of Child Psychology and Psychiatry. 2009;50:1009–1017. doi: 10.1111/j.1469-7610.2009.02052.x. [DOI] [PubMed] [Google Scholar]
- Brown GW, Harris T. Social origins of depression: A study of psychiatric disorder in women. London: Tavistock; 1978. [Google Scholar]
- Deater-Deckard K. Parenting and child behavioural adjustment in early childhood: A quantitative genetic approach to studying family processes. Child Development. 2000;71:468–484. doi: 10.1111/1467-8624.00158. [DOI] [PubMed] [Google Scholar]
- Deater-Deckard K, O’Connor TG. Parent–child mutuality in early childhood: Two behavioral genetic studies. Developmental Psychology. 2000;36:561–570. doi: 10.1037/0012-1649.36.5.561. [DOI] [PubMed] [Google Scholar]
- Deater-Deckard K, Pike A, Petrill SA, Cutting AL, Hughes C, O’Connor TG. Multiple risk factors in the development of externalising behavior problems: Group and individual differences. Development and Psychopathology. 1998;10:469–493. doi: 10.1017/s0954579498001709. [DOI] [PMC free article] [PubMed] [Google Scholar]
- Dunn VJ, Abbott RA, Croudace TJ, Wilkinson P, Jones PB, Herbert J, et al. Profiles of family-focused adverse experiences through childhood and early adolescence: The ROOTS project a community investigation of adolescent mental health. BMC Psychiatry. 2011;11:109. doi: 10.1186/1471-244X-11-109. [DOI] [PMC free article] [PubMed] [Google Scholar]
- Eaves L, Silberg J, Erkanli A. Resolving multiple epigenetic pathways to adolescent depression. Journal of Child Psychology and Psychiatry. 2003;44:1006–1014. doi: 10.1111/1469-7610.00185. [DOI] [PubMed] [Google Scholar]
- Goodman R. The Strengths and Difficulties Questionnaire: A research note. Journal of Child Psychology and Psychiatry. 1997;38:581–586. doi: 10.1111/j.1469-7610.1997.tb01545.x. [DOI] [PubMed] [Google Scholar]
- Goodman R. Psychometric properties of the strengths and difficulties questionnaire. Journal of the American Academy of Child & Adolescent Psychiatry. 2001;40:1337–1345. doi: 10.1097/00004583-200111000-00015. [DOI] [PubMed] [Google Scholar]
- Goodman R, Scott S. Comparing the Strengths and Difficulties Questionnaire and the Child Behavior Checklist: Is small beautiful? Journal of Abnormal Child Psychology. 1999;27:17–24. doi: 10.1023/a:1022658222914. [DOI] [PubMed] [Google Scholar]
- Goodyer IM. Emanuel Miller Lecture: Early onset depressions—Meanings, mechanisms and processes. Journal of Child Psychology and Psychiatry and Allied Disciplines. 2008;49:1239–1256. doi: 10.1111/j.1469-7610.2008.01964.x. [DOI] [PubMed] [Google Scholar]
- Goodyer IM, Bacon A, Ban M, Croudace T, Herbert J. Serotonin transporter genotype, morning cortisol and subsequent depression in adolescents. British Journal of Psychiatry. 2009;195:39–45. doi: 10.1192/bjp.bp.108.054775. [DOI] [PMC free article] [PubMed] [Google Scholar]
- Goodyer IM, Herbert J, Tamplin A, Altham PM. Recent life events, cortisol, dehydroepiandrosterone and the onset of major depression in high-risk adolescents. British Journal of Psychiatry. 2000;177:499–504. doi: 10.1192/bjp.177.6.499. [DOI] [PubMed] [Google Scholar]
- Hanscombe KB, Haworth CMA, Davis OSP, Jaffee SR, Plomin R. The nature (and nurture) of children’s perceptions of family chaos. Learning and Individual Differences. 2010;20:549–553. doi: 10.1016/j.lindif.2010.06.005. [DOI] [PMC free article] [PubMed] [Google Scholar]
- Jockin V, McGue M, Lykken DT. Personality and divorce: A genetic analysic. Journal of Personality and Social Psychology. 1996;71:288–299. doi: 10.1037//0022-3514.71.2.288. [DOI] [PubMed] [Google Scholar]
- Joinson C, Heron J, Araya R, Paus T, Croudace T, Rubin C, et al. Association between pubertal development and depressive symptoms in girls from a UK cohort. Psychological Medicine. 2012;12:11. doi: 10.1017/S003329171200061X. [DOI] [PubMed] [Google Scholar]
- Karg K, Burmeister M, Shedden K, Sen S. The serotonin transporter promoter variant (5-HTTLPR), stress, and depression meta-analysis revisited: Evidence of genetic moderation. Archives of General Psychiatry. 2011;68:444–445. doi: 10.1001/archgenpsychiatry.2010.189. [DOI] [PMC free article] [PubMed] [Google Scholar]
- Kendler KS, Baker JH. Genetic influences on measures of the environment: A systematic review. Psychological Medicine. 2007;37:615–626. doi: 10.1017/S0033291706009524. [DOI] [PubMed] [Google Scholar]
- Kendler KS, Gardner CO, Prescott CA. Toward a comprehensive developmental model for major depression in women. American Journal of Psychiatry. 2002;159:1133–1145. doi: 10.1176/appi.ajp.159.7.1133. [DOI] [PubMed] [Google Scholar]
- Kendler KS, Gardner CO, Prescott CA. Toward a comprehensive developmental model for major depression in men. American Journal of Psychiatry. 2006;163:115–124. doi: 10.1176/appi.ajp.163.1.115. [DOI] [PubMed] [Google Scholar]
- Kovas Y, Haworth CMA, Dale PS, Plomin R. The genetic and environmental origins of learning abilities and disabilities in the early school years 7921. Monographs of the Society for Research in Child Development. 2007;72:1–144. doi: 10.1111/j.1540-5834.2007.00439.x. [DOI] [PMC free article] [PubMed] [Google Scholar]
- Lau JY, Eley TC. Disentangling gene–environment correlations and interactions on adolescent depressive symptoms. Journal of Child Psychology and Psychiatry. 2008;49:142–150. doi: 10.1111/j.1469-7610.2007.01803.x. [DOI] [PubMed] [Google Scholar]
- Lau JY, Rijsdijk F, Eley TC. I think, therefore I am: A twin study of attributional style in adolescents. Journal of Child Psychology and Psychiatry. 2006;47:696–703. doi: 10.1111/j.1469-7610.2005.01532.x. [DOI] [PubMed] [Google Scholar]
- Lehmann EL. Nonparametrics: Statistical methods based on ranks. San Francisco, CA: Holden–Day; 1975. [Google Scholar]
- Matheny JAP, Wachs TD, Ludwig JL, Phillips K. Bringing order out of chaos: Psychometric characteristics of the confusion, hubbub, and order scale. Journal of Applied Developmental Psychology. 1995;16:429–444. [Google Scholar]
- Oliver B, Plomin R. Twins Early Development Study (TEDS): A multivariate, longitudinal genetic investigation of language, cognition and behaviour problems from childhood through adolescence. Twin Research and Human Genetics. 2007;10:96–105. doi: 10.1375/twin.10.1.96. [DOI] [PubMed] [Google Scholar]
- Perusse D, Neale MC, Heath AC, Eaves LJ. Human parental behavior: Evidence for genetic influence and potential implication for gene–culture transmission. Behavior Genetics. 1994;24:327–335. doi: 10.1007/BF01067533. [DOI] [PubMed] [Google Scholar]
- Pike A, McGuire S, Hetherington EM, Reiss D, Plomin R. Family environment and adolescent depressive symptoms and antisocial behavior: A multivariate genetic analysis. Developmental Psychology. 1996;32:590–603. [Google Scholar]
- Plomin R. Genetics and experience: The interplay between nature and nurture. Thousand Oaks, CA: Sage; 1994. [Google Scholar]
- Plomin R, DeFries J, Fulker D. Genotype–environment interaction and correlation in the analysis of human behavior. Psychological Bulletin. 1977;84:309–322. [PubMed] [Google Scholar]
- Plomin R, DeFries JC, McClearn GE, McGuffin P. Behavioral genetics. Vol. 5. New York: Worth; 2008. [Google Scholar]
- Plomin R, Haworth CMA, Davis OSP. Common disorders are quantitative traits. Nature Reviews Genetics. 2009;10:872–878. doi: 10.1038/nrg2670. [DOI] [PubMed] [Google Scholar]
- Plomin R, Reiss D, Hetherington E, Howe GW. Nature and nurture: Genetic contributions to measures of the family environment. Developmental Psychology. 1994;30:32–43. [Google Scholar]
- Price TS, Freeman B, Craig I, Petrill SA, Ebersole L, Plomin R. Infant zygosity can be assigned by parental report questionnaire data. Twin Research. 2000;3:129–133. doi: 10.1375/136905200320565391. [DOI] [PubMed] [Google Scholar]
- Price TS, Jaffee SR. Effects of the family environment: Gene–environment interaction and passive gene–environment correlation. Developmental Psychology. 2008;44:305–315. doi: 10.1037/0012-1649.44.2.305. [DOI] [PubMed] [Google Scholar]
- Purcell S. Variance components models for gene–environment interaction in twin analysis. Twin Research. 2002;5:554–571. doi: 10.1375/136905202762342026. [DOI] [PubMed] [Google Scholar]
- R Development Core Team. R: A language and environment for statistical computing. Vienna, Austria: Author; 2010. Retrieved from www.R-project.org. [Google Scholar]
- Rice F, Harold GT, Shelton KH, Thapar A. Family conflict interacts with genetic liability in predicting childhood and adolescent depression. Journal of the American Academy of Child & Adolescent Psychiatry. 2006;45:841–848. doi: 10.1097/01.chi.0000219834.08602.44. [DOI] [PubMed] [Google Scholar]
- Rice F, Harold GT, Thapar A. Negative life events as an account of age-related differences in the genetic aetiology of depression in childhood and adolescence. Journal of Child Psychology and Psychiatry. 2003;44:977–987. doi: 10.1111/1469-7610.00182. [DOI] [PubMed] [Google Scholar]
- Rijsdijk FV, Sham PC. Analytic approaches to twin data using structural equation models. Briefings in Bioinformatics. 2002;3:119–133. doi: 10.1093/bib/3.2.119. [DOI] [PubMed] [Google Scholar]
- Roberts BW, DelVecchio WF. The rank-order consistency of personality traits from childhood to old age: A quantitative review of longitudinal studies. Psychological Bulletin. 2000;126:3–25. doi: 10.1037/0033-2909.126.1.3. [DOI] [PubMed] [Google Scholar]
- Rueter MA, Scaramella L, Wallace LE, Conger RD. First onset of depressive or anxiety disorders predicted by the longitudinal course of internalizing symptoms and parent–adolescent disagreements. Archives of General Psychiatry. 1999;56:726–732. doi: 10.1001/archpsyc.56.8.726. [DOI] [PubMed] [Google Scholar]
- Rutter M. Resilience in the face of adversity: Protective factors and resistance to psychiatric disorder. British Journal of Psychiatry. 1985;147:598–611. doi: 10.1192/bjp.147.6.598. [DOI] [PubMed] [Google Scholar]
- Scott S. National dissemination of effective parenting programmes to improve child outcomes. British Journal of Psychiatry. 2010;196:1–3. doi: 10.1192/bjp.bp.109.067728. [DOI] [PubMed] [Google Scholar]
- Silberg J, Pickles A, Rutter M, Hewitt J, Simonoff E, Maes H, et al. The influence of genetic factors and life stress on depression among adolescent girls. Archives of General Psychiatry. 1999;56:225–232. doi: 10.1001/archpsyc.56.3.225. [DOI] [PubMed] [Google Scholar]
- Silberg J, Rutter M, Neale M, Eaves L. Genetic moderation of environmental risk for depression and anxiety in adolescent girls. British Journal of Psychiatry. 2001;179:116–121. doi: 10.1192/bjp.179.2.116. [DOI] [PubMed] [Google Scholar]
- Tackett JL, Waldman ID, Van Hulle CA, Lahey BB. Shared genetic influences on negative emotionality and major depression/conduct disorder comorbidity. Journal of the American Academy of Child & Adolescent Psychiatry. 2011;50:818–827. doi: 10.1016/j.jaac.2011.05.007. [DOI] [PMC free article] [PubMed] [Google Scholar]
- Thapar A, Harold G, McGuffin P. Life events and depressive symptoms in childhood—Shared genes or shared adversity? A research note. Journal of Child Psychology and Psychiatry. 1998;39:1153–1158. [PubMed] [Google Scholar]
- Wilkinson P. Diagnosing and treating depression in adolescents. European Paediatrics. 2010;4:77–80. [Google Scholar]
- Wilkinson PO, Goodyer IM. Childhood adversity and allostatic overload of the hypothalamic–pituitary–adrenal axis: A vulnerability model for depressive disorders. Development and Psychopathology. 2011;23:1017–1037. doi: 10.1017/S0954579411000472. [DOI] [PubMed] [Google Scholar]