

Abstract
Many NGS analysis tools focusing on read alignment and variant calling functions for exome sequencing data have been developed in recent years. However, publicly available tools dealing with the downstream analysis of genome-wide variants are fewer and have limited functionality. We developed SNPAAMapper, a novel variant analysis pipeline that can effectively classify variants by region (e.g. CDS, UTRs, intron, upstream, downstream), predict amino acid change type (e.g. synonymous, non-synonymous mutation), and prioritize mutation effects (e.g. CDS versus UTRs). Additional functionality afforded by our pipeline includes: checking variants at exon/intron junctions, customized homozygosity and allele frequency cutoff parameters, and annotation of known variants with dbSNP information, listing original and mutated amino acid sequences containing variants. The final result is reported in a spreadsheet format table containing all variant associated information and prioritized amino acids effects for investigators to examine.
Availability
Perl scripts and required input files are available on the web at http://www.ccmb.med.umich.edu/ccdu /SNPAAMapper.
Keywords: SNP, Next Generation Sequencing, Downstream Analysis
Background
Next-generation sequencing (NGS) technologies, such as exome and/or whole-genome re-sequencing [1], are increasingly assisting researchers in the identification of genetic mutations. The application of this technology has been helping researchers to identify novel mutations associated with both rare and common disorders [2, 3]. As the study of genetic mutation enters the NGS era, reliable and publicly available downstream analysis tools are becoming increasingly important to the field. We developed SNPAAMapper, a single nucleotide polymorphism (SNP) annotation and amino acid mapping pipeline.
Methodology
Several initial data processing steps were used to annotate the variants. First, the short read sequences were aligned to the reference genome using BWA [4] and the SAMtools package [5] was used to call variants (SNPs and INDELs). Second, depending on the biology questions being asked, several intermediate and filter steps/parameters could be applied to select and filter these variants before the algorithms were called. The filtered Variant Call Format (VCF) file was used as the input for further processing. The overall view of the SNPAAMapper is shown in Figure 1. There are two major algorithms involved in classifying variants by regions in our variant analysis pipeline. Algorithm 1 generates a new annotation table with “coding” and other information annotated for each exon. We followed the University of California, Santa Cruz (UCSC) internal database [6] annotation coordinates (zero-based start and one-based end) to populate and/or calculate the start and end of each feature (coding region sequences or CDS, upstream or downstream sequences, untranslated regions or UTRs, intron) for each exon. Features were annotated according to their “neighboring” or deriving feature’s annotation coordinates from the UCSC. For example, if the “intronStart” was calculated from its previous exonEnd which is one-based annotation from UCSC annotation, the “intronStart” will be one-based as well.
Figure 1.
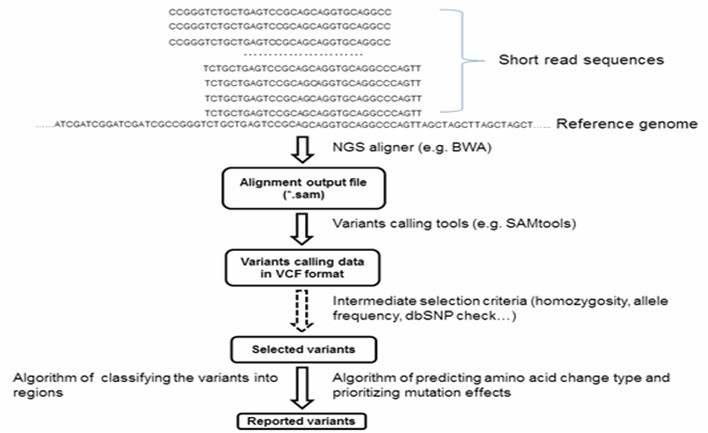
The SNPAAMapper analysis pipeline workflow
This configure file generated by Algorithm 1 was read by Algorithm 2 to assign identified variants to the genomic locus/gene(s) and to classify the variants by regions. There are two sub-algorithms in Algorithm 2: Algorithm2-Sub1 generated a list of feature (CDS, upstream, downstream, UTRs, and intron,) annotation files only once for each genome/species. Specifically, two paired files (feature_start with feature_end and feature_start with UCSC Gene ID) for each feature and one main file (chromosome_number with feature_start) were produced as described below. All start coordinates on every chromosome for each feature’s main file were recorded and sorted for the purpose of quickly locating variant’s genomic coordinate in the genome. The “end coordinate” and associated UCSC gene IDs corresponding to every start annotation for each feature was stored in two separate files. Algorithm2-Sub2 used above annotations/files to map identified variants onto the genomic location and report annotation classes. We downloaded all human (hg19) protein-coding genes’ full coding region sequences (CDS Exons) including introns between CDSs with the genomic coordinates annotated for the beginning and end of CDSs from the UCSC genome browser’s “Gene and Gene Prediction” data track [7]. The downloaded output sequence type was set to “genomic” and we also stipulated downloaded sequences format as “Exons in upper case, everything else in lower case” for easy manipulation. We also downloaded UCSC annotation table “kgXref.txt” to convert the UCSC KnownGene ID to HUGO gene symbol for final report. The pipeline used genomic coordinate to automatically classify variants into regions: non-synonymous missense (NSM), non-synonymous nonsense (NSN), and synonymous (SYN) mutation if the hit falls into a CDS, upstream, downstream, the 5’ or 3’ UTR, and intron region. The UCSC “knownGene.txt” and “kgXref.txt” annotation files from UCSC genome browser were used to obtain the information relative to the genomic location and gene for detected variants. The final mutation effect was prioritized according to the category order listed above.
SNPAAMapper Input and Output
The current SNPAAMapper pipeline accepts the VCF input file in tab-delimited format. The current final output file consists of the following columns: sample number, chromosome number, variant genomic position start, gene symbol, UCSC Gene ID, variant mapping strand, amino acid position for mutation (for CDS hit), variant type (SNP or INDEL), reference amino acid (and codon) → mutant amino acid (and codon), variant class (SYN, NSM, or NSN), reference amino acid sequence, mutated amino acid sequence, hit type (CDS, Upstream, Downstream, UTRs, or Intron hit), dbSNP ID [8] if known, reference nucleotide, alternative or called nucleotide, quality, depth, allele frequency, read categories, and other useful information from variant calling results. A sample output from SNPAAMapper on a NGS dataset is shown in our additional illustration.
Caveats and Future Development
Our pipeline provides a convenient tool that allows detected variants to be further elucidated. This pipeline facilitates the fast downstream analysis for detected variants. We believe our pipeline will supply researchers with a convenient downstream interpretation for identified variants. In comparing to snpEff [9], an open-source, state of the art variant effect predictor tool, although their performance are similar, SNPAAMapper has the functionality of annotating regulatory variants, and the mutation effect prioritization step in SNPAAMapper also greatly simplifies downstream analysis. SNPAAMapper provides maximum flexibility and allows analysis of NGS read data generated by any short, long, single-end and paired-end protocols from different NGS sequencing platforms. Current version of SNPAAMapper processes the VCF file generated by samtools-0.1.18 or its earlier version. It is also an easy-to-use pipeline for processing VCF input data. Researchers can easily run the pipeline commands by setting their customized parameters to prioritize the SNPs for wet-lab validation. The initial pipeline was written for human data, but it can be easily modified and/or extended for other species. Also, the current pipeline only reports detailed annotation information for the SNP variant class. We’ll extend our algorithms/pipeline to handle INDELs. The pipeline is also freely available for academic users to use. Users can download all input files onto their machines and run the pipeline as long as Perl is installed.
Funding
This pipeline development was supported in part by funds from the Medical School at the University of Michigan.
Acknowledgments
We thank Jan Ching Chun Hu for providing the sequencing data. We greatly appreciate Ana Grant and Jun Li for their precious comments on the manuscript.
Footnotes
Citation:Bai & Cavalcoli, Bioinformation 9(17): 870-872 (2013)
References
- 1.Bentley DR. Curr Opin Genet Dev. 2006;16:545. doi: 10.1016/j.gde.2006.10.009. [DOI] [PubMed] [Google Scholar]
- 2.Basiardes S, et al. Nature Methods. 2005;2:63. doi: 10.1038/nmeth0105-63. [DOI] [PubMed] [Google Scholar]
- 3.Ng SB, et al. Nat Genet. 2010;42:30. doi: 10.1038/ng.499. [DOI] [PMC free article] [PubMed] [Google Scholar]
- 4.Li H, Durbin R. Bioinformatics. 2009;25:1754. doi: 10.1093/bioinformatics/btp324. [DOI] [PMC free article] [PubMed] [Google Scholar]
- 5.Li H, et al. Bioinformatics. 2009;25:2078. doi: 10.1093/bioinformatics/btp352. [DOI] [PMC free article] [PubMed] [Google Scholar]
- 6.Kent WJ, et al. Genome Res. 2002;12:996. doi: 10.1101/gr.229102. [DOI] [PMC free article] [PubMed] [Google Scholar]
- 7. http://genome.ucsc.edu.
- 8. http://www.ncbi.nlm.nih.gov/SNP/
- 9.Cingolani P, et al. Fly (Austin) 2012;6:80. doi: 10.4161/fly.19695. [DOI] [PMC free article] [PubMed] [Google Scholar]