

Abstract
Preclinical evaluation of novel cancer agents requires models that accurately reflect the biology and molecular characteristics of human tumors. Molecular profiles of eight pancreatic ductal adenocarcinoma patient tumors were compared to corresponding passages of xenografts obtained by grafting tumor fragments into immunocompromised mice. Molecular characterization was performed by copy number analysis, gene expression and microRNA microarrays, mutation analysis, short tandem repeat (STR) profiling, and immunohistochemistry. Xenografts were found to be highly representative of their respective tumors, with a high degree of genetic stability observed by STR profiling and mutation analysis. Copy number variation (CNV) profiles of early and late xenograft passages were similar, with recurrent losses on chromosomes 1p, 3p, 4q, 6, 8p, 9, 10, 11q, 12p, 15q, 17, 18, 20p, and 21 and gains on 1q, 5p, 8q, 11q, 12q, 13q, 19q, and 20q. Pearson correlations of gene expression profiles of tumors and xenograft passages were above 0.88 for all models. Gene expression patterns between early and late passage xenografts were highly stable for each individual model. Changes observed in xenograft passages largely corresponded to human stromal compartment genes and inflammatory processes. While some differences exist between the primary tumors and corresponding xenografts, the molecular profiles remain stable after extensive passaging. Evidence for stability in molecular characteristics after several rounds of passaging lends confidence to clinical relevance and allows for expansion of models to generate the requisite number of animals required for cohorts used in drug screening and development studies.
Introduction
Despite significant efforts, advanced pancreatic adenocarcinoma remains one of the most lethal cancers. According to the American Cancer Society 2013 Cancer Facts and Figures report, pancreatic cancer and liver cancer are the only cancers for which, in both men and women, incidence and death rates have been increasing between 2000 and 2009 [1]. Because early-stage pancreatic cancer is often asymptomatic, a high percentage of patients are not diagnosed until the disease has progressed to an advanced stage, making treatment of the disease highly challenging. Early metastases, difficult surgical approach/unresectable tumors, and poor response or resistance to current treatment modalities (gemcitabine and/or radiotherapy) contribute to a poor prognosis for patients with advanced disease [2]. Novel therapies are urgently needed to improve patient survival and prognosis over existing therapies.
Preclinical efficacy of novel agents observed in traditional cell line xenograft models has often not translated to clinical efficacy. The inability of conventional xenograft models to reliably predict clinical efficacy is one of the most frequently cited reasons for the high failure rate of novel anticancer therapies in oncology clinical trials [3–5]. Well-characterized cell lines used in xenograft models have adapted to extensive passaging on plastic outside of a natural tumor environment and lack the human extracellular matrix component that is critical for cancer cell-stromal cell interactions. Genetic divergence can occur between a primary tumor and a cell line derived from that tumor due to differences in selective pressures and genetic stress encountered in a tumor versus in vitro culture [6]. Models that more accurately reflect tumor heterogeneity and interaction with the tumor microenvironment to more accurately reflect tumor complexity and predict response to therapies in the clinic are needed. This has led to the development of models by directly engrafting cancer patient-derived tumor tissues into immunodeficient mice with the aim of retaining histopathologic features and molecular characteristics of the original tumor, as reviewed in [7]. A vital question relating to patient-derived tumor xenografts (PDTXs) is whether tumor characteristics are maintained during passaging. A limited number of studies have been performed to extensively compare cellular and molecular characterizations of primary tumors to their corresponding xenografts [6,8–17].
We report the establishment of a panel of pancreatic ductal adenocarcinoma PDTX models. We confirmed that the xenografts are representative of their corresponding original patient tumors and generated molecular profiles to aid in future preclinical evaluation of targeted oncology therapies. While previous studies have described the establishment and characterization of pancreatic cancer PDTX models, this is the first study that contains extensive molecular characterization to compare the genomic profiles of xenograft models to the original patient tumors they were derived from, as well as an examination of genomic stability of those models after extensive passaging. Expanded testing in multiple models can potentially provide important preclinical translational information to help guide clinical trial designs using a precision medicine approach.
Materials and Methods
Human Subjects
Tissue specimens were obtained from pancreatic cancer patient specimens with their informed consent. The tumor tissue used for xenograft development was deemed excess to that required for the patient's diagnosis and standard of care and treatment. All samples were anonymized and obtained in accordance with institutional review boards. Post-surgical pathology reports were provided for specimens from each patient.
Tissue Sampling
Clinical samples were collected immediately after surgery and transferred in culture medium on wet ice for engraftment within 24 hours after resection. Upon receipt of tumors, specimens were subdivided into three portions. One portion was snap frozen in liquid nitrogen and stored at -80°C for genomic analysis, the second was fixed in 10% neutral buffered formalin and paraffin embedded for histopathologic analysis, and the rest of the tumor was cut into pieces for engraftment in immunocompromised mice. Clinical data for the patient samples are provided in Table 1.
Table 1.
Patient-Derived Primary Tumors.
| Model | Age/Sex | Pathology | Stage/Grade |
| AG-Panc2 | 74/F | Invasive moderately to poorly differentiated ductal adenocarcinoma (5 cm), head of pancreas, invasive into duodenum, with local peripancreatic spread; metastatic carcinoma to two of five peripancreatic lymph nodes | pT3, pN1, pM1 |
| AG-Panc3 | 78/F | Invasive adenocarcinoma (4.5 cm), moderately differentiated of pancreatic origin; metastatic pancreatic adenocarcinoma involving at least two of peripancreatic lymph nodes with extension of tumor into perinodal soft tissues | pT3, pN1, pM1 |
| AG-Panc4 | 76/F | Moderately differentiated; tumor size of 3.5 cm; metastatic adenocarcinoma to four of nine peripancreatic lymph nodes | pT3, pN1, pM1 |
| AG-Panc5 | 74/F | Ductal adenocarcinoma (2.0 cm), moderately well differentiated; total of 10 benign peripancreatic lymph nodes showing no evidence of involvement by metastatic carcinoma | pT3, pN1, pM0 |
| AG-Panc6 | 72/F | Pancreatic ductal adenocarcinoma, metastatic moderately differentiated adenocarcinoma to right abdominal wall | pT3, pN1, pM1 |
| AG-Panc8 | 62/M | Moderately differentiated pancreatic adenocarcinoma in pancreatic head, greatest dimension: 1.9 cm, tumor invades duodenal wall | pT3, pN1, pMx |
| AG-Panc9 | 57/F | Poorly differentiated ductal adenocarcinoma of pancreas (pancreatic head) measuring 3.5 cm in greatest dimension, tumor infiltrates into peripancreatic fat and duodenal wall, 7 of 19 lymph nodes positive for metastatic carcinoma | pT3, pN1, pM1 |
| AG-Panc10 | 69/M | Poorly differentiated adenocarcinoma (6.5 cm) in pancreatic head, tumor extension invades peripancreatic soft tissue and duodenal wall, 5 of 10 lymph nodes positive for metastases | pT3, pN1, pM1 |
Histopathology
Histopathologic evaluation was performed on 5-µm hematoxylin and eosin (H&E)-stained sections of patient tumors and xenograft passages and examined under a light microscope. Tissue sections were reviewed by two independent pathologists to compare the pathologic features of the xenografts with those of the corresponding patient tumor.
Engraftment
Animals were kept in a specific pathogen-free environment, in positive pressure rooms with filtered and humidified air and maintained in accordance to the guidelines of the American Association of Laboratory Animal Care. Pancreatic ductal adenocarcinoma (PDA) tumor specimens from resected patients were reduced into small pieces (2-3 mm) and implanted subcutaneously in the flanks of imprinting control region-severe combined immunodeficient (ICR SCID) mice (Taconic, Germantown, NY) and propagated by serial transplantation. Dependent on tumor tissue availability, tumor fragments were implanted in a minimum of five mice (first generation). Five to 10 mice were monitored for health (body weight) and tumor growth. Mice were killed, and subcutaneous tumors were aseptically harvested when a volume of 1000 to 1500 mm3 was reached, following Institutional Animal Care and Use Committee guidelines. The tumors were subsequently divided into pieces for genomic characterization and histopathologic analysis as described above, as well as subsequent passaging in mice. Subsequent generations of mice were monitored for health and tumor growth characteristics as with the first-generation mice. Xenograft models that failed to develop within 6 months in the first generation mice were discontinued. PDTX models were considered fully established if the following criteria were met: 1) first-generation growth, 2) greater than 80% tumor take rate at third generation, with <12 weeks growth rate and stable growth kinetics, and 3) regrowth of the cryopreserved tumor fragment. Models were passaged beyond the third generation if necessary to reach stable growth kinetics. Human origin (%) of the tumors was confirmed at every passage as described below. For orthotopic models, tumor pieces were either surgically implanted into the pancreas or digested and injected into the pancreas as a cell suspension mix (50% vol/vol) with Cultrex. For the AG-Panc2 model, two separate studies were performed by orthotopic implantation of tumors from subcutaneous passages 10 and 39 from this established model. For AG-Panc10, the original patient tumor was implanted subcutaneously (p0) and then subsequently implanted both orthotopically and subcutaneously (p1). The p1 orthotopic tumor was harvested and subsequently passaged again orthotopically (p2). AG-Panc13 was similar to AG-Panc10 except that the original patient tumor was implanted in both subcutaneous and orthotopic location (p0) and subsequently passaged again orthotopically (p1).
Short Tandem Repeat (STR) Profiling
DNA typing by multiplex polymerase chain reaction (PCR) of short repetitive elements of highly polymorphic markers was performed to assess genetic stability of xenografts. STR profiling and analysis was performed using the AmpFISTR Identifiler PCR Amplification Kit (Applied Biosystems, Foster City, CA).
Mutation Analysis
cDNA synthesized using an oligo(dT) priming method was diluted 1:10 in ddH2O, and 2 µl was then used as a template in PCR. PCR was performed by double amplification method using primers binding outside of the protein coding region, with the exception of the CTNNB1 primers that targeted the frequent single nucleotide polymorphism (SNP) region. Gene-specific primers were designed in Primer3 (Supplementary Data section). PCR was performed in a mixture of 2 µl of diluted cDNA, 1x high-fidelity PCR buffer, 2 mM MgSO4, 0.2 mM dNTP, 0.4 µM forward and reverse primers, and 0.004 U Platinum Taq DNA Polymerase High Fidelity (Life Technologies, Carlsbad, CA) in a total volume of 50 µl with the following thermocycling parameters: 5 minutes at 94°C, repeated 20 seconds at 94°C, 20 seconds at 58°C, and 40 to 70 seconds at 68°C for 35 cycles. For the second round of PCR, 1 µl of the first round PCR product was amplified following the same conditions but with the number of cycles reduced to 30. PCR products were purified using Qiagen MinElute Gel Extraction Kit following the manufacturer's protocol. The purified PCR product was sequenced using ABI Prism 3730 DNA sequencer. The sequence traces were aligned and analyzed for SNPs using Vector NTI (Life Technologies).
Whole Exome Sequencing
Whole exome sequencing was performed by Ambry Genetics (Aliso Viejo, CA). Briefly, 100-bp paired-end libraries were prepared using the TruSeq DNA Sample Preparation protocol (Illumina, San Diego, CA) and exome enrichment by SeqCap EZ Exome Library v3.0 (NimbleGen, Madison, WI). The amplified capture DNA library size and concentration were determined using an Agilent Bioanalyzer. Sequencing of libraries was performed on a HiSeq2000 (Illumina) with libraries seeded onto a flow cell at 9 pM/lane. Initial data processing and base calling, including extraction of cluster intensities, was done using RTA 1.12.4 (HiSeq Control Software 1.4.5). Sequence quality filtering script was executed in the Illumina CASAVA software (v1.8.2; Illumina, Hayward, CA). For variant detection, the paired-end raw reads were aligned to the human reference genome Build 37 (or hg19) using the Illumina CASAVA 1.8.2 software on Linux clusters. A single BAM alignment file was saved and used in SoftGenetics NextGENe v2.2.1 for SNP and indel analysis.
Array Comparative Genomic Hybridization
Labeling, hybridization, and scanning. Genomic DNA (gDNA) was isolated from xenografts and primary tumors by DNeasy Blood and Tissue Kit (Qiagen, Valencia, CA) according to the manufacturer's instructions. gDNA was quantified on a NanoDrop ND-8000, and DNA integrity was verified on agarose gel. For xenograft specimens, the percentage of mouse and human component was determined by quantitative PCR (qPCR) measurement of β-actin using species-specific primers as previously described [18].
On the basis of our previous studies, we excluded samples with greater than 15% mouse component as candidates for hybridization to eliminate confounding analysis due to potentially extensive cross-hybridization of mouse gDNA. Cy5- and Cy3-labeled gDNA were prepared using Agilent Genomic DNA Enzymatic Labeling Kit according to the manufacturer's instructions. Specifically, 500 ng of non-amplified gDNA or 2 µg of GenomePlex Complete whole genome amplified gDNA (Sigma, St Louis, MO) was labeled with cyanine 5-deoxyuridine triphosphate (dUTP), and an equivalent amount of reference (gender-matched human normal female or male DNA; Promega, Madison, WI) was cyanine 3-dUTP labeled. Each labeled gDNA was purified using an Amicon 30-kDa filter (EMD Millipore, Billerica, MA) and quantified on a NanoDrop ND-8000 UV Spectrophotometer using Microarray/DNA-50 measurement. Specific activity of the dyes was calculated in picomoles per microgram in which the minimum threshold for cyanine 5 is 20 pmol/µg and the minimum for cyanine 3 is 25 pmol/µg. The purified labeled gDNA was co-hybridized to Agilent SurePrint G3 human CGH (2X400K) microarrays, placed in SureHyb hybridization chambers, and rotated at 20 rpm for 40 hours in a 65°C oven. After hybridization, microarray slides were disassembled, washed, dried with Stabilization and Drying Solution (Agilent Technologies, Santa Clara, CA), and covered with an Agilent Ozone-Barrier Cover. Slides were immediately scanned in an Agilent Microarray Scanner C using profile Agilent G3_CGH. Images were quantified using Feature Extraction Software v10.7 (Agilent Technologies).
Data analysis. Feature extraction files from the Agilent 2X400K aCGH platform were loaded into Partek Genomics Suite v6.6 software with recommended normalization settings. Each sample was compared to the pooled gender-matched reference sample to identify amplified and deleted regions using a genomic segmentation algorithm within Partek. Segmentation parameters used were given as follows: signal-to-noise ratio of 0.3, P value of .0001, and the minimum number of genomic markers set to five. Unsupervised hierarchical clustering and copy number variation (CNV) frequency plots were performed within Partek Genomics Suite.
Expression Microarray
Labeling, hybridization, and scanning. Total RNA from patient tumors and two corresponding xenograft passages for each model were used for expression profiling. Tumor and xenograft samples were normalized against total RNA from normal pancreas obtained from two separate sources (Agilent Technologies and Clontech, Mountain View, CA). Total RNA from xenografts was assessed for mouse and human components using species-specific primers for β-actin (Supplementary Data section) before labeling. Cyanine 3-CTP-labeled cRNA target was prepared using One-Color Low Input Quick Amp Kit and One-Color Spike-In Kit (Agilent Technologies) using 200 ng of input RNA [RNA integrity number (RIN) > 8.0] according to the manufacturer's protocols. Labeled cRNA was purified using RNeasy Mini Kit (Qiagen) according to the manufacturer's recommendation and was quantified on a NanoDrop ND-8000 UV Spectrophotometer using Microarray/RNA-40 measurement. Specific activity of cyanine 3 was calculated in picomoles per microgram with a minimum threshold of 15 pmol/µg. Labeled cRNA (600 ng) was fragmented by incubation with 5 µl of 10x blocking reagent and 1 µl of 25x fragmentation buffer in a 25-µl reaction volume for 30 minutes at 65°C. Twenty-five microliters of 2x GE Hybridization Buffer Hi-RPM was added to fragmented cRNA and hybridization mix and placed onto Agilent Human GE 8X60K v2 microarrays. Hybridization was carried out for 17 hours at 65°C by rotating at 10 rpm. Microarray slides were washed in GE Wash Buffer 1 for 2 minutes and pre-warmed GE Wash Buffer 2 for 2 minutes at room temperature. Microarray slides were scanned in an Agilent Scanner using profile AgilentHD_GX_1Color at Green PMT 100%. The scanned image was extracted to data using Agilent Feature Extraction Software v10.7.
Data analysis. Data analysis was performed, and gene lists were generated in Partek Genomics Suite v6.6 using the following parameters: third quantile normalization, analysis of variance P value < .05, and fold change ≥ 2.0. Probes with a signal lower than 50 in 100% of arrays were filtered out. Gene ontology analysis was performed to gene ontology sets of MSigDB v3.8, which had more than 50 genes in the gene set, applying Fisher exact test.
MicroRNA Microarray
Labeling, hybridization, and scanning. Total RNA was extracted using TRIzol and was cleaned up using miRNeasy Micro Kit (Qiagen) according to the manufacturer's protocol. RNA was analyzed on RNA-nano chip (Agilent Technologies). Samples with RIN < 7.0 were not used. Total RNA (100 ng) was labeled with cyanine 3-pCp using miRNA Complete Labeling Kit (Agilent Technologies) according to the manufacturer's protocol. Two normal pancreas samples were used for comparison (Clontech and Stratagene). Labeled RNA was hybridized to SurePrint G3 Human miRNA v16 (8X60K) microarrays (Agilent Technologies), placed in SureHyb hybridization chambers, and rotated at 20 rpm for 22 hours in a 55°C oven. After hybridization, microarrays were washed and immediately scanned in an Agilent Microarray Scanner C using profile Agilent G3_miRNA. Images were quantified using Feature Extraction Software v10.7 (Agilent Technologies).
Data analysis. Data analysis was performed, and gene lists were generated in Partek Genomics Suite v6.6 using the following parameters: no normalization, analysis of variance P value < .01, and fold change ≥ 2.0. Probes with a signal lower than 2 in 100% of arrays were filtered out.
qPCR Analysis
RNA expression. Primers used in qPCR are described in the Supplementary Data section. Reactions were performed in triplicate in a 5-µl reaction volume containing 0.5 µl of diluted cDNA based on normalization factor, SsoFast EvaGreen (Bio-Rad, Hercules, CA), and 400 µM of gene-specific forward and reverse primers. qPCR was carried out on a CFX384 Real-Time PCR machine (Bio-Rad) according to the following thermocycling parameters: 2 minutes at 95°C, repeated 5 seconds at 95°C and 5 seconds at 58°C (collected SYBR signal) for 40 cycles. Melting curves were generated from 65 to 95°C by collecting SYBR signal every 2°C for 3 seconds. Ct values and melting curves were determined in CFX Manager v1.5 (Bio-Rad). Relative gene expression was calculated by normalization to glyceraldehyde-3-phosphate dehydrogenase (GADPH) using the 2-ΔΔCt method [19].
CNV analysis. Human-specific qPCR copy number assays (qBiomarker Copy Number PCR Assays) were purchased from Qiagen. Normalization of input DNA used a human multicopy reference assay (Qiagen). Reactions were performed in triplicate in a 10-µl reaction volume containing 1x final volume of qBiomarker SYBR ROX FAST mastermix (Qiagen), 2 ng of gDNA, and 0.5 µl of qBiomarker copy number PCR assay (Qiagen). qPCR was carried out in a CFX Real-Time PCR machine (Bio-Rad) using the following thermocycling parameters: 10 minutes at 95°C, repeated 15 seconds at 95°C and 1 minute at 60°C (collected SYBR signal) for 40 cycles at a reduced ramp rate of 1°C/s. Melting curves were generated from 65 to 95°C by collecting SYBR signal every 2°C for 3 seconds. Ct values and melting curves were determined using CFX Manager software v2.1. Gene copy number was calculated using the calibrator genome method in which the calibrator was a normal pancreas sample and is assumed to have a normal diploid genome. The predicted gene of interest (GOI) copy number in a test sample is given by the following equation: 2 x 2-ΔCtGOI.
Results
Model Generation
A total of 12 primary tumors obtained from surgery were implanted subcutaneously into SCID mice as described in the Materials and Methods section. The histopathologic and clinical characteristics of the patient's primary tumors that successfully engrafted are displayed in Table 1. Histologically, all the tumors were pancreatic ductal adenocarcinomas, which were moderately to poorly differentiated. Metastases were detected in a majority of the patients, but only primary tumors were implanted in this study. Of the 12 patient tumors that were implanted, 8 were established as xenografts for an engraftment rate of 66.7%, which is consistent with a previous study using pancreatic tumors [10].
Growth rates to reach a tumor volume of 1000 mm3 ranged from 4 to 12 weeks, depending on the model and passage number. Xenografts have been propagated for a minimum of five passages, with some models having been extensively passaged (>30 passages). Histopathology comparisons between patient's primary tumors and xenograft passages were performed. Tissue sections stained for cytokeratin 18 and H&E showed that the respective models retained the original morphology of the human primary tumor (Figure 1). The relative state of differentiation is also retained upon passaging, including the retention of atypical glandular structures. As is typical of pancreatic adenocarcinoma tumors, a high degree of stroma is observed in the primary tumors. Human stroma is eventually replaced with murine stroma during successive passaging of the tumors within mice. A fair degree of stroma is retained throughout passaging but does appear to decrease somewhat in comparison to that observed in the primary tumors.
Figure 1.

Immunohistochemical analysis of original patient tumor and xenograft passages for two selected models. Tumor sections from two different patient tumors and corresponding xenograft passages were stained for H&E and cytokeratin 18.
STR Profiling
gDNA from primary tumors and at least one corresponding xenograft passage was isolated and analyzed for the presence of short tandem repeats at 16 different loci (Table W1). Complete concordance was observed for models AG-Panc2 though 6 at all 16 loci. AG-Panc9 showed minor differences in two loci, whereas AG-Panc8 and AG-Panc10 showed differences at four loci. Chromosomal loss or deletions within the Y chromosome was observed in AG-Panc8 xenografts but not in the original tumor by STR profiling; however, array comparative genomic hybridization (aCGH) profiling does show loss in the original tumor. The discrepancy may be explained in part by loss of stroma or enrichment of tumor during passaging. We have similar observations for other xenograft models across various cancer indications that we have developed. Loss of the Y chromosome has also been observed in a number of patient tumors in various cancer types [20–22]. Overall, genetic identity appears to have been highly preserved upon passaging.
SNP/Mutation Analysis
Tumors and matched xenograft passages were analyzed for mutations/SNPs by Sanger sequencing in a small panel of genes known to be frequently mutated in pancreatic cancer according to the COSMIC database (KRAS, CTNNB1, TP53, and SMAD4). Results of mutational analysis are shown in Table 2A. Mutations in KRAS were observed at codon 12 (G12D/R/V) for all samples except AG-Panc5. No KRAS codon 13 variants were identified. Mixtures of wild-type and mutant sequences suggest heterogeneity within the tumors. Mutations seen in the original tumor were conserved in subsequent passages, with the exception of AG-Panc4. It is possible that the mutation was present but below the level of detection by Sanger sequencing. The P72R variant of TP53 was observed in most models, while the R175H mutation was seen in only AG-Panc4, and H179R variants were observed in AG-Panc6 and 8. Some SNPs were identified in SMAD4, but no well-known mutations were identified in either SMAD4 or CTNNB1 in any of the models. Overall, the data suggest a high degree of genetic stability even after 39 passages. From this small panel of genes, we did not observe evidence for the generation of additional mutations upon subsequent passaging. Mutations seen in early passages were maintained and no new mutations were identified. Analysis performed on a larger panel of genes using qPCR-based assays for specific SNPs yielded similar results.
Table 2.
Variant Analysis of Patient Tumors and Xenografts.
| (A) Cancer Gene Sequence Analysis | |||||||||
| Model | Passage | KRAS | TP53 | SMAD4 | CTNNB1 | KIT | ATM | APC | Detection Method |
| AG-Panc2 | T | WT\G12V | WT\P72R | WT | WT | ND | Sanger | ||
| AG-Panc2 | P1 | G12V | P72R | R135G | WT | WT | Sanger, qPCR | ||
| AG-Panc2 | P39 | G12V | P72R | R135G | WT | WT | Sanger, qPCR, WES | ||
| AG-Panc3 | T | WT\G12D | P72R | WT | WT | ND | Sanger | ||
| AG-Panc3 | P0 | WT\G12D | P72R | WT | WT | M541L | Sanger, qPCR | ||
| AG-Panc3 | P34 | WT\G12D | P72R | WT | WT | M541L | E1317Q | Sanger, qPCR, WES | |
| AG-Panc4 | T | WT | P72R, WT/R175H | WT | WT | ND | Sanger | ||
| AG-Panc4 | P0 | WT\G12R | P72R, WT/R175H | WT | WT | WT | Sanger, qPCR | ||
| AG-Panc4 | P22 | WT\G12R | P72R, R175H | WT | WT | WT | Sanger, qPCR, WES | ||
| AG-Panc5 | T | WT | WT | WT | WT | ND | Sanger | ||
| AG-Panc5 | P1 | WT | WT | WT | WT | WT | Sanger, qPCR | ||
| AG-Panc5 | P16 | WT | WT | WT | WT | WT | Sanger, qPCR, WES | ||
| AG-Panc6 | T | WT\G12R | P72R, WT/H179R | WT | WT | M541L | Sanger, qPCR, WES | ||
| AG-Panc6 | P1 | WT\G12R | P72R, H179R | WT | WT | ND | Sanger | ||
| AG-Panc6 | P7 | WT\G12R | P72R, H179R | WT | WT | ND | Sanger | ||
| AG-Panc8 | T | WT\G12D | P72R, WT/H179R | WT | WT | WT | A1309T | Sanger, qPCR, WES | |
| AG-Panc8 | P1 | WT\G12D | P72R, H179R | R135*/WT | WT | ND | Sanger | ||
| AG-Panc8 | P5 | WT\G12D | P72R, H179R | R135* | WT | ND | Sanger | ||
| AG-Panc9 | T | WT\G12V | P72R | WT | WT | WT | Sanger, qPCR, WES | ||
| AG-Panc9 | P2 | WT\G12V | P72R | Q169* | WT | ND | Sanger | ||
| AG-Panc9 | P4 | WT\G12V | P72R | Q169* | WT | ND | Sanger | ||
| AG-Panc10 | T | WT\G12R | WT | WT | WT | WT | Sanger, qPCR, WES | ||
| AG-Panc10 | P4 | WT\G12R | WT | WT | WT | ND | Sanger | ||
| (B) ADME Core Gene Panel Variants Detected by WES | |||||||||
| Gene | Variant | AG-Panc2 | AG-Panc3 | AG-Panc4 | AG-Panc5 | AG-Panc6 | AG-Panc8 | AG-Panc9 | AG-Panc10 |
| ABCC2 | rs717620 | X | |||||||
| V417I | X | X | X | ||||||
| CYP1A1 | I462V | X | |||||||
| CYP1A2 | rs762551 | X | X | X | X | X | |||
| ABCG2 | Q141K | X | |||||||
| CYP2B6 | R22C | X | |||||||
| Q172H | X | X | X | X | |||||
| CYP2C8 | K399R | X | |||||||
| CYP2C9 | R144C | X | |||||||
| I359L | X | X | |||||||
| CYP3A4 | rs2242480 | X | X | ||||||
| GSTP1 | I105V | X | X | X | X | X | X | ||
| A114 | X | X | X | ||||||
| NAT1 | V149I | X | |||||||
| S214A | X | ||||||||
| NAT2 | I114T | X | X | X | |||||
| R197Q | X | X | X | ||||||
| SLC15A2 | L350F | X | X | X | X | ||||
| P409S | X | X | X | X | |||||
| R509K | X | X | X | X | |||||
| SLC22A1 | M408V | X | X | X | X | X | X | X | |
| M420del | X | X | X | ||||||
| SLC22A2 | S270A | X | X | X | X | X | X | X | |
| SLCO1B1 | N130D | X | X | X | |||||
| V174A | X | ||||||||
| SLCO1B3 | S112A | X | X | X | X | X | X | ||
| M233I | X | X | X | X | X | X | X | X | |
| SULT1A1 | R213H | X | X | X | X | ||||
| V223M | X | X | X | X | X | X | X | X | |
| TPMT | A154T | X | |||||||
| Y240C | X | ||||||||
T, original patient tumor; WT, wild type; ND, not determined, sample not analyzed; WES, whole exome sequencing.
Stop codon.
We analyzed whole exome sequencing data on these models to identify cancer gene mutations contained within one or more next-generation sequencing (NGS) cancer gene sequencing panels from various vendors or in the Federal Drug Administration absorption, distribution, metabolism, excretion (ADME) core gene panel to identify mutations in genes involved in drug metabolism and transport. Mutations identified among the models included M541L mutations in v-kit Hardy-Zuckerman 4 feline sarcoma viral oncogene (KIT) for AG-Panc3 and 6, A1309T mutation in ataxia telangiectasia mutated transcript (ATM) for AG-Panc8, and E1317Q mutation in adenomatous polyposis coli (APC) for AG-Panc3. Additional variants were found within ADME genes involved in functions such as transport, P450 enzymes, and xenobiotic metabolism (Table 2B).
Copy Number Variation Analysis
High-density 400K oligonucleotide arrays were used to investigate chromosomal aberrations within tumor samples. All tumors were normalized to sex-matched human reference gDNA. Heat maps of the genome-wide aCGH profiles demonstrated that AG-Panc2, 3, 4, and 10 showed more extensive chromosomal abnormalities and intense CNV changes at specific loci (Figure 2A). Available clinical annotation did not explain this pattern as majority of the samples are fairly similar in terms of histopathology and tumor/stage grading. It is interesting to note that these four models have faster growth rates than the other models (data not shown). Similar to previously published pancreatic cancer studies, recurrent chromosomal abnormalities included losses on chromosomes 1p, 3p, 4q, 6, 8p, 9, 10, 11q, 12p, 15q, 17, 18, 20p, and 21 and gains on 1q, 5p, 8q, 11q, 12q, 13q, 19q, and 20q (Figure 2B) [23–26].
Figure 2.

Copy number variation analysis performed by aCGH. (A) Heat map and clustering analysis of original tumor samples. (B) Karyogram of frequency of chromosomal aberrations. (C) Heat map of copy number variation in tumor xenograft passages. Red, amplifications (gains); blue, deletions (losses).
We were unable to do a comparative analysis of the original tumors versus xenograft passages due to limiting amounts of patient tumor tissue and technical limitations. We have determined that mouse gDNA can cross-hybridize to the human aCGH arrays due to extensive sequence homology between the two species (Figure W1). As a result, xenograft tumors with greater than 15% mouse component were not run on aCGH arrays to avoid confounding signals. As such, observed differences can either be real changes (clonal enrichment or de novo acquisition) or changes attributed to technical source of variation including species cross-hybridization, differences in dilution by stromal component, or sampling effects. In patient tumors, copy number variations in tumor cells can be masked by normal or heterogeneous cell populations within the sample. In xenografted tumors, the same is true, with the additional complication of replacement of human stroma with mouse stroma. Loss of human signal and potential contributions of mouse signal due to cross-hybridization can confound the actual copy number ratio observed. Application of laser capture microdissection on sections of the original patient tumor and subsequent xenograft passages to specifically isolate tumor cells is one possible approach for addressing this issue, though this is also subject to a sampling effect. Unfortunately, original patient tissue was limiting and was not in sufficient size to be processed by laser capture microdissection for the majority of the pancreatic tumors. Alternatively, future studies employing DNA content-based flow sorting by ploidy may allow for enrichment of distinct clonal populations or enrichment of tumor cells within xenograft passages, thereby addressing potential issues related to sampling bias or isolation based on morphology alone.
CNV stability was studied across xenograft passages by aCGH. Two late passages each of AG-Panc2, 3, and 4 were screened. All samples were confirmed to contain less than 15% mouse component. Heat maps of the aCGH profiles show nearly identical profiles, suggesting a very high degree of stability during passaging (Figure 2C). Likewise, qPCR-based copy number analysis of a small selected panel of genes was carried out using human-specific qPCR probes. SMAD4, MYC, and CDKN2A showed high degree of stability during passaging, with most of the models harboring SMAD4 and CDKN2A deletions (Figure 3). SMAD4 mutant pancreatic adenocarcinomas have been previously found to have higher metastatic potential, and the gene was found to be more frequently deleted in pancreatic tumors that successfully engrafted compared to those that did not engraft [10,27]. MYC amplification, which is commonly observed in pancreatic cancer, was observed in three of the models. Mouse gDNA was not detected by any of the assays, demonstrating species specificity.
Figure 3.

CNV analysis of SMAD4, MYC, and CDKN2A in xenograft passages measured by qPCR. Two different passages for each model were measured for copy number and normalized to either a pooled normal reference gDNA sample or normal pancreas gDNA. Gray, normal copynumber; blue, deletion/loss; red, amplification/gain.
Expression Profiling
Gene expression analysis was carried out on the original patient tumors and two passages of each of the models (early and late) to assess the potential for genomic drift over time in vivo. Unsupervised hierarchical clustering analysis showed that all of the patient tumors cluster together and the xenografted tumors are contained within the second cluster (Figure 4, A and B). Microarray profiling was not performed on AG-Panc3 due to poor RNA quality. The two passages from each xenograft model cluster together, demonstrating that passages within models are highly similar. While the clustering analysis of samples on a subset of genes suggests differences between original tumors and their respective xenograft passages, Pearson correlation analysis of genome-wide expression shows very high similarity. All passages compared to their respective original patient tumor had correlations of 0.88 and above (Figure W2). Calculation of significant gene lists [fold-change (FC) ≥ 2.0 and false discovery rate (FDR) < 0.05] for each model demonstrated that the patient tumors shared 69% to 77% of significantly regulated genes with both xenograft passages (Figures W2–W3). In addition, we compared the gene expression profiles of tumors passaged in a subcutaneous or orthotopic location by whole genome microarray for three separate models (Figure 5). The expression profiles between orthotopic and subcutaneous tumors were nearly identical in each of the three models. In comparing the overlap of significant gene lists, AG-Panc2 p6 had 61% to 63% overlap with its corresponding orthotopic tumors, AG-Panc10 p4 had 71% overlap, and AG-Panc13 p0 had 79% overlap with its corresponding p0 orthotopic tumor (Figures W2–W3). Pearson correlation analysis to compare overall genomic expression profiles did not reveal any notable differences (Figure W2). AG-Panc2 subcutaneous passages p6 and p17 had Pearson correlations ranging from 0.92 to 0.96 with the orthotopic tumors, AG-Panc10 p4 had correlations of 0.97 to 0.98, and AG-Panc13 p0 subcutaneous tumor had correlations of 0.97 and 0.98 with the p0 and p1 orthotopic passages of the same tumor.
Figure 4.

Comparison of gene expression profiles between original patient tumors and xenograft passages. (A) Unsupervised hierarchical clustering of tumor and xenograft passages. (B) Heat map of gene expression profiles (5915 probes) of original patient tumors and early and late xenograft passages.
Figure 5.

Comparison of gene expression profiles between original patient tumors, subcutaneous xenografts, and orthotopic xenografts is shown. Unsupervised hierarchical clustering and heat maps of tumor and subcutaneous/orthotopic xenograft gene expression profiles are also shown.
Differences observed are likely due to changes in tumor microenvironment resulting from engraftment in immunocompromised mice. Evidence for this was observed upon examining both a pancreatic cancer stromal gene set [28,29] and a lymphocyte gene signature [30]. When comparing the original tumors to their xenograft passages, a large percentage of the genes are upregulated in patient tumors compared to normal pancreas, whereas expression is decreased in corresponding xenograft passages (Figure 6). We also examined the presence of a metastasis-associated gene signature [31] that contains 17 genes identified by comparing adenocarcinoma metastases from multiple tumor types to unmatched primary adenocarcinomas. In this analysis, we used the gene expression profiles from eight primary tumors and two different passages of their matching xenografts. Five of eight genes were also upregulated in xenografts compared to counterpart primary tumors, and six of nine genes were downregulated in a majority of the models. This is consistent with similar observations by Garrido-Laguna et al. [10] of the presence of a metastatic gene signature that may contribute to establishment of patient-derived pancreatic adenocarcinoma xenograft models. Gene ontology analysis was also performed to identify functional processes altered in xenografts (Table W2). Functional categories of note for downregulated genes in xenografts included many immunologic categories (immune response, inflammatory response, regulation of immune response, and defense response). Upregulated genes in xenografts included functional groups related to growth and proliferation (mitotic cell cycle, cell division, cell cycle, G1/S transition, and cell proliferation). Our results strongly suggest that differences in gene expression are largely attributed to loss of human stromal component, loss of tumor-infiltrating lymphocytes, and decreased inflammatory/immune components within the tumor microenvironment as a result of engraftment and less dependent on the location of tumor implantation.
Figure 6.
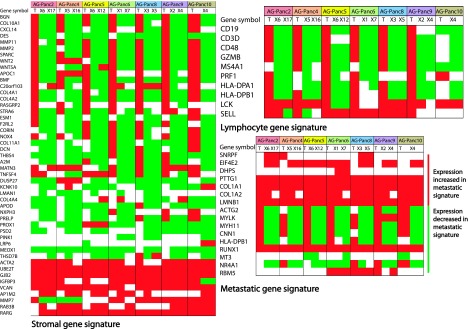
Gene signature panel comparisons between primary tumors and xenograft passages. Comparison of primary tumor (T) versus xenograft passages (X) shows down-regulation in xenografts of several genes in both a stromal signature and a lymphocyte signature. Comparison across a metastatic adenocarcinoma signature demonstrated that xenografts were enriched in the metastatic gene signature.
MicroRNA Profiling
Profiling of microRNA expression was performed on original patient tumors. Due to high homology of many mouse microRNA sequences, we did not profile xenografted tumors. MicroRNAs with significantly differential expression in pancreatic tumors versus an average of two normal pancreas samples were identified (Table W3). While our sample set of normal and tumor samples is small, we found a number of microRNAs to be differentially expressed in pancreatic adenocarcinoma, with up-regulation of miR-10a, 10b, 21, 23a, 23b, 100, 103, 107, 125a, 125b, 143, 146, 155, 181b, 199a, 221, and 223 and down-regulation of miR-148a. We observed very few miRNAs that were downregulated in pancreatic cancer. These results are consistent with previously published studies [32–38].
Discussion
As individualized targeted therapy approaches have become more common in cancer drug development, models that reflect patient heterogeneity and more faithfully recapitulate in vivo tumor biology are essential to improving prediction of clinical efficacy of novel therapies. The advantages of PDTX models over cell line xenograft models are many; however, many questions regarding the potential for histologic, stromal, or genetic drift of xenografts from the primary tumor have been raised. While methods for establishing PDTX models have been in place for several decades, only within the last couple of years have there been studies describing extensive characterization of such models, made possible by high-throughput genomic technologies. We have established a number of PDTX models across a number of cancer indications for the purposes of preclinical drug evaluation in models that more accurately reflect tumor biology and heterogeneity. In the present study, we report a detailed molecular characterization of a panel of eight pancreatic adenocarcinoma PDTX models developed in our laboratory. To determine how histologically representative and molecularly relevant the xenograft models are, we compared a number of histologic and genomic/genetic features to the corresponding original patient tumors.
Morphologically, the xenografts resemble the primary tumors. As has been described previously, tumor architecture and stromal content is still present [10,15,17]. Although we have not evaluated this extensively, the desmoplastic reaction seems less pronounced in xenografts than in patient tumors. However, we have observed fluctuations in the degree of stromal content, as well as overall mouse/human content, from passage to passage. Future studies are needed to evaluate this more extensively and to determine how differences in the degree of stroma or desmoplastic reaction in xenografts compared to that observed in the clinical setting can potentially impact drug efficacy evaluations. Of importance to note, tumor morphology in PDTX models is more accurately recapitulated than in xenografts generated by injection of cancer cell lines.
We did not observe the presence of metastases with the PDTX models described in this study since they were passaged subcutaneously. We did observe that all eight models that were successfully established had SMAD4 deletions and that the xenograft passages had a similar metastasis-associated gene signature seen in a previous study [10]. Previous publications have demonstrated metastases in pancreatic adenocarcinoma PDTX models passaged orthotopically [15,39]. While orthotopic growth is advantageous in that it more closely resembles in vivo conditions, routine establishment of such models is more labor intensive and technically challenging. However, we appreciate that a combination of different types of models (subcutaneous, orthotopic, genetically modified mouse models) may be needed to adequately address specific biologic questions that may arise in the course of evaluating the preclinical efficacy of novel therapies to increase the level of confidence that observed efficacy in preclinical models will translate to clinical efficacy. We examined the ability to take tumors established in a subcutaneous manner and then subsequently grown orthotopically when the need arises. Upon resection, the pathology reports for all three patient tumors indicated localized metastatic invasion to structures such as the lymph nodes, duodenum, and abdominal wall. Dissemination patterns observed when tumors were grown orthotopically were consistent with this pattern, with no metastases found in the lung.
Genome-wide examination of genomic stability and RNA expression levels confirmed that xenografts were highly stable during passaging, with the greatest differences observed between the primary tumor and xenograft. In our aCGH analysis, differences in CNV profiles between primary tumors and xenograft passages were present in the limited number of models examined. The potential for cross-hybridization of mouse gDNA on our platform and other technical factors such as sampling effects confound the ability to determine whether the differences observed are due to technical factors or true biologic differences. Reports in the literature are mixed, with similar CNV profiles observed in some xenografts and marked differences in others. Using a bacterial artificial chromosome (BAC) aCGH platform, Reyal et al. [16] reported CNV Pearson correlations of breast tumor/xenograft pairs ranging from 0.23 to 0.87 with 14 of 18 models above 0.50. In a separate study on breast cancer PDTX models using the Affymetrix SNP 6.0 platform, a higher degree of correlation was observed [9]. However, within individual models there were loci observed with a greater concordance among xenograft passages than between passaged and fresh specimens. The degree of similarity observed may be tumor type-dependent and reflective of differences in tumor biology, stromal involvement, and role of tumor microenvironment in different cancers. Alternatively, differences may be a reflection of expansion of subclonal populations within the original tumor due to selective pressures.
In a panel of colon xenograft models, clustering separated tumors from xenografts, but no major differences between early and late passages were observed [11]. In pancreatic cancer PDTX models, Monsma et al. [14] observed Pearson correlations of 0.92 between xenograft and patient tumors and 0.97 for melanoma models, suggesting that differences may be dependent on tumor type. Correlations among different xenograft passages within any particular model ranged from 0.98 to 0.99 across a wide range of tumor types, with the largest differences seen between patient tumors to first generation. Expression profiles between orthotopic and subcutaneous tumors were nearly identical in each of the three models. While overall gene expression profiles were not altered in relation to the site of tumor growth, we recognize that metastatic potential, interaction with the microenvironment, drug accessibility, and tumor vasculature are different in tumors grown orthotopically compared to a subcutaneous environment. Further studies would be needed to address establishment rates between subcutaneous and orthotopic growth. Nonetheless, our results indicate that switching from subcutaneous growth to orthotopic growth allows for testing in a more clinically relevant model with negligible impacts on the global expression profiles and that the majority of differences appear to be related to growth in an immunocompromised murine host rather than the site of tumor implantation. Overall, the results of our study and existing reports demonstrate that the majority of the genomic profile of the original tumor is conserved upon passaging. This in combination with the absence of genetic drift and preservation of histologic integrity after several generations supports confidence in the clinical relevance of PDTX models.
Gene ontology (GO) analysis to examine phenotypic changes observed in xenografts yielded similar results to previous studies. Enrichment for downregulated genes involved in immune response, extracellular matrix (ECM), and stroma-related genes has been observed in breast cancer xenografts [8], colon [11], and across a panel of multiple tumor types [14]. Such results are not unexpected and are reflective of a combination of decrease of stromal content, replacement of human stroma with murine stroma, down-regulation of immune responses to enable engraftment and growth in an immunocompromised host, and loss of human infiltrating immune cells after transplantation. Upregulated genes in xenografts were enriched in processes related to cellular growth and proliferation. Similar enrichment in canonical pathways driving tumorigenesis has been observed [14]. The observed decreases in immune response coupled with a metastasis-associated gene signature and up-regulation in proliferative processes support establishment and maintenance of xenograft in the immunocompromised host.
Current personalized medicine approaches have been incorporating next-generation sequencing technologies for genomic profiling of patient tumors to identify potential therapeutic targets. Sufficient amounts of gDNA or RNA from the original patient tumors was limited or not available for some of the models in this study, allowing for only a comparative analysis between the original tumors and subsequent xenografts on a selected subset of genes by Sanger sequencing. However, qPCR-based SNP assays and whole exome sequencing was performed on at least one passage for each model to aid in initial model selection or to provide information for translational studies in regard to explaining drug sensitivity/resistance. Liang et al. [40] recently described genome-wide characterization of three pancreatic adenocarcinoma patient tumors using whole genome sequencing and RNA-Seq. The combination of our gene expression profiling, CNV analysis, and mutational analysis/whole exome sequencing yielded similar aberrations in the KRAS pathway and gene alterations commonly observed in pancreatic adenocarcinoma: frequent mutations in KRAS; common SMAD4 and CDKN2A deletions; mutations in TP53, KIT, and ATM; amplification of MYC; and up-regulation of genes involved in cell cycling and cell division. In addition, we identified a number of ADME gene variants of interest within our models that may influence drug resistance, efficacy, or toxicity or have been found to be potential risk factors for various cancers. In a study of patients with small cell lung cancer, SNP rs717620 in ABCC2 was moderately associated with poor response to chemotherapy but strongly associated with progression-free survival and overall survival [41]. Patients with non-small cell lung cancer (NSCLC) with the Q141K variant in ABCG2 treated with gefitinib had a four to five times higher risk of diarrhea [42]. This variant was also found to be associated with longer progression-free survival (PFS) in epithelial ovarian/primary peritoneal cancer following platinum + taxane-based chemotherapy [43]. ABCG2 was also found to be involved in erlotinib transport, although it is unknown if this particular variant impacts that function [44]. The P450 enzymes CYP2C8 and CYP2C9 have well-known involvement in warfarin and non-steroidal anti-inflammatory drug (NSAID) metabolism and are also involved in paclitaxel metabolism. In a recent study, the K399R variant in CYP2C8 was found to be associated with an increased risk of paclitaxel-induced neuropathy in patients with breast cancer [45]. SLCO1B1/OATP1B1 regulates the uptake of numerous drugs including statins and methotrexate. The V174A variant in SLCO1B1 was found to cause higher plasma concentrations of SN-38, the active metabolite of irinotecan, in patients with NSCLC, and a higher frequency of grade 4 neutropenia [46]. The I105V variant in GSTP1 was associated with a higher doxorubicin response in patients with breast cancer [47], whereas the M420del in SLC22A2 SNP was found to impair imatinib uptake and may modify clinical outcome in patients with chronic myelogenous leukemia (CML) treated with imatinib [48]. With the aid of sequence analysis, we identified specific oncogenic mutations that may be driving the biology of the individual tumor models; however we have also identified mutations/SNPs in genes involved in drug metabolism and transport that may equally be as important in determining the sensitivity, resistance, or toxicity of a novel therapeutic.
Novel effective treatment options remain a critical challenge in pancreatic cancer. This highly drug-resistant malignancy would benefit from predictive markers to define tailored treatment regimens and response prediction for individualized therapy according to the molecular profile of individual tumors. Recent studies have applied DNA content-based flow sorting to isolate clonal populations based on ploidy to isolate tumor cells from normal cells and enrich for multiple distinct tumor cell populations [49–51], allowing for a better understanding of the clonal evolution of pancreatic cancer and other solid tumors in response to therapies. These studies have demonstrated that distinct clonal populations of cells within a tumor may not contain a given therapeutic target of interest or be selected for during the evolution of resistance to targeted therapies. Alternatively, clonal populations may contain alterations in genes involved in drug metabolism and transport that may also impact drug efficacy. Future application of such techniques in conjunction with PDTX models would enhance preclinical drug evaluation through a better ability to determine the clinical context of each model and identification of aberrations that may either influence sensitivity/resistance or arise in response to therapy.
Currently, there is a lack of consensus in the field regarding the extent of passaging optimal for usage of PDTX models in drug evaluation. Concern for minimizing the potential for genetic drift has resulted in a common practice of restricting to 10 or fewer passages. Conservative approaches that stop further propagation after determination of successful engraftment may result in as few as two to three passages. While this minimizes potential for genetic drift, it becomes a finite resource due to the limited number of mice that can be implanted within two rounds of passaging. More extensive passaging allows for larger frozen stocks that are amenable to larger studies or repeated studies at the same passage number that would be required in industry-scale preclinical drug evaluation. Depending on the model, it may take several rounds of passaging to either achieve a more stable growth rate or one that is more amenable to drug screening. The largest source of variation from the primary tumor occurs within the initial passage as a result of engraftment. On the basis of the high degree of stability observed after successful engraftment and successive passaging, use of extensively passaged PDTX models appears justified. A thorough molecular understanding of PDTX models, at any passage number, is warranted to guarantee clinical relevance and ascertain the degree to which there are any dissimilarities to the patient tumors from which they were derived and any impact that may have on the particular drug being evaluated.
In summary, we have developed preclinical cancer models of pancreatic adenocarcinoma using patient-derived tumors. Established models were histologically representative and highly stable genomically, even after extensive passaging. Differences in gene expression profiles were indicative of changes in tumor microenvironment and immune-related parameters associated with growth in an immunocompromised host. Our analysis supports the use of patient-derived xenografts as preclinical models for evaluating drug response, mechanism of action, as well as biomarker identification and validation.
Supplementary Material
Footnotes
The authors disclose no potential conflicts of interest.
This article refers to supplementary materials, which are designated by Tables W1 to W3 and Figures W1 to W3 and are available online at www.neoplasia.com.
References
- 1.American Cancer Society, author. American Cancer Society Facts and Figures 2013. Atlanta, GA: American Cancer Society; 2013. [Google Scholar]
- 2.Kindler HL. Pancreatic cancer: an update. Curr Oncol Rep. 2007;9:170–176. doi: 10.1007/s11912-007-0018-z. [DOI] [PubMed] [Google Scholar]
- 3.Ellis LM, Fidler IJ. Finding the tumor copycat. Therapy fails, patients don't. Nat Med. 2010;16:974–975. doi: 10.1038/nm0910-974. [DOI] [PubMed] [Google Scholar]
- 4.Johnson JI, Decker S, Zaharevitz D, Rubinstein LV, Venditti JM, Schepartz S, Kalyandrug S, Christian M, Arbuck S, Hollingshead M, et al. Relationships between drug activity in NCI preclinical in vitro and in vivo models and early clinical trials. Br J Cancer. 2001;84:1424–1431. doi: 10.1054/bjoc.2001.1796. [DOI] [PMC free article] [PubMed] [Google Scholar]
- 5.Voskoglou-Nomikos T, Pater JL, Seymour L. Clinical predictive value of the in vitro cell line, human xenograft, and mouse allograft preclinical cancer models. Clin Cancer Res. 2003;9:4227–4239. [PubMed] [Google Scholar]
- 6.Daniel VC, Marchionni L, Hierman JS, Rhodes JT, Devereux WL, Rudin CM, Yung R, Parmigiani G, Dorsch M, Peacock CD, et al. A primary xenograft model of small-cell lung cancer reveals irreversible changes in gene expression imposed by culture in vitro. Cancer Res. 2009;69:3364–3373. doi: 10.1158/0008-5472.CAN-08-4210. [DOI] [PMC free article] [PubMed] [Google Scholar]
- 7.Tentler JJ, Tan AC, Weekes CD, Jimeno A, Leong S, Pitts TM, Arcaroli JJ, Messersmith WA, Eckhardt SG. Patient-derived tumour xenografts as models for oncology drug development. Nat Rev Clin Oncol. 2012;9:338–350. doi: 10.1038/nrclinonc.2012.61. [DOI] [PMC free article] [PubMed] [Google Scholar]
- 8.Bergamaschi A, Hjortland GO, Triulzi T, Sørlie T, Johnsen H, Ree AH, Russnes HG, Tronnes S, Maelandsmo GM, Fodstad O, et al. Molecular profiling and characterization of luminal-like and basal-like in vivo breast cancer xenograft models. Mol Oncol. 2009;3:469–482. doi: 10.1016/j.molonc.2009.07.003. [DOI] [PMC free article] [PubMed] [Google Scholar]
- 9.Bertotti A, Migliardi G, Galimi F, Sassi F, Torti D, Isella C, Corà D, Di Nicolantonio F, Buscarino M, Petti C, et al. A molecularly annotated platform of patient-derived xenografts (“xenopatients“) identifies HER2 as an effective therapeutic target in cetuximab-resistant colorectal cancer. Cancer Discov. 2011;1:508–523. doi: 10.1158/2159-8290.CD-11-0109. [DOI] [PubMed] [Google Scholar]
- 10.Garrido-Laguna I, Uson M, Rajeshkumar NV, Tan AC, de Oliveira E, Karikari C, Villaroel MC, Salomon A, Taylor G, Sharma R, et al. Tumor engraftment in nude mice and enrichment in stroma-related gene pathways predict poor survival and resistance to gemcitabine in patients with pancreatic cancer. Clin Cancer Res. 2011;17:5793–5800. doi: 10.1158/1078-0432.CCR-11-0341. [DOI] [PMC free article] [PubMed] [Google Scholar]
- 11.Julien S, Merino-Trigo A, Lacroix L, Pocard M, Goéré D, Mariani P, Landron S, Bigot L, Nemati F, Cuilliere-Dartigues P, et al. Characterization of a large panel of patient-derived tumor xenografts representing the clinical heterogeneity of human colorectal cancer. Clin Cancer Res. 2012;18:5314–5328. doi: 10.1158/1078-0432.CCR-12-0372. [DOI] [PubMed] [Google Scholar]
- 12.Kabos P, Finlay-Schultz J, Li C, Kline E, Finlayson C, Wisell J, Manuel CA, Edgerton SM, Harrell JC, Elias A, et al. Patient-derived luminal breast cancer xenografts retain hormone receptor heterogeneity and help define unique estrogen-dependent gene signatures. Breast Cancer Res Treat. 2012;135:415–432. doi: 10.1007/s10549-012-2164-8. [DOI] [PMC free article] [PubMed] [Google Scholar]
- 13.Mischek D, Steinborn R, Petznek H, Bichler C, Zatloukal K, Stürzl M, Günzburg WH, Hohenadl C. Molecularly characterised xenograft tumour mouse models: valuable tools for evaluation of new therapeutic strategies for secondary liver cancers. J Biomed Biotechnol. 2009;2009:437284. doi: 10.1155/2009/437284. [DOI] [PMC free article] [PubMed] [Google Scholar]
- 14.Monsma DJ, Monks NR, Cherba DM, Dylewski D, Eugster E, Jahn H, Srikanth S, Scott SB, Richardson PJ, Everts RE, et al. Genomic characterization of explant tumorgraft models derived from fresh patient tumor tissue. J Transl Med. 2012;10:125. doi: 10.1186/1479-5876-10-125. [DOI] [PMC free article] [PubMed] [Google Scholar]
- 15.Pérez-Torras S, Vidal-Pla A, Miquel R, Almendro V, Fernández-Cruz L, Navarro S, Maurel J, Carbó N, Gascón P, Mazo A. Characterization of human pancreatic orthotopic tumor xenografts suitable for drug screening. Cell Oncol (Dordr) 2011).;34:511–521. doi: 10.1007/s13402-011-0049-1. [DOI] [PubMed] [Google Scholar]
- 16.Reyal F, Guyader C, Decraene C, Lucchesi C, Auger N, Assayag F, De Plater L, Gentien D, Poupon MF, Cottu P, et al. Molecular profiling of patient-derived breast cancer xenografts. Breast Cancer Res. 2012;14:R11. doi: 10.1186/bcr3095. [DOI] [PMC free article] [PubMed] [Google Scholar]
- 17.Rubio-Viqueira B, Jimeno A, Cusatis G, Zhang X, Iacobuzio-Donahue C, Karikari C, Shi C, Danenberg K, Danenberg PV, Kuramochi H, et al. An in vivo platform for translational drug development in pancreatic cancer. Clin Cancer Res. 2006;12:4652–4661. doi: 10.1158/1078-0432.CCR-06-0113. [DOI] [PubMed] [Google Scholar]
- 18.Thierry AR, Mouliere F, Gongora C, Ollier J, Robert B, Ychou M, Del Rio M, Molina F. Origin and quantification of circulating DNA in mice with human colorectal cancer xenografts. Nucleic Acids Res. 2010;38:6159–6175. doi: 10.1093/nar/gkq421. [DOI] [PMC free article] [PubMed] [Google Scholar]
- 19.Livak KJ, Schmittgen TD. Analysis of relative gene expression data using real-time quantitative PCR and the 2- - δCT method. Methods. 2001;25:402–408. doi: 10.1006/meth.2001.1262. [DOI] [PubMed] [Google Scholar]
- 20.Bianchi NO. Y chromosome structural and functional changes in human malignant diseases. Mutat Res. 2009;682:21–27. doi: 10.1016/j.mrrev.2009.02.001. [DOI] [PubMed] [Google Scholar]
- 21.Minner S, Kilgué A, Stahl P, Weikert S, Rink M, Dahlem R, Fisch M, Höppner W, Wagner W, Bokemeyer C, et al. Y chromosome loss is a frequent early event in urothelial bladder cancer. Pathology. 2010;42:356–359. doi: 10.3109/00313021003767298. [DOI] [PubMed] [Google Scholar]
- 22.Wallrapp C, Hähnel S, Boeck W, Soder A, Mincheva A, Lichter P, Leder G, Gansauge F, Sorio C, Scarpa A, et al. Loss of the Y chromosome is a frequent chromosomal imbalance in pancreatic cancer and allows differentiation to chronic pancreatitis. Int J Cancer. 2001;91:340–344. doi: 10.1002/1097-0215(200002)9999:9999<::aid-ijc1014>3.0.co;2-u. [DOI] [PubMed] [Google Scholar]
- 23.Harada T, Baril P, Gangeswaran R, Kelly G, Chelala C, Bhakta V, Caulee K, Mahon PC, Lemoine NR. Identification of genetic alterations in pancreatic cancer by the combined use of tissue microdissection and array-based comparative genomic hybridisation. Br J Cancer. 2007;96:373–382. doi: 10.1038/sj.bjc.6603563. [DOI] [PMC free article] [PubMed] [Google Scholar]
- 24.Harada T, Chelala C, Bhakta V, Chaplin T, Caulee K, Baril P, Young BD, Lemoine NR. Genome-wide DNA copy number analysis in pancreatic cancer using high-density single nucleotide polymorphism arrays. Oncogene. 2008;27:1951–1960. doi: 10.1038/sj.onc.1210832. [DOI] [PMC free article] [PubMed] [Google Scholar]
- 25.Harada T, Chelala C, Crnogorac-Jurcevic T, Lemoine NR. Genome-wide analysis of pancreatic cancer using microarray-based techniques. Pancreatology. 2009;9:13–24. doi: 10.1159/000178871. [DOI] [PubMed] [Google Scholar]
- 26.Nowak NJ, Gaile D, Conroy JM, McQuaid D, Cowell J, Carter R, Goggins MG, Hruban RH, Maitra A. Genome-wide aberrations in pancreatic adenocarcinoma. Cancer Genet Cytogenet. 2005;161:36–50. doi: 10.1016/j.cancergencyto.2005.01.009. [DOI] [PubMed] [Google Scholar]
- 27.Iacobuzio-Donahue CA, Fu B, Yachida S, Luo M, Abe H, Henderson CM, Vilardell F, Wang Z, Keller JW, Banerjee P, et al. DPC4 gene status of the primary carcinoma correlates with patterns of failure in patients with pancreatic cancer. J Clin Oncol. 2009;27:1806–1813. doi: 10.1200/JCO.2008.17.7188. [DOI] [PMC free article] [PubMed] [Google Scholar]
- 28.Mahadevan D, Von Hoff DD. Tumor-stroma interactions in pancreatic ductal adenocarcinoma. Mol Cancer Ther. 2007;6:1186–1197. doi: 10.1158/1535-7163.MCT-06-0686. [DOI] [PubMed] [Google Scholar]
- 29.Pilarsky C, Ammerpohl O, Sipos B, Dahl E, Hartmann A, Wellmann A, Braunschweig T, Löhr M, Jesenofsky R, Friess H, et al. Activation of Wnt signalling in stroma from pancreatic cancer identified by gene expression profiling. J Cell Mol Med. 2008;12:2823–2835. doi: 10.1111/j.1582-4934.2008.00289.x. [DOI] [PMC free article] [PubMed] [Google Scholar]
- 30.West NR, Milne K, Truong PT, Macpherson N, Nelson BH, Watson PH. Tumor-infiltrating lymphocytes predict response to anthracycline-based chemotherapy in estrogen receptor-negative breast cancer. Breast Cancer Res. 2011;13:R126. doi: 10.1186/bcr3072. [DOI] [PMC free article] [PubMed] [Google Scholar]
- 31.Ramaswamy S, Ross KN, Lander ES, Golub TR. A molecular signature of metastasis in primary solid tumors. Nat Genet. 2003;33:49–54. doi: 10.1038/ng1060. [DOI] [PubMed] [Google Scholar]
- 32.Ali S, Saleh H, Sethi S, Sarkar FH, Philip PA. MicroRNA profiling of diagnostic needle aspirates from patients with pancreatic cancer. Br J Cancer. 2012;107:1354–1360. doi: 10.1038/bjc.2012.383. [DOI] [PMC free article] [PubMed] [Google Scholar]
- 33.Bloomston M, Frankel WL, Petrocca F, Volinia S, Alder H, Hagan JP, Liu CG, Bhatt D, Taccioli C, Croce CM. MicroRNA expression patterns to differentiate pancreatic adenocarcinoma from normal pancreas and chronic pancreatitis. JAMA. 2007;297:1901–1908. doi: 10.1001/jama.297.17.1901. [DOI] [PubMed] [Google Scholar]
- 34.Jamieson NB, Morran DC, Morton JP, Ali A, Dickson EJ, Carter CR, Sansom OJ, Evans TR, McKay CJ, Oien KA. MicroRNA molecular profiles associated with diagnosis, clinicopathologic criteria, and overall survival in patients with resectable pancreatic ductal adenocarcinoma. Clin Cancer Res. 2012;18:534–545. doi: 10.1158/1078-0432.CCR-11-0679. [DOI] [PubMed] [Google Scholar]
- 35.Lee EJ, Gusev Y, Jiang J, Nuovo GJ, Lerner MR, Frankel WL, Morgan DL, Postier RG, Brackett DJ, Schmittgen TD. Expression profiling identifies microRNA signature in pancreatic cancer. Int J Cancer. 2007;120:1046–1054. doi: 10.1002/ijc.22394. [DOI] [PMC free article] [PubMed] [Google Scholar]
- 36.Mardin WA, Mees ST. MicroRNAs: novel diagnostic and therapeutic tools for pancreatic ductal adenocarcinoma? Ann Surg Oncol. 2009;16:3183–3189. doi: 10.1245/s10434-009-0623-1. [DOI] [PubMed] [Google Scholar]
- 37.Park JY, Helm J, Coppola D, Kim D, Malafa M, Kim SJ. Micro-RNAs in pancreatic ductal adenocarcinoma. World J Gastroenterol. 2011;17:817–827. doi: 10.3748/wjg.v17.i7.817. [DOI] [PMC free article] [PubMed] [Google Scholar]
- 38.Schultz NA, Werner J, Willenbrock H, Roslind A, Giese N, Horn T, Wøjdemann M, Johansen JS. MicroRNA expression profiles associated with pancreatic adenocarcinoma and ampullary adenocarcinoma. Mod Pathol. 2012;25:1609–1622. doi: 10.1038/modpathol.2012.122. [DOI] [PubMed] [Google Scholar]
- 39.Fu X, Guadagni F, Hoffman RM. A metastatic nude-mouse model of human pancreatic cancer constructed orthotopically with histologically intact patient specimens. Proc Natl Acad Sci USA. 1992;89:5645–5649. doi: 10.1073/pnas.89.12.5645. [DOI] [PMC free article] [PubMed] [Google Scholar]
- 40.Liang WS, Craig DW, Carpten J, Borad MJ, Demeure MJ, Weiss GJ, Izatt T, Sinari S, Christoforides A, Aldrich J, et al. Genome-wide characterization of pancreatic adenocarcinoma patients using next generation sequencing. PLoS One. 2012;7:e43192. doi: 10.1371/journal.pone.0043192. [DOI] [PMC free article] [PubMed] [Google Scholar]
- 41.Campa D, Butterbach K, Slager SL, Skibola CF, de Sanjosé S, Benavente Y, Becker N, Foretova L, Maynadie M, Cocco P, et al. A comprehensive study of polymorphisms in the ABCB1, ABCC2, ABCG2, NR1I2 genes and lymphoma risk. Int J Cancer. 2012;131:803–812. doi: 10.1002/ijc.26436. [DOI] [PMC free article] [PubMed] [Google Scholar]
- 42.Cusatis G, Gregorc V, Li J, Spreafico A, Ingersoll RG, Verweij J, Ludovini V, Villa E, Hidalgo M, Sparreboom A, et al. Pharmacogenetics of ABCG2 and adverse reactions to gefitinib. J Natl Cancer Inst. 2006;98:1739–1742. doi: 10.1093/jnci/djj469. [DOI] [PubMed] [Google Scholar]
- 43.Tian C, Ambrosone CB, Darcy KM, Krivak TC, Armstrong DK, Bookman MA, Davis W, Zhao H, Moysich K, Gallion H, et al. Common variants in ABCB1, ABCC2 and ABCG2 genes and clinical outcomes among women with advanced stage ovarian cancer treated with platinum and taxane-based chemotherapy: a Gynecologic Oncology Group study. Gynecol Oncol. 2012;124:575–581. doi: 10.1016/j.ygyno.2011.11.022. [DOI] [PMC free article] [PubMed] [Google Scholar]
- 44.Marchetti S, de Vries NA, Buckle T, Bolijn MJ, van Eijndhoven MA, Beijnen JH, Mazzanti R, van Tellingen O, Schellens JH. Effect of the ATP-binding cassette drug transporters ABCB1, ABCG2, and ABCC2 on erlotinib hydrochloride (Tarceva) disposition in in vitro and in vivo pharmacokinetic studies employing Bcrp1-/-/Mdr1a/1b-/- (triple-knockout) and wild-type mice. Mol Cancer Ther. 2008;7:2280–2287. doi: 10.1158/1535-7163.MCT-07-2250. [DOI] [PubMed] [Google Scholar]
- 45.Hertz DL, Roy S, Motsinger-Reif AA, Drobish A, Clark LS, McLeod HL, Carey LA, Dees EC. CYP2C8*3 increases risk of neuropathy in breast cancer patients treated with paclitaxel. Ann Oncol. 2013;24:1472–1478. doi: 10.1093/annonc/mdt018. [DOI] [PMC free article] [PubMed] [Google Scholar]
- 46.Han JY, Lim HS, Shin ES, Yoo YK, Park YH, Lee JE, Kim HT, Lee JS. Influence of the organic anion-transporting polypeptide 1B1 (OATP1B1) polymorphisms on irinotecan-pharmacokinetics and clinical outcome of patients with advanced non-small cell lung cancer. Lung Cancer. 2008;59:69–75. doi: 10.1016/j.lungcan.2007.07.019. [DOI] [PubMed] [Google Scholar]
- 47.Romero A, Martín M, Oliva B, de la Torre J, Furio V, de la Hoya M, García-Sáenz JA, Moreno A, Román JM, Diaz-Rubio E, et al. Glutathione S-transferase P1 c.313A > G polymorphism could be useful in the prediction of doxorubicin response in breast cancer patients. Ann Oncol. 2012;23:1750–1756. doi: 10.1093/annonc/mdr483. [DOI] [PubMed] [Google Scholar]
- 48.Giannoudis A, Wang L, Jorgensen AL, Xinarianos G, Davies A, Pushpakom S, Liloglou T, Zhang JE, Austin G, Holyoake TL, et al. The hOCT1 SNPs M420del and M408V alter imatinib uptake and M420del modifies clinical outcome in imatinib-treated chronic myeloid leukemia. Blood. 2013;121:628–637. doi: 10.1182/blood-2012-01-405035. [DOI] [PubMed] [Google Scholar]
- 49.Barrett MT, Lenkiewicz E, Evers L, Holley T, Ruiz C, Bubendorf L, Sekulic A, Ramanathan RK, Von Hoff DD. Clonal evolution and therapeutic resistance in solid tumors. Front Pharmacol. 2013;4:2. doi: 10.3389/fphar.2013.00002. [DOI] [PMC free article] [PubMed] [Google Scholar]
- 50.Holley T, Lenkiewicz E, Evers L, Tembe W, Ruiz C, Gsponer JR, Rentsch CA, Bubendorf L, Stapleton M, Amorese D, et al. Deep clonal profiling of formalin fixed paraffin embedded clinical samples. PLoS One. 2012;7:e50586. doi: 10.1371/journal.pone.0050586. [DOI] [PMC free article] [PubMed] [Google Scholar]
- 51.Ruiz C, Lenkiewicz E, Evers L, Holley T, Robeson A, Kiefer J, Demeure MJ, Hollingsworth MA, Shen M, Prunkard D, et al. Advancing a clinically relevant perspective of the clonal nature of cancer. Proc Natl Acad Sci USA. 2011;108:12054–12059. doi: 10.1073/pnas.1104009108. [DOI] [PMC free article] [PubMed] [Google Scholar]
Associated Data
This section collects any data citations, data availability statements, or supplementary materials included in this article.