

Abstract
Nicotinamide adenine dinucleotide (NAD) is a critical metabolite that is required for a range of cellular reactions. A key enzyme in the NAD salvage pathway is nicotinamide phosphoribosyl transferase (NAMPT), and here, we describe GNE-618, an NAMPT inhibitor that depletes NAD and induces cell death in vitro and in vivo. While cells proficient for nicotinic acid phosphoribosyl transferase (NAPRT1) can be protected from NAMPT inhibition as they convert nicotinic acid (NA) to NAD independent of the salvage pathway, this protection only occurs if NA is added before NAD depletion. We also demonstrate that tumor cells are unable to generate NAD by de novo synthesis as they lack expression of key enzymes in this pathway, thus providing a mechanistic rationale for the reliance of tumor cells on the NAD salvage pathway. Identifying tumors that are sensitive to NAMPT inhibition is one potential way to enhance the therapeutic effectiveness of an NAMPT inhibitor, and here, we show that NAMPT, but not NAPRT1, mRNA and protein levels inversely correlate with sensitivity to GNE-618 across a panel of 53 non-small cell lung carcinoma cell lines. Finally, we demonstrate that GNE-618 reduced tumor growth in a patient-derived model, which is thought to more closely represent heterogeneous primary patient tumors. Thus, we show that dependence of tumor cells on the NAD salvage pathway renders them sensitive to GNE-618 in vitro and in vivo, and our data support further evaluation of the use of NAMPT mRNA and protein levels as predictors of overall sensitivity.
Introduction
In recent years, there has been a tremendous increase in our understanding and appreciation for the role of cell metabolism in promoting tumorigenesis [1]. Specifically, it has become more widely accepted that tumor cells are dependent on specific metabolic pathways for growth and survival. Critical alterations in the flux through these pathways have been found in tumors. For instance, mutations have been discovered in the enzymes isocitrate dehydrogenase-1 (IDH1)/IDH2 [2] and fumarate hydratase [3], while phosphoglycerate dehydrogenase is amplified in some tumors [4]. Additionally, there are examples where oncogenes, such as KRAS in pancreatic tumors [5], or tumor suppressors, such as PTEN [6], have been implicated in reprogramming cell metabolism.
Nicotinamide adenine dinucleotide (NAD) is a critical cellular metabolite important for a wide range of cellular processes including energy production, reductive biosynthesis, mitochondrial function, calcium homeostasis, and the response to oxidative stress [7,8]. NAD generation primarily occurs through two key pathways, either by de novo synthesis initiated from cellular uptake of tryptophan or by the salvage pathway that recycles nicotinamide (NAM) to NAD [9]. A third pathway, the Preiss-Handler pathway [10,11], converts nicotinic acid (NA, also known as niacin or vitamin B3) to NA mono-nucleotide by the enzyme NA phosphoribosyl transferase (NAPRT1), which is then converted to NAD in two steps. Co-administration of NA with a nicotinamide phosphoribosyl transferase (NAMPT) inhibitor can prevent NAD depletion and cell death; however, this protection only occurs if cells are proficient for NAPRT1 [12]. Recent work has indicated that the primary mechanisms for inactivation of NAPRT1 in tumors is by DNA methylation, and a quantitative DNA methylation assay can be used to readily identify tumors that are NAPRT1 deficient (Shames et al., submitted for publication). Thus, the presence of two salvage pathways, with one selectively lost in tumor cells, suggested the intriguing concept of identifying tumors that are NAPRT1 deficient and then co-administrating an NAMPT inhibitor with NA in patients, as this approach could potentially protect normal host tissue but not NAPRT1-deficient tumor cells from NAMPT inhibition.
Two NAMPT small molecule inhibitors have entered clinical trials (GMX1778 and its prodrug GMX1777 and FK866/APO866). While both compounds completed phase I evaluation and entered phase II trials, no results beyond phase I data have been released [13–16]. Moreover, a common dose-limiting toxicity noted for both compounds was thrombocytopenia. One potential way to enhance the therapeutic effectiveness of an NAMPT inhibitor is to co-administer NA, as this is predicted to rescue NAPRT1-proficient cells. It has been shown that when labeled NA was added to purified human platelets it could be converted into NAD [17], indicating that the NAPRT1 pathway is functional in human platelets. Moreover, it was also shown that thrombocytopenia could be reduced in a murine model when NA was co-administered with FK866 [18]. Thus, co-administration of NA with an NAMPT inhibitor may spare platelets from NAMPT inhibition and may permit higher doses of an NAMPT inhibitor to be tolerated. While this approach was taken in one clinical trial, NA was not administered until days 8 to 15, but there was no effect on thrombocytopenia [19]. However, in this study, there was no attempt to preselect NAPRT1-deficient tumors and NA was administered to patients once thrombocytopenia appeared. An alternative approach to enhance the therapeutic effectiveness of an NAMPT inhibitor is to identify tumors that may be more susceptible to NAMPT inhibition. Interestingly, none of these clinical trials attempted to stratify patients based on potential sensitivity to an NAMPT inhibitor.
Here, we describe a novel NAMPT inhibitor, GNE-618, and demonstrate that this compound reduced in vivo tumor growth in an A549 non-small cell lung carcinoma (NSCLC) model. Moreover, we provide a mechanistic explanation for why tumor cells heavily rely on the NAMPT salvage pathway for NAD generation. Our data also suggest that co-administration of NA with an NAMPT inhibitor may be required in the clinic to afford maximum protection of normal tissue. Finally, we demonstrate that GNE-618 effectively reduces tumor growth of patient-derived gastric models. Out data suggest that patient stratification based on NAMPT sensitivity may provide an approach to enhance the therapeutic effectiveness of an NAMPT inhibitor.
Materials and Methods
Cell Lines and Viability Assays
Cell lines were obtained from the American Type Culture Collection (ATCC, Manassas, VA) or Deutsche Sammlung von Mikroorganismen und Zellkulturen (DSMZ, Braunschweig, Germany), expanded, and stored at early passage in a central cell bank. Lines were authenticated by short tandem repeat and genotyped upon re-expansions. Cells were grown in RPMI 1640 medium supplemented with 10% FBS and 2 mM glutamine (Invitrogen, Grand Island, NY) and passaged no more than 20 times after thawing.
To determine inhibitory constant (IC50) values, cells were plated such that 30% to 40% confluency was achieved the next day. Nine point dose titrations of GNE-618 were added to the cells, and after 96 hours, cell viability was quantified using CyQUANT Direct Cell Proliferation Assay (Invitrogen, Ltd), followed by CellTiter-Glo Luminescent Cell Viability Assay (Promega Corporation, Madison, WI), or by measuring total protein content using a CytoScan SRB Cytotoxicity Assay Kit (Cat. No. 786-213; G-Biosciences, St Louis, MO). IC50 values were calculated with a four-parameter fit using XLfit 5.1 (ID Business Solutions, Ltd, La Jolla, CA) or Prism 5.04 (GraphPad Software Inc, La Jolla, CA).
For image-based analysis, cells were stained with SYTOX Green (Cat. No. S7020; Life Technologies, Grand Island, NY), and nuclei were stained with Hoechst 33342 (Cat. No. R37605; Life Technologies). Images were acquired with ImageXpress Micro (Molecular Devices, Sunnyvale, CA) and quantified with MetaXpress software.
To generate inducible overexpression of NAMPT in 293T cells, NAMPT cDNA clone was purchased from Invitrogen (Cat. No. IOH44532, pENTR221). The expression vector and stable cell line were generated as described, with puromycin as a selection marker [20].
Metabolite Profiling and NAD Measurements
Calu-6 cells were exposed to 100 nM GNE-618 for 6 or 24 hours and harvested and processed according to Metabolon standard protocols [21]. For NAD measurements, cells were plated onto 24-well plates and treated with GNE-618 for 48 hours. After treatment, cells were washed with phosphate-buffered saline, and NAD was extracted with 0.5 N perchloric acid. Tumor samples were homogenized, treated with 0.5 N perchloric acid, and neutralized with ammonium formate. NAD levels were determined by a liquid chromatography-tandem mass spectrometry/mass spectrometry (LC-MS/MS) assay using 13C5-NAD as an internal standard.
mRNA Profiling and RNA-Seq Data Analysis
Analysis of NAMPT mRNA levels in the NSCLC cell line panel was carried out as described [22]. RNA-seq reads were aligned to the human genome version GRCh37 using Genomic Short-read Nucleotide Alignment Program (GSNAP) [23]. Gene expression was obtained by counting the number of reads aligning concordantly within a pair and uniquely to each gene locus as defined by consensus coding DNA sequence (CCDS). The gene counts were then normalized using the DESeq Bioconductor software package [24].
Intracellular Multiparameter Flow Cytometry
Cells were fixed in 1% paraformaldehyde (RT15711; Electron Microscopy Sciences, Hatfield, PA), permeabilized, and stained in BD Perm/Wash Buffer (554723; BD Biosciences, San Jose, CA). Cell staining was carried out with anti-phospho-histone H3-AF488 antibody (3465; Cell Signaling Technology, Danvers, MA) and a propidium iodide staining solution (25 mg/ml Cf, P4864; Sigma-Aldrich, St Louis, MO) containing RNAse A (R6513; Sigma-Aldrich). Flow cytometry collection was performed on an LSRII flow cytometer (BD Biosciences), and data were analyzed using FlowJo software (TreeStar Inc, Ashland, OR).
Western Blot Analysis
Western blot analysis was performed, and the signals were quantified with LI-COR Odyssey System. Western blot analysis was carried out using antibodies directed against NAMPT (clone 4D5, Cat. No. NBP1-0435; Novus, Littleton, CO), NAPRT1 (Cat. No. HPA024017; Sigma), or ACTIN (A5441; Sigma).
Xenograft Models
All in vivo studies were approved by Genentech's Institutional Animal Care and Use Committee and adhere to the National Institutes of Health Guidelines for the Care and Use of Laboratory Animals. Human cell culture-derived tumor xenografts were established by subcutaneous injection of tumor cells into NCr nude mice (Taconic Laboratories, Oxnard, CA). Patient-derived xenograft models were established from primary tumor fragments engrafted subcutaneously in BALB/c nude mice. Animals were distributed into treatment groups (n = 10 per group) when tumors reached a mean volume of approximately 150 to 300 mm3. GNE-618 (100 mg/kg) and niacin (100 mg/kg) were administered by oral gavage in PEG400/H2O/EtOH (60/30/10) and sterile water vehicles, respectively. Tumor volumes were determined using digital calipers (Fred V. Fowler Company, Inc, Newton, MA) using the formula (L x W x W)/2. Curve fitting was applied to log2-transformed individual tumor volume data using a linear mixed-effects model with the R package nlme, version 3.1-97 in R v2.13.0 (R Development Core Team 2008; R Foundation for Statistical Computing, Vienna, Austria). Tumor growth inhibition (%TGI) was calculated as the percentage of the area under the fitted curve (AUC) for the respective drug treatment group per day relative to vehicle control animals, such that %TGI = 100 x (1 - (AUCtreatment/day)/(AUCvehicle/day)). One hundred percent TGI is characterized as tumor stasis, whereas values greater than 100% TGI indicates tumor regression. Ninety-five percent confidence intervals (CIs) were defined by the lower and upper ranges of %TGI values for each drug treatment group. Tumor sizes and body weights were recorded twice weekly over the course of the study. Mice with tumor volumes ≥2000 mm3 and recorded body weight loss ≥20% from their weight at the start of treatment were promptly killed.
Results
Inhibition of NAMPT with GNE-618 Induces Cell Death
GNE-618 was recently identified as a novel small molecule inhibitor that inhibits NAMPT in a biochemical assay with an IC50 of 0.006 µM (Zheng et al., manuscript in preparation; Figure 1A) and reduced levels of NAD with an 50% minimal response (EC50) of 2.6 nM in the NSCLC cell line Calu-6 (Figure 1B). Cell cycle analysis of Calu-6 cells exposed to GNE-618 for 72 hours revealed an increase in the sub-2N population, which is indicative of cell death, and a decrease in the percentage of cells in the G1 and M phases of the cell cycle (Figure 1C). We specifically note a dramatic reduction in the mitotic index (Figures 1C and W1A). Thus, inhibition of NAMPT results in broad cell cycle effects, a rapid loss of mitotic cells, and a loss of cell viability.
Figure 1.

GNE-618 reduces NAD levels and cell viability in Calu-6 NSCLC cells. (A) Structure of GNE-618 and its associated IC50 for NAMPT. (B) A dose titration of GNE-618 reduces NAD levels in Calu-6 cells at 48 hours as measured by LC-MS/MS (average ± SD, n = 2 (C) Cell cycle analysis of Calu-6 cells following 72-hour incubation with the indicated concentrations of GNE-618 (averages ± SD, n = 2). (D) GNE-618 reduces ATP and protein levels (SRB assay) (average ± SD, n = 3). In both cases, co-administration of 10 µM NA with GNE-618 prevents loss of viability. (E) Calu-6 cells were incubated with 200 nM GNE-618, 10 µM NA, or both for 48 hours, and NAD levels were quantified by LC-MS/MS (average ± SD is shown, n = 2). (F) GNE-618 was added to Calu-6 cells at time 0, and 10 µM NA was added at the indicated times and viability was assessed at 96 hours (SRB assay; average ± SD, n = 2). (G) Calu-6 cells were exposed to 100 nM GNE-618 for various times and harvested, and NAD levels were determined by LC-MS/MS (average ± SD, n = 2).
GNE-618 also reduced cellular proliferation of Calu-6 cells as determined using two different assay formats, either measuring ATP (EC50 of 13.6 ± 1.8 nM) or total protein content (SRB assay; EC50 of 25.8 ± 4.2 nM; Figure 1D). As Calu-6 cells express NAPRT1 (O'Brien et al., submitted for publication), we verified that this reduction in viability and cell death in response to GNE-618 was due to on-target inhibition of NAMPT, as these cells could be rescued by the co-administration of NA (Figure 1D). We confirmed that these cells were dying, as there was a reduction in live cell nucleic acid content (CyQUANT Direct), a decrease in nucleus number (Hoechst stain), and an increase in dead cells (SYTOX Green assay; Figure W1, B and C). In all cases EC50 values ranged from ∼16 to 38 nM.
While GNE-618 can effectively deplete Calu-6 NAD levels by ∼95% within 24 hours, we verified that protection with NA prevents depletion of NAD (Figure 1E). Surprisingly, protection of cell death by NA only occurs if NA is added within ∼24 hours of GNE-618 (Figures 1F and W1D). At 48 hours, NAD is depleted by >99%, whereas, at 24 hours, there is still ∼10% of cellular NAD remaining (Figure 1G). Thus, NA must be present within 24 hours to afford maximum protection from NAMPT inhibition, suggesting that there is an NAD threshold that is required to maintain viability; once NAD levels drop below this threshold (∼95%), cells are unable to recover.
Tumor Cells Are Dependent on the Salvage Pathway as They Are Unable to Use the De Novo Pathway to Generate NAD
To better understand the effect of NAD depletion on global metabolic pathways, we undertook a metabolomic analysis using Calu-6 cells to probe which metabolites and/or pathways are modulated in response to NAMPT inhibition. Calu-6 cells were exposed to GNE-618 for 6 or 24 hours, and metabolites were identified both by gas chromatography (GC)-MS and by LC-MS/MS; this analysis led to the identification of a total of 367 unique metabolites (Table W1).
We initially focused on metabolites in the NAD salvage pathway and observed that levels of NAD, NAM, and nicotinamide ribonucleotide (NMN) all significantly decreased within 24 hours (Figure 2A). When a more global analysis was undertaken, there were changes in metabolite levels within 6 hours in the cofactor/vitamin (includes NAD), amino acid, and carbohydrate synthesis pathways (Figure 2B). By 24 hours, more significant changes are observed, most notably affecting cofactor/vitamin, nucleotide synthesis, lipid synthesis, glycolysis, and amino acid metabolism. Within glycolysis, there was a reduction in levels of 2-phosphoglycerate, phosphoenolpyruvate, and pyruvate, each of which is downstream of a key NAD-using step (Figure 2C). Interestingly, other than a large increase in levels of dihydroxyacetone phosphate, there was no significant accumulation of metabolites upstream of glyceraldehyde-3-phosphate, as would be expected if there was a block in the latter steps of glycolysis, as previously described for FK866 [25]. This could be explained by the observation of an increase in maltose, maltotriose, and maltotetraose metabolites (Figure 2D), which is consistent with cells diverting their excess glucose toward glycogen deposition. Thus, rather than accumulating six-carbon glycolytic intermediates, it appears that Calu-6 cells may dispose of excess glucose by converting it into glycogen. Additionally, there are decreases in nucleotide, lipid, and amino acid synthesis, which may contribute to the cell cycle effects arising from NAD depletion. Moreover, at 24 hours there is an increase in peptide levels, possibly consistent with cell death. This altered metabolic profile is generally consistent with recent reports indicating a role for NAMPT in de novo lipogenesis in prostate cancer cells [26] and for a role in glycolysis [25].
Figure 2.

Metabolomic profiling of Calu-6 tumor cells following NAMPT inhibition. (A) Calu-6 cells were exposed to 100 nM GNE-618 for 6 or 24 hours, and metabolomic profiling was used to evaluate changes in a total of 367 unique metabolites. The levels of NAD, NMN, and NAM at 6 and 24 hours following exposure to GNE-618 are shown relative to levels in control cells (average ± SD, n = 5 for each group). (B) The graphs indicate the log2-fold change in each metabolite relative to control cells at 6 and 24 hours following exposure to GNE-618 (n = 5 for each time point). Modulation of metabolites involved in glycolysis (C) or glycogen storage (D) in Calu-6 cells at 6 and 24 hours is shown. The relative level of each detectable metabolite is shown (n = 5). The whiskers span the 10% to 90% percentile range of the data, and the median is shown as a line.
The rapid reduction of salvage pathway metabolites (NAD, NMN, and NAM) that occurred following NAMPT inhibition (Figure 2A) suggested that NAD cannot be readily replenished by the de novo pathway, which catabolizes tryptophan through a series of eight steps to generate NAD [9]. While only two metabolites in the de novo pathway, tryptophan and kynurenine, could be detected by metabolomic profiling, there was clearly no evidence for an increase in steady-state levels of either of these metabolites, although reduced levels of both was detected at 24 hours (Figure 3A). However, while this suggests that there is no up-regulation of the de novo pathway, this type of analysis only reveals the steady-state levels of these metabolites and may not accurately reflect flux through the pathway.
Figure 3.
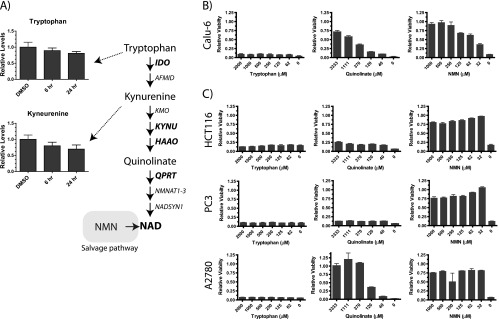
Tumor cell lines are unable to use the de novo pathway to generate NAD. (A) Two metabolites (tryptophan and kynurenine) in the de novo pathway were detected in our metabolomic profiling, and their relative levels in control cells or cells exposed to GNE-618 for 6 and 24 hours are shown (n = 5 ± SD). Key metabolites in the de novo salvage pathway are shown in the pathway diagram along with the enzymes that catalyze each step. (B) Calu-6 cells were incubated with 200 nM GNE-618 and a dose titration of tryptophan, quinolinate, or NMN, for 96 hours, and cell viability was assessed (CyQUANT readout; average ± SD, n = 2). (C) HCT-116, PC-3, and A2780 cells were incubated with 200 nM GNE-618 and a dose titration of tryptophan, quinolinate, or NMN, for 96 hours, and cell viability was assessed (CyQUANT readout; average ± SD, n = 3).
To further evaluate the ability of Calu-6 cells to use the de novo pathway, a functional assay was used to evaluate if this pathway was active. Media were supplemented with up to 2 mM tryptophan to determine if adding an excess of tryptophan could protect cells from GNE-618 by generating NAD through the de novo pathway. Surprisingly, tryptophan could not prevent cell death in response to GNE-618 (Figure 3B). In contrast, the addition of NMN, the downstream product of NAMPT, prevented cell death mediated by GNE-618 (Figure 3B), consistent with previous reports that NMN can prevent cell death in response to the NAMPT inhibitor FK866 or GMX1778 [12,27]. Surprisingly quinolinate, an intermediate in the de novo pathway that is downstream of kynurenine and three steps upstream of NAD, could protect cells from NAMPT inhibition. The maximal protection obtained with quinolinate was ∼70%, as higher concentrations were lethal to cells. To expand this analysis beyond Calu-6 cells, we examined the ability of cell lines representing different tumor types to be protected from NAMPT inhibition with these same metabolites. Like Calu-6 cells, we found that HCT-116 (colo-rectal), PC-3 (prostate), and A2780 (ovarian) cancer cells were not protected from cell death with the co-administration of tryptophan (Figure 3C). Interestingly, the ability of quinolinate to protect cells varied, suggesting that some tumor cells have the ability to use downstream metabolites to generate NAD. In contrast, all cell lines could be protected by NMN (Figure 3C).
We next examined mRNA levels of select enzymes in the de novo pathway, as the inability to use intermediates could be explained by the lack of expression of key enzymes. We profiled mRNA levels of IDO1, KYNU, HAAO, and QPRT by RNA-seq and discovered that all four cell lines had undetectable levels of either IDO1 or KYNU, potentially explaining the inability of tryptophan to rescue these cell lines (Table 1). Additionally, the two cell lines that could be rescued with quinolinate (A2780 and Calu-6) were the only two cell lines that had detectable mRNA levels for QPRT. Thus, our data suggest that the inability of these tumor cell lines to use the de novo pathway is due to lack of expression of key components early in the pathway and thus provide an explanation for why tumor cell lines are reliant on the salvage pathway for NAD generation.
Table 1.
mRNA Levels as Determined by RNA-Seq of Key Enzymes in the De Novo NAD Synthesis Pathways in the Indicated Cell Lines.
| Cell Line | Trp Rescue | Quin Rescue | IDO1 | KYNU | HAAO | QPRT |
| A2780 | N | Y | 0.56 | -4.00 | -4.00 | 4.14 |
| Calu-6 | N | Y | -4.00 | 1.94 | -0.60 | 5.22 |
| HCT116 | N | N | -4.00 | -4.00 | -4.00 | -4.00 |
| PC3 | N | N | -4.00 | -1.08 | -4.00 | -4.00 |
Expression levels are displayed as the log2 RPKM.
Cell Line Profiling Reveals that NAMPT, but Not NAPRT1, mRNA and Protein Levels Predict Sensitivity to GNE-618
Screening of GNE-618 across a panel of 53 NSCLC cell lines revealed that ∼25% of the cell lines had an EC50 of <10 nM and ∼50% had an EC50 less than 25 nM by CellTiter-Glo assay (ATP measurement; Figure 4A and Table W2). EC50 values obtained with CyQUANT Direct assay (live nucleic acid measurement) yield similar results (Figure W2A; Spearman r = 0.99). While there are no reports of any correlation between NAPRT1 levels and sensitivity to NAMPT inhibitors, it remains ambiguous whether NAMPT protein or mRNA levels predict sensitivity. One report showed that NAMPT mRNA levels correlated with sensitivity to GMX1778 across 25 tumor cell lines (r = 0.83) [12], whereas a more recent report did not see a correlation between sensitivity of FK866 and NAMPT protein levels in 18 multiple myeloma cell lines (r = 0.136) [28]. Thus, we were interested to test if NAMPT and/or NAPRT1 mRNA or protein levels would predict sensitivity to GNE-618 across a panel of NSCLC cell lines. Using gene expression arrays, we found a correlation between NAMPT mRNA levels and sensitivity to GNE-618 (Spearman r = 0.75, P < .0001; Figure 4B) but no correlation between NAPRT1 mRNA levels and sensitivity to GNE-618 (Spearman r = 0.31, P = .009; Figure 4C). To examine the correlation between protein levels and sensitivity to GNE-618, we performed Western blot analysis on a subset of these cell lines and determined that NAMPT protein levels also correlated with overall sensitivity (Spearman r = 0.723, P < .0001; Figures 4D and W2B), whereas NAPRT1 levels did not (Spearman r = 0.31, P = .052; Figures 4E and W2B). Thus, our data demonstrate that NAMPT, but not NAPRT1, mRNA and protein levels inversely correlate with sensitivity to GNE-618 across a large panel of cell lines. We also confirmed that NAMPT protein levels could impact sensitivity to GNE-618, as overexpression of a GFP-tagged version of NAMPT decreased sensitivity to GNE-618 in 293T cells (Figure W3).
Figure 4.

NAMPT, but not NAPRT1, mRNA and protein levels correlate with sensitivity to GNE-618. (A) The calculated EC50 (average ± SD, n = 3) for each cell line following exposure to GNE-618 for a total of 96 hours (CellTiter-Glo) is shown. NAMPT (B) or NAPRT1 (C) mRNA levels (log2, RMA normalized) [22] were compared to the EC50 for GNE-618 for each cell line. Representative cell lines were assayed for NAMPT (D) or NAPRT1 (E) protein levels by Western blot analysis. Protein levels in each line were compared to the corresponding EC50 for GNE-618.
GNE-618 Induces TGI in an A549 Tumor Xenograft Model
GNE-618 inhibited A549 cell growth with an EC50 of 27.2 ± 9.8 nM (Figure 4A and Table W2), which was reversed upon co-treatment with NA (Figure 5A). In addition, NAD levels were rapidly reduced in a time-dependent manner after treatment with GNE-618 (Figure 5B). We therefore decided to examine the efficacy of GNE-618 in an A549 xenograft model. GNE-618, administered orally at 100 mg/kg (maximum efficacious dose; Zheng et al., manuscript in preparation), significantly inhibited tumor growth by 88% (lower CI = 57 and upper CI = 105; Figure 5C) and had minimal effects on body weight (Figure W4A) when compared to vehicle-treated animals. Co-administration of NA with GNE-618 completely abrogated the antitumor growth effects of NAMPT inhibition in vivo (Figure 5C). Thus, GNE-618 can effectively attenuate tumor growth of the A549 NSCLC xenograft model and this effect is due to on-target inhibition of NAMPT.
Figure 5.

GNE-618 inhibits tumor growth of an A549 NSCLC xenograft model. (A) A549 cells were incubated with a dose titration of GNE-618 in the presence or absence of 10 µM NA, and viability was measured after 96 hours (CellTiter-Glo assay; average ± SD, n = 3). (B) A549 cells were exposed to 100 nM GNE-618 for various times, and NAD levels were determined by LC-MS/MS (average ± SD, n = 2). (C) GNE-618 was administered orally and daily for 21 days, and NA was co-administered orally twice daily for 21 days in A549 tumor xenografts (n = 10 animals per group). The bar below the x-axis indicates the dosing period.
GNE-618 Reduces NAD Level and Is Efficacious in a Patient-Derived Tumor Xenograft Model
While our data and previous publications [12,18,28,29] have shown that inhibition of NAMPT can decrease tumor burden in cell culture-derived xenograft models, studies using patient-derived tumor models have not been reported. Thus, our aim was to determine if GNE-618 would also demonstrate in vivo efficacy in a model that may be more representative of the heterogeneity observed in primary patient tumors.
We examined the ability of GNE-618 to reduce tumor growth in a gastric tumor model, STO#81, and found that administration of GNE-618 at 100 mg/kg daily for 5 days had minimal effects on body weight (Figure W4B) but induced tumor regressions and inhibited tumor growth by 126% (lower CI = 110 and upper CI = 164; Figure 6A). Remarkably, GNE-618 induced durable tumor regressions up to day 21, even though drug treatment was discontinued on day 5. We also verified that TGI was due to on-target inhibition of NAMPT, as twice daily co-administration of 100 mg/kg NA significantly reduced TGI with GNE-618. NAD levels were also examined in these tumors 1 hour following the last dose of 100 mg/kg GNE-618 and was found to be reduced by >95% (Figure 6B). Tumors from animals that were also co-dosed with 100 mg/kg NA showed a modest reduction of NAD levels, although this was not statistically significant.
Figure 6.

GNE-618 inhibits growth of the STO#81 patient-derived gastric model. (A) GNE-618 was administered orally for 5 days at 100 mg/kg, and tumor growth was monitored for 24 days (n = 10 animals per group). NA (100 mg/kg) was either dosed alone or with GNE-618 orally twice daily for 5 days. The bar below the x-axis indicates the dosing period. (B) NAD levels in tumors derived from the STO#81 model harvested at 1 hour following the final oral dose of GNE-618 (100 mg/kg) ± NA (100 mg/kg) on day 5. Tumors were harvested and NAD levels were quantified by LC-MS/MS. The average tumor NAD level ± SD (n = 4 animals per group) relative to vehicle-treated animals is shown. Asterisk indicates P < .005.
Discussion
NAMPT is a very appealing therapeutic target given its central role in the NAD salvage pathway, and inhibition of NAMPT with small molecule inhibitors, such as GMX1778/1777 [12,29] and FK866 [28,30], can rapidly reduce NAD levels in tumor cells and induce cell death. Here, we describe GNE-618, a novel NAMPT inhibitor, and show that this compound effectively depletes NAD levels in cells and tumors and is efficacious in multiple xenograft models.
Metabolomic profiling in Calu-6 cells revealed that inhibition of the NAD salvage pathway resulted in modulation of metabolites across many different metabolic pathways. Interestingly, the profile was consistent with a reduction of three-carbon metabolites downstream of the enzyme glyceraldehyde-3-phosphate, similar to what was recently reported for the NAMPT inhibitor FK866 [25]. In Calu-6 cells however, no accumulation of the upstream six-carbon metabolites was noted. In addition, no large changes were observed in metabolites in the pentose phosphate pathway, again suggesting that even though carbon flux through glycolysis may be reduced, metabolites do not overflow into the pentose phosphate pathway, as observed in A2780 and HCT116 cells in response to the NAMPT inhibitor FK866 [25]. Instead, our data suggest that excess metabolites are diverted to promote glycogen storage. Thus, even though many of the key effects on metabolic pathways may be similar, it appears that different cell types may have adapted different approaches to deal with metabolic imbalance.
Both metabolomic profiling and functional assays reveal that the NAD de novo synthesis pathway is defective in tumor cells, thus explaining the dependence of these cells on the NAD salvage pathway. We determined that lack of protection of cell lines with tryptophan could potentially be explained by the lack of expression of IDO and/or KYNU (Table 1), and all four cell lines tested lacked expression of at least two enzymes critical for metabolite progression through the kynurenine pathway. Interestingly, two of the four cell lines that could use quinolinate were the only cell lines that expressed QPRT and thus could convert quinolinate to NA mononucleotide. It is not clear why these cell lines have silenced expression of genes involved in de novo synthesis; nevertheless, the consequence is that these cell lines are highly reliant on the NAMPT-mediated salvage pathway for NAD generation. Thus, our data show that the NAD salvage pathway is critical for cancer cells, and our data also provide, for the first time, a mechanistic rationale for this dependence.
Both in vitro and in vivo activities of GNE-618 is due to on-target inhibition of NAMPT, as co-administration of NA prevents loss of NAD (Figures 1E and 6B) and both cell viability and TGI (Figures 1D, 5C, and 6A). There was no strong correlation with either NAPRT1 mRNA or protein levels (Figure 4, C and E). The latter result is not surprising, as this pathway is only used in cells when they are supplied with sufficient levels of NA (10 µM affords full protection; Figure 1D). Moreover, it has been shown that expression of NAPRT1 is a good predictor of the ability of NA to protect cells from NAMPT inhibition [12,30,31] (Shames et al., submitted for publication). There has been conflicting evidence in the literature on the relationship between NAMPT inhibition and mRNA and protein levels [12,28]. Our data show a clear correlation between NAMPT mRNA (r = 0.75) andprotein (r = 0.72) levels with sensitivity to GNE-618 in a panel of NSCLC cell lines (Figure 4, B and D).
We also report the interesting observation that NA is only protective when added within a window of ∼24 hours following GNE-618 addition, which corresponds to a time when NAD has not been depleted. There was one attempt at co-administrating NA with an NAMPT inhibitor (GMX1777) in a phase I clinical trial [19], but in this case, niacin was only administered on days 8 to 15 and was not able to prevent thrombocytopenia but did ameliorate skin rash. Our data suggest that efficient protection of host tissue might be better achieved with early administration of NA and potentially explain why no protection of platelets was observed in this clinical trial.
GNE-618, a novel NAMPT inhibitor, is efficacious in vivo and reduces tumor growth of a patient-derived tumor xenograft model. Additionally, we believe that our data warrant further exploration of the possibility of using NAMPT mRNA and/or protein levels as predictors of overall response to NAMPT inhibition. In summary, our data provide functional evidence that tumor cells are dependent on the NAD salvage pathway and illustrate the potential for the use of NAMPT inhibitors across multiple tumor types.
Supplementary Material
Acknowledgments
The authors thank the in vivo cell culture and dosing groups at Genentech for their support of in vivo efficacy and pharmacodynamic studies, Min (Mindy) Gao for assistance with mass spectrometry analysis, the Genentech gCell group (Richard Neve, Suresh Selvaraj, and Mamie Yu) for cell line maintenance, Richard Bourgon for assistance with interpretation of gene expression data, and Anneleen Daemen for assistance with metabolomic profiling analysis.
Footnotes
All authors were or are full-time employees of Genentech.
This article refers to supplementary materials, which are designated by Tables W1 and W2 and Figures W1 to W4 and are available online at www.neoplasia.com.
References
- 1.Ward PS, Thompson CB. Metabolic reprogramming: a cancer hallmark even Warburg did not anticipate. Cancer Cell. 2012;21(3):297–308. doi: 10.1016/j.ccr.2012.02.014. [DOI] [PMC free article] [PubMed] [Google Scholar]
- 2.Yan H, Parsons DW, Jin G, McLendon R, Rasheed BA, Yuan W, Kos I, Batinic-Haberle I, Jones S, Riggins GJ, et al. IDH1 and IDH2 mutations in gliomas. N Engl J Med. 2009;360(8):765–773. doi: 10.1056/NEJMoa0808710. [DOI] [PMC free article] [PubMed] [Google Scholar]
- 3.Tomlinson IP, Alam NA, Rowan AJ, Barclay E, Jaeger EE, Kelsell D, Leigh I, Gorman P, Lamlum H, Rahman S, et al. Germline mutations in FH predispose to dominantly inherited uterine fibroids, skin leiomyomata and papillary renal cell cancer. Nat Genet. 2002;30(4):406–410. doi: 10.1038/ng849. [DOI] [PubMed] [Google Scholar]
- 4.Locasale JW, Grassian AR, Melman T, Lyssiotis CA, Mattaini KR, Bass AJ, Heffron G, Metallo CM, Muranen T, Sharfi H, et al. Phosphoglycerate dehydrogenase diverts glycolytic flux and contributes to oncogenesis. Nat Genet. 2011;43(9):869–874. doi: 10.1038/ng.890. [DOI] [PMC free article] [PubMed] [Google Scholar]
- 5.Ying H, Kimmelman AC, Lyssiotis CA, Hua S, Chu GC, Fletcher-Sananikone E, Locasale JW, Son J, Zhang H, Coloff JL, et al. Oncogenic Kras maintains pancreatic tumors through regulation of anabolic glucose metabolism. Cell. 2012;149(3):656–670. doi: 10.1016/j.cell.2012.01.058. [DOI] [PMC free article] [PubMed] [Google Scholar]
- 6.Garcia-Cao I, Song MS, Hobbs RM, Laurent G, Giorgi C, de Boer VCJ, Anastasiou D, Ito K, Sasaki AT, Rameh L, et al. Systemic elevation of PTEN induces a tumor-suppressive metabolic state. Cell. 2012;149(1):49–62. doi: 10.1016/j.cell.2012.02.030. [DOI] [PMC free article] [PubMed] [Google Scholar]
- 7.Burgos ES. NAMPT in regulated NAD biosynthesis and its pivotal role in human metabolism. Curr Med Chem. 2011;18(13):1947–1961. doi: 10.2174/092986711795590101. [DOI] [PubMed] [Google Scholar]
- 8.Ying W. NAD+/NADH and NADP+/NADPH in cellular functions and cell death: regulation and biological consequences. Antioxid Redox Signal. 2008;10(2):179–206. doi: 10.1089/ars.2007.1672. [DOI] [PubMed] [Google Scholar]
- 9.Bogan KL, Brenner C. Nicotinic acid, nicotinamide, and nicotinamide riboside: a molecular evaluation of NAD+ precursor vitamins in human nutrition. Annu Rev Nutr. 2008;28:115–130. doi: 10.1146/annurev.nutr.28.061807.155443. [DOI] [PubMed] [Google Scholar]
- 10.Preiss J, Handler P. Enzymatic synthesis of nicotinamide mono-nucleotide. J Biol Chem. 1957;225(2):759–770. [PubMed] [Google Scholar]
- 11.Preiss J, Handler P. Biosynthesis of diphosphopyridine nucleotide. I. Identification of intermediates. J Biol Chem. 1958;233(2):488–492. [PubMed] [Google Scholar]
- 12.Watson M, Roulston A, Bélec L, Billot X, Marcellus R, Bédard D, Bernier C, Branchaud S, Chan H, Dairi K, et al. The small molecule GMX1778 is a potent inhibitor of NAD+ biosynthesis: strategy for enhanced therapy in nicotinic acid phosphoribosyltransferase 1-deficient tumors. Mol Cell Biol. 2009;29(21):5872–5888. doi: 10.1128/MCB.00112-09. [DOI] [PMC free article] [PubMed] [Google Scholar]
- 13.Holen K, Saltz LB, Hollywood E, Burk K, Hanauske AR. The pharmacokinetics, toxicities, and biologic effects of FK866, a nicotinamide adenine dinucleotide biosynthesis inhibitor. Invest New Drugs. 2008;26(1):45–51. doi: 10.1007/s10637-007-9083-2. [DOI] [PubMed] [Google Scholar]
- 14.Hovstadius P, Larsson R, Jonsson E, Skov T, Kissmeyer AM, Krasilnikoff K, Bergh J, Karlsson MO, Lonnebo A, Ahlgren J. A phase I study of CHS 828 in patients with solid tumor malignancy. Clin Cancer Res. 2002;8(9):2843–2850. [PubMed] [Google Scholar]
- 15.Ravaud A, Cerny T, Terret C, Wanders J, Bui BN, Hess D, Droz JP, Fumoleau P, Twelves C. Phase I study and pharmacokinetic of CHS-828, a guanidino-containing compound, administered orally as a single dose every 3 weeks in solid tumours: an ECSG/EORTC study. Eur J Cancer. 2005;41(5):702–707. doi: 10.1016/j.ejca.2004.12.023. [DOI] [PubMed] [Google Scholar]
- 16.von Heideman A, Berglund A, Larsson R, Nygren P. Safety and efficacy of NAD depleting cancer drugs: results of a phase I clinical trial of CHS 828 and overview of published data. Cancer Chemother Pharmacol. 2010;65(6):1165–1172. doi: 10.1007/s00280-009-1125-3. [DOI] [PubMed] [Google Scholar]
- 17.Gaut ZN, Solomon HM. Uptake and metabolism of nicotinic acid by human blood platelets. Effects of structure analogs and metabolic inhibitors. Biochim Biophys Acta. 1970;201(2):316–322. doi: 10.1016/0304-4165(70)90306-5. [DOI] [PubMed] [Google Scholar]
- 18.Olesen UH, Thougaard AV, Jensen PB, Sehested M. A preclinical study on the rescue of normal tissue by nicotinic acid in high-dose treatment with APO866, a specific nicotinamide phosphoribosyltransferase inhibitor. Mol Cancer Ther. 2010;9(6):1609–1617. doi: 10.1158/1535-7163.MCT-09-1130. [DOI] [PubMed] [Google Scholar]
- 19.Pishvaian MJ, Marshall JL, Hwang JH, Malik S, He AR, Deeken JF, Kelso CB, Cotarla I, Berger MS. A phase I trial of GMX1777: an inhibitor of nicotinamide phosphoribosyl transferase (NAMPT), given as a 24 hour infusion. J Clin Oncol. 2009;27(15S) Suppl Abstract 3581. [Google Scholar]
- 20.Torres JZ, Miller JJ, Jackson PK. High-throughput generation of tagged stable cell lines for proteomic analysis. Proteomics. 2009;9(10):2888–2891. doi: 10.1002/pmic.200800873. [DOI] [PMC free article] [PubMed] [Google Scholar]
- 21.Reitman ZJ, Jin G, Karoly ED, Spasojevic I, Yang J, Kinzler KW, He Y, Bigner DD, Vogelstein B, Yan H. Profiling the effects of isocitrate dehydrogenase 1 and 2 mutations on the cellular metabolome. Proc Natl Acad Sci USA. 2011;108(8):3270–3275. doi: 10.1073/pnas.1019393108. [DOI] [PMC free article] [PubMed] [Google Scholar]
- 22.Yauch RL, Januario T, Eberhard DA, Cavet G, Zhu W, Fu L, Pham TQ, Soriano R, Stinson J, Seshagiri S, et al. Epithelial versus mesenchymal phenotype determines in vitro sensitivity and predicts clinical activity of erlotinib in lung cancer patients. Clin Cancer Res. 2005;11(24):8686–8698. doi: 10.1158/1078-0432.CCR-05-1492. [DOI] [PubMed] [Google Scholar]
- 23.Wu TD, Nacu S. Fast and SNP-tolerant detection of complex variants and splicing in short reads. Bioinformatics. 2010;26(7):873–881. doi: 10.1093/bioinformatics/btq057. [DOI] [PMC free article] [PubMed] [Google Scholar]
- 24.Anders S, Huber W. Differential expression analysis for sequence count data. Genome Biol. 2010;11(10):R106. doi: 10.1186/gb-2010-11-10-r106. [DOI] [PMC free article] [PubMed] [Google Scholar]
- 25.Tan B, Young DA, Lu Z-H, Wang T, Meier TI, Shepard RL, Roth K, Zhai Y, Huss K, Kuo M-S, et al. Pharmacological inhibition of nicotinamide phosphoribosyltransferase (NAMPT), an enzyme essential for NAD+ biosynthesis, in human cancer cells: metabolic basis and potential clinical implications. J Biol Chem. 2013;288(5):3500–3511. doi: 10.1074/jbc.M112.394510. [DOI] [PMC free article] [PubMed] [Google Scholar]
- 26.Bowlby SC, Thomas MJ, D'Agostino RB, Jr, Kridel SJ. Nicotinamide phosphoribosyl transferase (Nampt) is required for de novo lipogenesis in tumor cells. PLoS One. 2012;7(6):e40195. doi: 10.1371/journal.pone.0040195. [DOI] [PMC free article] [PubMed] [Google Scholar]
- 27.Billington RA, Travelli C, Ercolano E, Galli U, Roman CB, Grolla AA, Canonico PL, Condorelli F, Genazzani AA. Characterization of NAD uptake in mammalian cells. J Biol Chem. 2008;283(10):6367–6374. doi: 10.1074/jbc.M706204200. [DOI] [PubMed] [Google Scholar]
- 28.Cea M, Cagnetta A, Fulciniti M, Tai Y-T, Hideshima T, Chauhan D, Roccaro A, Sacco A, Calimeri T, Cottini F, et al. Targeting NAD+ salvage pathway induces autophagy in multiple myeloma cells via mTORC1 and extracellular signal-regulated kinase (ERK1/2) inhibition. Blood. 2012;120(17):3519–3529. doi: 10.1182/blood-2012-03-416776. [DOI] [PMC free article] [PubMed] [Google Scholar]
- 29.Beauparlant P, Bédard D, Bernier C, Chan H, Gilbert K, Goulet D, Gratton MO, Lavoie M, Roulston A, Turcotte E, et al. Preclinical development of the nicotinamide phosphoribosyl transferase inhibitor prodrug GMX1777. Anticancer Drugs. 2009;20(5):346–354. doi: 10.1097/CAD.0b013e3283287c20. [DOI] [PubMed] [Google Scholar]
- 30.Hasmann M, Schemainda I. FK866, a highly specific noncompetitive inhibitor of nicotinamide phosphoribosyltransferase, represents a novel mechanism for induction of tumor cell apoptosis. Cancer Res. 2003;63(21):7436–7442. [PubMed] [Google Scholar]
- 31.Olesen UH, Hastrup N, Sehested M. Expression patterns of nicotinamide phosphoribosyltransferase and nicotinic acid phosphoribosyltransferase in human malignant lymphomas. APMIS. 2011;119(4–5):296–303. doi: 10.1111/j.1600-0463.2011.02733.x. [DOI] [PubMed] [Google Scholar]
Associated Data
This section collects any data citations, data availability statements, or supplementary materials included in this article.