

Abstract
Objective
To prospectively investigate the longitudinal effects of continuous-flow left ventricular assist device (LVAD) unloading on myocardial structure and systolic and diastolic function.
Background
The magnitude, timeline and sustainability of changes induced by continuous-flow LVAD on the structure and function of the failing human heart are unknown.
Methods
Eighty consecutive patients with clinical characteristics consistent with chronic heart failure requiring implantation of a continuous-flow LVAD were prospectively enrolled. Serial echocardiograms (1, 2, 3, 4, 6, 9 and 12 months) and right heart catheterizations were performed after LVAD implant. Cardiac recovery was assessed on the basis of improvement in systolic and diastolic function indices on echocardiography that were sustained during LVAD turn-down studies.
Results
After 6 months of LVAD unloading, 34% of patients had a relative LVEF increase above 50% and 19% of patients, both ischemic and nonischemic, achieved an LVEF≥40%. LV systolic function improved as early as 30 days, the greatest degree of improvement was achieved by 6 months of mechanical unloading and persisted over the 1- year follow up. LV diastolic function parameters also improved as early as 30 days post LVAD unloading and this improvement persisted over time. LV end-diastolic and end-systolic volumes decreased as early as 30 days post LVAD unloading (113 vs. 77ml/m2, p<0.01 and 92 vs. 60ml/m2, p<0.01, respectively). LV mass decreased as early as 30 days post LVAD unloading (114 vs. 95g/m2, p<0.05) and continued to do so over the 1-year follow-up but did not reach values below the normal reference range suggesting no atrophic remodeling after prolonged LVAD unloading.
Conclusion
Continuous-flow LVAD unloading induced in a subset of patients, both ischemic and nonischemic, early improvement in myocardial structure and systolic and diastolic function that was largely completed within 6 months, with no evidence of subsequent regression.
Keywords: left ventricular assist device, mechanical unloading, cardiac recovery, myocardial function, myocardial structure
Introduction
Left-ventricular assist devices (LVADs) are increasingly used to ‘bridge’ end-stage heart failure (HF) patients to heart transplantation or as permanent (‘destination’) therapy (1, 2). While their utility in increasing cardiac output and reversing end-organ damage is established, there is uncertainty regarding the consequences of this intervention on myocardial structure and function. In chronic HF, cardiac remodeling is driven in large part by pressure and volume overload on the left ventricle (LV) (3). Studies performed mostly with 1st generation pulsatile LVADs suggest that mechanical unloading can result in improvement in myocardial structure and function, and some patients can be weaned from the mechanical support with sustained myocardial recovery (4-9). However, the results of these studies on LVAD-induced reverse remodeling and cardiac recovery were variable and inconclusive for several reasons we have recently summarized (10): (1) small size of studies, (2) retrospective design of most studies, (3) non-standardized monitoring of heart function during LVAD support, (4) variations in the duration of LVAD unloading, (5) drugs concurrent to LVAD therapy varied and were not documented, (6) divergences in cardiac recovery criteria/LVAD weaning criteria and (7) diversity of the populations studied with respect to propensity for cardiac recovery (extent of pre-LVAD cardiac remodeling, HF etiology, inclusion of both acute and chronic HF patients, etc.). These issues have led to skepticism as to whether pulsatile LVAD-induced myocardial recovery is a ‘real’ and consistent phenomenon or an anecdotal experience (10, 11).
The chronic mechanical circulatory support field has meanwhile shifted to 2nd generation, continuous-flow LVADs. Compared with pulsatile LVADs, these newer devices produce a qualitatively different type of unloading (10, 12-15). Large-scale trials that evaluated the clinical effectiveness of chronic continuous-flow LVAD unloading as a bridge to transplantation or destination therapy were primarily focused on morbidity, mortality and changes in end-organ function, and did not include evaluation of serial myocardial functional or structural data (1, 2, 16-18). As a consequence, the longitudinal effects on the myocardial function and structure induced by continuous-flow LVADs are largely unknown.
In this prospective study, we evaluated the effects of continuous-flow mechanical unloading on the structure and systolic and diastolic function of the failing human heart. Our aim was to derive homogeneous and comprehensive data from an LVAD population of a considerable size in order to investigate the natural history of continuous-flow mechanical unloading on the failing human heart.
Methods
A. Study population
We prospectively enrolled 90 consecutive patients with HF who required circulatory support with a continuous-flow LVAD as bridge to transplantation or destination therapy between 2008 and 2011. The patients were enrolled at the institutions comprising the Utah Transplantation Affiliated Hospitals (U.T.A.H.) Cardiac Transplant program (University of Utah Health Science Center, Intermountain Medical Center and the Veterans Administration Salt Lake City Health Care System, all in Salt Lake City, Utah).
Duration of HF history was defined as the time from HF symptoms onset to enrollment. Patients without previous history of chronic HF who required LVAD support due to acute HF (acute myocardial infarction, acute myocarditis, post cardiotomy cardiogenic shock, etc.) were not included in the current analysis (n=8). By doing so we eliminated a group of patients with a likely higher propensity for ‘natural’ cardiac recovery. Patients with infiltrative forms of heart disease, hypertrophic cardiomyopathy and HF with preserved systolic function were also excluded (n=2). The remaining 80 patients formed our study cohort. The patients were medically managed at the discretion of the physicians of the UTAH Cardiac Transplant Program. Informed consent was obtained from all patients and the study was approved by the institutional review board of the participating institutions.
B. Study procedures
Clinically relevant data, including demographics, medications, co-morbidities, and laboratory data, were collected up to 24 hours prior to LVAD implant. Right heart catheterization data were obtained within 1 week preceding LVAD implant and between 6-8 weeks after implant.
After LVAD implantation, the device speed was adjusted to achieve adequate flows (cardiac output) and LV decompression while maintaining a pulsatility index (PI) > 3.5 whenever possible (PI was calculated through the following calculation: [(maximum pump flow-minimum pump flow)/average flow] X 10 - pump flow is an estimate of blood flow through the pump based on the rotor speed and the pump power in watts). Although adjustments of LVAD speed were performed on individual basis, in general, the speed during the first 24 hours was increased under echocardiographic guidance to allow for aortic valve opening with a ratio of approximately 1:3. Subsequently and prior to discharge, LVAD speed was optimized based on patient symptoms and clinical events (e.g. suction events).
Short- and long-term complications observed during LVAD support (either related or unrelated with the LVAD therapy) were prospectively captured using the standardized Interagency Registry for Mechanically Assisted Circulatory Support (INTERMACS) definitions (19). Complications that were prospectively documented included major bleeding, hemolysis, right heart failure, cardiac arrhythmia, device malfunction, hypertension, major infection, renal dysfunction, hepatic dysfunction, respiratory failure, myocardial infarction, and neurological dysfunction.
Echocardiographic examinations were performed at the echocardiography laboratories of the participating institutions and stored digitally. The echocardiograms were performed within two weeks preceding LVAD implant, and then at months 1, 2, 3, 4, 6, 9 and 12 after implant. Per our standard clinical protocol, patients underwent post-LVAD echocardiographic examinations: a) with full support of the LVAD, i.e. at revolutions per minute (RPM) selected to provide optimal hemodynamic support, and b) with minimal LVAD support (turn-down study). The first set of echocardiographic images was obtained while the LVAD was providing full support. Subsequently, the speed of the LVAD was gradually reduced to the lowest setting recommended by the manufacturer, and a second set of echocardiographic images was obtained approximately 30 minutes later (‘turn-down study’) (20). The effectiveness of LV reloading was assessed by aortic valve opening during cardiac systole. After the completion of each echocardiographic study, the speed of the LVAD was set to the level judged by the treating HF physician as most appropriate based on the patients' symptoms and other clinical characteristics. The turn down echo studies were performed only on therapeutic INR (2.0-3.0). Turn-down echocardiographic studies were not performed in patients with a history of stroke/transient ischemic attack, LVAD thrombosis, hemolysis, difficulties in achieving optimal anticoagulation or during subtherapeutic international normalized ratio (INR).
Echocardiographic studies included complete two-dimensional, M-mode and Doppler (color, spectral and tissue) examinations. LV wall thickness, internal dimensions and their derivatives LV mass and fractional shortening were obtained from two-dimensional echocardiographic images using a previously described technique in accordance with current American Society of Echocardiography (ASE) guidelines (21). Assessment of LV volumes and LV ejection fraction (LVEF) was performed using the apical 4- and 2-chamber views. The endocardial border at both end-systole and end-diastole was manually traced; and both volumes determined using the biplane modified Simpson formula (21). Right ventricular (RV) size was evaluated by means of RV dimensions obtained at end-diastole from a RV-focused apical 4-chamber view (basal RV end-diastolic dimension) and from a parasternal long axis views (RV outflow tract). Similarly, left atrial (LA) dimensions and volumes were measured according to current ASE guidelines. Volumes, linear dimensions and LV mass were indexed to the patients' body surface area. Doppler evaluation included the assessment of mitral inflow velocities and tissue mitral annular velocities obtained from an apical 4-chamber view and using pulsed-wave Doppler. For the evaluation of tissue annular velocities the sample volume was positioned at or 1 cm within the septal and lateral insertion sites of the mitral valve leaflets to cover the longitudinal excursion of the mitral annulus in both systole and diastole. Spectral Doppler assessment of the mitral inflow velocities and annular tissue velocities was carried out at sweep speeds of 50 to 100 mm/s at end-expiration and the measurements were an average of ≥3 consecutive cardiac cycles. Mitral inflow parameters evaluated included early mitral inflow velocity (E wave), late or atrial mitral inflow velocity (a wave) and E wave deceleration time (EDT). Tissue Doppler mitral annular velocities included early diastolic annular velocity (E′) and late diastolic annular velocity (a′). These measurements were performed in accordance with current ASE guidelines (21, 22). Echocardiographic contrast was used when studies were technically difficult. The assessment of mitral and aortic valve regurgitation severity was performed by means of color Doppler techniques and based on current guidelines. The severity of mitral regurgitation was evaluated using the color flow jet area, and classified in mild (<20% of LA area), moderate (20-40% of LA area) and severe (>40% of LA area). Aortic regurgitation severity was assessed by the color jet to LV outflow tract width ratio, and classified as mild (<25%), moderate (25-64%) and severe (≥65%).
C. Intraobserver and interobserver variability
All the echocardiograms were interpreted by two independent readers [OWP, SGD]. In order to evaluate the reliability of our measurements, interobserver and intraobserver variability was tested in both of our readers. To assess intraobserver variability one of the two readers performed echocardiographic measurements in 10 randomly selected patients in two different occasions at least two weeks apart. Interobserver variability among our two readers was tested by the independent evaluation of ten randomly selected patients. By means of the Pearson correlation, there was an excellent correlation among both readers (r=0.98, p<0.0001). Intraobserver and interobserver agreement, evaluated by means of intraclass correlation coefficients, was excellent for the echocardiographic parameters tested, with intraclass correlation coefficients of 0.99 (95% CI0.99-0.99, p<0.0010 and 0.98 (95% CI 0.98-0.99, p<0.001), respectively.
D. Statistical analysis
Data were summarized using standard statistical descriptors such as frequencies, percentages, means, standard deviations, medians and percentiles. Categorical variables were compared by the Pearson χ2 test or Fisher exact test. As the continuous covariates were frequently not normally distributed, we decided to present the results as a median and with percentiles (25th percentile, 75th percentile) and to compare the distributions using a nonparametric test, such as the Kruskal Wallis test, followed by post-hoc pairwise comparison by Dunn's test. Wilcoxon matched-pairs signed-rank test was used when appropriate. Changes of select functional and structural parameters over time were depicted using means and confidence intervals. Two-tailed p<0.05 was considered statistically significant. All analyses were performed using STATA software, version 12 (StataCorp LP, College Station, TX, USA).
Results
Patient characteristics and medications
The patient baseline characteristics at the time of LVAD implantation are shown in Table 1. The prospective design of our study allowed us to carefully evaluate the candidates and to exclude patients with acute HF. Patients in our study had a median duration of HF of over five years, LV dilatation and a mean LVEF of 18% (median 16%): all characteristics consistent with chronic end stage HF. Medications used during LVAD support included renin-angiotensin-aldosterone axis inhibitors (n=32, 40%), beta adrenergic blockers (n=25, 31%), loop diuretics (n= 62, 78%), nitrates/hydralazine (n=17, 21%), calcium channel blockers (n=16, 20%), aspirin (n=77, 96%), clopidogrel (n=4, 5%), warfarin (n=78, 98%).
Table 1.
Patient Characteristics Pre-LVAD Implantation
| Age, years | 60 [51, 68] |
| Male | 64 (80%) |
| Body mass index, Kg/m2 | 27 [24, 32] |
| Diabetes mellitus | 22 (28%) |
| Hypertension | 33 (41%) |
| Chronic HF etiology | |
| Idiopathic CMP | 37 (46%) |
| Ischemic CMP | 34 (43%) |
| Valvular CMP | 5 (6%) |
| Chemotherapy CMP | 3 (4%) |
| Peripartum CMP | 1 (1%) |
| Duration of HF symptoms, years | 5.5 [1,10] |
| NYHA functional class | |
| III | 29 (36%) |
| IV | 51 (64%) |
| LVEF,% | 16 [13, 23] |
| LVEDD, cm | 6.6 [5.8, 7.3] |
| Cardiac index, L/(min· m2) | 1.7 [1.4, 2.0] |
| IABP/Centrimag/ECMO | 8 (10%) |
| Inotrope dependence | 56 (70%) |
| INTERMACS profile | |
| 1 | 9 (11%) |
| 2 | 12 (15%) |
| 3 | 39 (49%) |
| 4 | 16 (20%) |
| 5 | 3 (4%) |
| 6 | 1 (1%) |
| LVAD indication | |
| BTT | 52 (65%) |
| BTD | 3 (4%) |
| DT | 25 (31%) |
BTD=bridge to decision; BTT=bridge to transplant; CMP= cardiomyopathy; DT=destination therapy; ECMO=extracorporeal membrane oxygenator; HF=heart failure; IABP=intra-aortic balloon pump; LVEDD=left ventricular end diastolic diameter; LVEF=left ventricular ejection fraction; NYHA=New York Heart Association; INTERMACS=Interagency Registry for Mechanically Assisted Circulatory Support.
Values are expressed as n (%) or median [25th, 75th percentiles].
Hemodynamic and biochemical data
Table 2 shows invasive and non-invasive hemodynamic data and biochemical data before and after LVAD unloading. As expected, LVAD therapy resulted in significant increase in cardiac output and a decrease in filling pressures, pulmonary arterial pressures and pulmonary vascular resistance. We noted an increase in serum sodium, decrease in serum BUN and creatinine, and decrease in serum hemoglobin and total bilirubin after LVAD implant.
Table 2.
Hemodynamic and Biochemical Profile Before and After LVAD Unloading
| Hemodynamics | Pre-LVAD | Post-LVAD | p-value |
|---|---|---|---|
| Mean BP, mm Hg | 79 [74, 86] | 89 [81, 99]* | 0.0001 |
| HR, beats/min | 94 [84, 112] | 88 [80, 99] | 0.02 |
| RAP, mm Hg | 14 [9, 18] | 8 [4, 10] | 0.0008 |
| PCWP, mm Hg | 28 [23, 30] | 13 [9, 19] | <0.0001 |
| PASP, mm Hg | 55 [44, 64] | 32 [26, 41] | <0.0001 |
| PADP, mm Hg | 27 [24, 32] | 14 [11, 18] | <0.0001 |
| Mean PAP, mm Hg | 38 [31, 43] | 21 [17, 27] | <0.0001 |
| PVR, Woods units | 3.0 [1.9, 4.7] | 1.8 [1.2, 2.2] | 0.0007 |
| Cardiac index, L/(min· m2) | 1.7 [1.5, 2.0] | 2.4 [2.1, 2.8] | 0.0001 |
| Biochemical | |||
| Serum sodium, mEq/L | 135 [132, 138] | 138 [136, 140] | <0.0001 |
| Serum BUN, mg/dl | 28 [20, 38] | 20 [15, 29] | 0.0001 |
| Serum creatinine, mg/dl | 1.3 [1.0, 1.7] | 1.1 [0.9, 1.4] | 0.02 |
| Serum bilirubin, mg/dl | 1.2 [0.7, 1.6] | 0.8 [0.5, 1.2] | 0.03 |
| Serum hemoglobin, g/dl | 12.5 [11, 14] | 11.6 [10, 13] | <0.0001 |
| Platelet count, 109/L | 182 [144, 236] | 207 [152, 288] | 0.03 |
BP= blood pressure; BUN=blood urea nitrogen; HR=heart rate; PADP=pulmonary artery diastolic pressure; PAP=pulmonary artery pressure; PASP=pulmonary artery systolic pressure; PCWP=pulmonary capillary wedge pressure; PVR=pulmonary vascular resistance; RAP=right atrial pressure. Values are expressed as median [25th, 75th percentiles].
The post-LVAD blood pressure is an approximate systolic/mean blood pressure due to the continuous-flow of the LVAD.
Serial Effects on LV Structure and Systolic Function
Echocardiographic parameters were obtained before and then serially after LVAD implantation -Table 3, Figure 1. The magnitude of systolic functional response during continuous-flow LVAD unloading was diverse. Overall, LVEF increased from 17% (14%, 23%) at the time of LVAD implant to 25% (18%, 33%) six months later (p<0.01) (Table 3, Figure 1). In 19% of the patients, the LVEF improved to ≥ 40% (Table 3). The LV end-diastolic and end-systolic volumes decreased significantly as early as 30 days after LVAD implantation. LV mass decreased as early as 30 days post LVAD unloading from 114g/m2 (93 g/m2, 146 g/m2) to 95g/m2 (71g/m2, 114 g/m2), p<0.05 and continued to do so progressively over the 1-year follow-up but notably, this decrease was not beyond the normal reference range (43-115 g/m2) (21).
Table 3.
Serial Echocardiographic Assessment of the Effects of LVAD Unloading on Myocardial Structure and Systolic Function
| Parameter | Pre LVAD (n=80) |
30 Days (n=68) |
60 Days (n=44) |
90 Days (n=47) |
120 Days (n=37) |
180 Days (n=32) |
270 Days (n=24) |
365 Days (n=20) |
|---|---|---|---|---|---|---|---|---|
| LVEDDI, cm/m2 | 3.2 [2.9, 3.6] | 2.8 [2.3, 3.2]* | 2.9 [2.5, 3.2]† | 2.9 [2.4, 3.4]† | 2.8 [2.4, 3.3]† | 2.8 [2.2, 3.4]† | 2.6 [2.2, 3.1]* | 2.6 [2.2, 3.0]* |
| LVESDI, cm/m2 | 3.0 [2.6, 3.3] | 2.6 [2.0, 3.1]* | 2.6 [2.2, 3.0] | 2.6 [2.1, 3.1] | 2.5 [2.1, 3.0]† | 2.5 [1.8, 2.9]* | 2.2 [1.8, 2.8]* | 2.3 [1.9, 2.8]* |
| FS, % | 8.3 [4.2, 13.5] | 8.2 [5.2, 12.9] | 8.5 [6.2, 12.3] | 7.1 [4.3, 14.3] | 10.5 [5.1, 17.8] | 12.5 [6.4, 19.1] | 13.4 [5.3, 20.4] | 9.3 [5.3, 20.4] |
| IVSd, cm | 0.84 [0.68, 1.1] | 0.90 [0.70, 1.10] | 0.93 [0.74, 1.16] | 0.85 [0.73, 1.05] | 0.96 [0.80, 1.15] | 0.94 [0.81, 1.19] | 0.94 [0.71, 1.16] | 0.80 [0.66, 1.10] |
| IVSs, cm | 1.01 [0.82, 1.22] | 1.10 [0.89, 1.27] | 1.06 [0.86, 1.23] | 1.10 [0.87, 1.23] | 1.13 [0.88, 1.25] | 1.15 [1.00, 1.30] | 1.10 [0.86, 1.20] | 0.97 [0.79, 1.20] |
| PWd, cm | 0.84 [0.70, 1.00] | 0.87 [0.70, 1.03] | 0.90 [0.71, 1.02] | 0.83 [0.66, 0.95] | 0.81 [0.72, 0.96] | 0.92 [0.83, 1.05] | 0.79 [0.70, 0.92] | 0.77 [0.71, 0.87] |
| PWs, cm | 0.98 [0.79, 1.22] | 1.02 [0.86, 1.21] | 1.05 [0.90, 1.20] | 1.00 [0.88, 1.15] | 1.10 [0.90, 1.20] | 1.09 [0.94, 1.20] | 1.02 [0.80, 1.14] | 0.97 [0.84, 1.15] |
| LV mass, g/m2 | 114 [93, 146] | 95 [71, 114]† | 100 [82, 122] | 92 [63, 118]† | 88 [68, 124] | 111 [74, 134] | 92 [52, 106]* | 77 [50, 104]* |
| LVEDVI, ml/m2 | 113 [94, 141] | 77 [54, 109]* | 76 [64, 100]* | 86 [62, 106]* | 82 [61, 110]* | 86 [52, 108]* | 71 [44, 92]* | 69 [45, 93]* |
| LVESVI, ml/m2 | 92 [74, 116] | 60 [42, 88]* | 60 [46, 81]* | 71 [48, 144]† | 66 [40, 92]* | 64 [35, 90]* | 54 [28, 76]* | 56 [31, 75]* |
| LVEF, % | 17 [14, 23] | 20 [15, 30] | 20 [15, 30] | 20 [14, 26] | 20 [15, 30] | 25 [18, 33]* | 25 [17, 36]† | 22 [15, 31] |
| LVEF≥40% | 0% | 7.4% | 9.1% | 10.6% | 10.8% | 18.8% | 20.8% | 10% |
| RVEDD, cm | 4.4 [3.9, 5.2] | 4.3 [3.5, 5.0] | 4.4 [3.5, 4.9] | 4.4 [4.0, 4.9] | 4.2 [3.7, 4.6] | 4.2 [3.9, 4.6] | 4.0 [3.3, 4.6] | 4.8 [3.5, 5.2] |
| RVOTd, cm | 3.9 [3.4, 4.3] | 3.7 [3.1, 4.1] | 3.6 [3.3, 4.2] | 3.7 [3.3, 4.3] | 3.6 [3.2, 3.8] | 3.7 [3.1, 3.9] | 3.5 [3.1, 4.0] | 3.8 [3.5, 4.1] |
| MR | ||||||||
| - mild | 34 (42%) | 33 (48%) | 18 (41%) | 21 (45%) | 14 (38%) | 15 (47%) | 11 (46%) | 9 (45%) |
| - moderate | 20 (25%) | 4 (6%) | 2 (4.5%) | 2 (4.2%) | 3 (8%) | 2 (6%) | 1 (4%) | 3 (15%) |
| - severe | 16 (20%) | 1 (1.5%) | 4 (9%) | 1 (2%) | 1 (3%) | 2 (6%) | 0 | 2 (10%) |
| AI | ||||||||
| - mild | 11 (14%) | 22 (32%) | 15 (34%) | 16 (34%) | 13 (35%) | 11 (34%) | 13 (54%) | 10 (50%) |
| - moderate | 1 (1.2%) | 1 (1.5%) | 1 (2.3%) | 2 (4%) | 2 (5%) | 5 (16%) | 1 (4%)* | 3 (15%) |
| - severe | 0 | 0 | 0 | 0 | 0 | 0 | 0 | 1 (5%) |
AI=Aortic insufficiency; FS=fractional shortening; IVSd=interventricular septum at end-diastole; IVSs= interventricular septum at end-systole; LVEDDI= left ventricular end-diastolic dimension index; LVEDVI= left ventricular end-diastolic volume index; LVEF= left ventricular ejection fraction; LVESDI=left ventricular end-systolic dimension index; LVESVI= left ventricular end-systolic volume index; MR: mitral regurgitation; PWd=posterior wall dimension at end-diastole; PWs= posterior wall dimension at end-systole; RVEDD=right ventricular end diastolic dimension; RVOTd=right ventricular outflow tract dimension at end diastole. Values are expressed as n (%) or median [25th, 75th percentiles]
p<0.01 vs. Pre LVAD
p<0.05 vs. Pre LVAD
Figure 1. Serial echocardiographic changes.
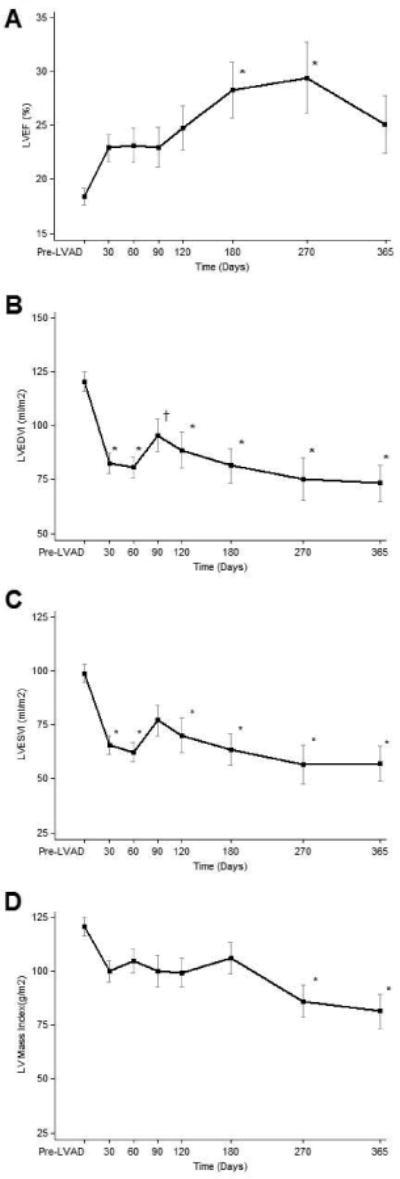
LVEDVI (left ventricular end diastolic volume index), LVEF (left ventricular ejection fraction), LVESVI (left ventricular end systolic volume index). Data is presented as means and confidence intervals, *p<0.01 vs. Pre LVAD; †p<0.05 vs. Pre LVAD.
The relative increase in LVEF, defined as ‘pre-LVAD to highest LVEF achieved post-LVAD’, is shown In Figure 2, panel A. Based on this relative functional response we identified 4 groups of patients: group 1: LVEF relative increase <25%, n= 38 (47%), group 2: LVEF relative increase 25-50%, n= 15 (19%), group 3: LVEF relative increase 51-99%, n= 18 (23%), and group 4: LVEF relative increase ≥ 100%, n= 9 (11%). The changes in LVEF over time for patients with a relative increase in LVEF of 51-99% (group 3) and ≥ 100% (group 4) are shown in Figure 2, panels B and C. As shown, the greatest systolic function improvement was achieved within 6 months after LVAD implant, with little if any further improvement at later time points.
Figure 2. Relative increase in left ventricular ejection fraction (LVEF) defined as ‘pre-LVAD to highest LVEF post-LVAD’.
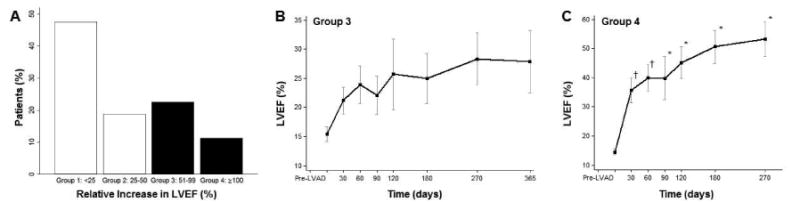
Data is presented as percentages, means and confidence intervals, *p<0.01 vs. Pre LVAD; †p<0.05 vs. Pre LVAD.
The diversity of the systolic functional response to continuous-flow LVAD unloading is shown in Panel A of Figure 3, in which patients were stratified based on the ‘highest LVEF achieved’ post LVAD unloading. We identified 4 groups of patients: group 1: LVEF <20%, n= 26 (33%), group 2: LVEF 20-29%, n= 25 (31%), group 3: LVEF 30-39%, n= 20 (25%), and group 4: LVEF ≥ 40%, n= 9 (11%). Again, we focused on the patients with greater functional improvement (i.e. groups 3 and 4). As shown in Panels B and C of Figure 3, the greatest systolic functional improvement post LVAD unloading is again achieved within 6 months after the initiation of this therapy.
Figure 3. Highest left ventricular ejection fraction (LVEF) achieved after LVAD unloading.
Data is presented as percentages, means and confidence intervals, *p<0.01 vs. Pre LVAD.
Echocardiographic parameters were also recorded during serial turn-down echocardiograms. Decrease of the LVAD speed resulted in reduced flow through the LVAD and increased LV loading. The increased loading was confirmed by our assessment of aortic valve opening during the turn-down echocardiographic studies. During the regular full LVAD support the aortic valve opened rarely while during the LVAD turn-down exams, the aortic valve opened with every beat (data not shown). The improvement in LV structure and systolic function was sustained under the increased loading conditions during turn-down echocardiographic studies and is described in detail in Table 1 of the online-only Data Supplement. The turn-down studies were well tolerated by most patients; transient mild HF symptoms were documented in less than 3% of the studies and the symptoms were alleviated soon after increasing the LVAD speed back to full support.
We carried out a separate analysis on the subset of LVAD patients who completed 6 months of LVAD unloading, excluding patients with shorter duration of support that could have been considered inadequate to attest the full effects of mechanical unloading. The effects of LVAD unloading on ‘relative increase of LVEF’ and on the ‘highest LVEF achieved’ for this subset of patients (Figures 1 and 2 of the online-only Data Supplement, respectively) were comparable to the findings shown in Figures 2 and 3 for the whole study population.
Characteristics of Patients with Greater Systolic Functional Response
In patients with greater functional improvement (i.e. Groups 3 and 4 vs. Groups 1 and 2 of Figure 3) there was a non-significant trend for younger age (median age in Group 1: 61 (range: 26-76) years, Group 2: 60 (range: 20-81) years, Group 3: 58 (range: 15-79) years, Group 4: 48 (range: 13-74), p=ns) and shorter duration of HF history (median duration in Group 1: 5 years, Group 2: 6 years, Group 3: 6.5 years, Group 4: 1 year, p=ns). The proportion of patients with ischemic and non-ischemic cardiomyopathy was 27% and 73% in Group 1, 52% and 48% in Group 2, 55% and 45% in Group 3 and 33% and 67% in Group 4, respectively. Therefore, LVAD induced functional improvement was not exclusive to patients with non-ischemic cardiomyopathy.
The distribution of medications with direct effects on cardiac remodeling (e.g. renin-angiotensin-aldosterone axis inhibitors and beta adrenergic receptor antagonists) was similar among the identified four groups of LVAD-induced systolic function response. Various complications during LVAD support (major bleeding, hemolysis, right heart failure, cardiac arrhythmia, device malfunction, hypertension, major infection, myocardial infarction, renal dysfunction, et al. - as defined by INTERMACS and prospectively documented per our study design) that could affect the potential for myocardial recovery were also similar among these four subgroups of patients.
Serial Effects on LV Diastolic Function
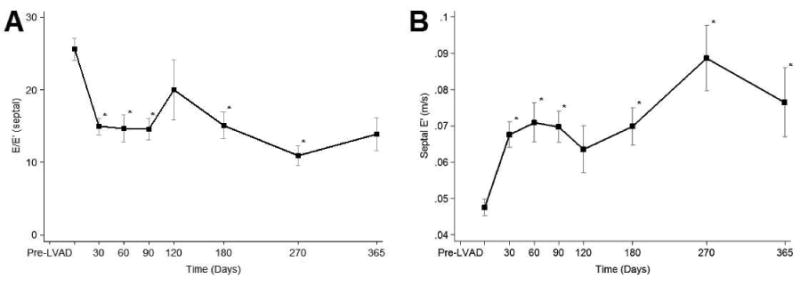
As shown in Table 4 we found significant and sustained improvement post LVAD unloading in several parameters of diastolic function. Specifically, LA size, EDT, septal E′ and E wave to E′ ratio significantly improved as early as 30 days post LVAD unloading, and this improvement persisted over time (Figure 4). Post LVAD improvements in LV diastolic function were sustained under increased loading conditions induced during serial turn-down echocardiographic studies (Table 2 of the online-only Data Supplement)
Table 4.
Serial Echocardiographic Assessment of the Effects of LVAD Unloading on Left Ventricular Diastolic Function
| Parameter | Pre LVAD (n=80) |
30 Days (n=70) |
60 Days (n=41) |
90 Days (n=48) |
120 Days (n=37) |
180 Days (n=32) |
270 Days (n=24) |
365 Days (n=20) |
|---|---|---|---|---|---|---|---|---|
| LADI, cm/m2 | 2.3 [2.2, 2.6] | 2.0 [1.9, 2.4]* | 2.1 [1.8, 2.4]* | 2.0 [1.8, 2.4]* | 2.0 [1.8, 2.5]* | 2.2 [1.7, 2.5] | 2.1 [1.9, 2.4] | 1.9 [1.8, 2.3]* |
| LAVI, ml/m2 | 46 [35, 54] | 28 [22, 36]* | 32 [22, 39]* | 32 [23, 38]* | 32 [25, 42]* | 25 [19, 39]* | 32 [24, 39]* | 28 [18, 38]* |
| E wave, m/s | 1.0 [0.8, 1.1] | 0.8 [0.6, 1.0]* | 0.8 [0.7, 1.0] | 0.8 [0.7, 1.0] | 0.8 [0.6, 1.1] | 0.8 [0.7, 1.1] | 0.8 [0.7, 1.0] | 1.0 [0.6, 1.2] |
| A wave, m/s | 0.3 [0.2, 0.5] | 0.4 [0.3, 0.6] | 0.4 [0.3, 0.6] | 0.5 [0.3, 0.8]† | 0.6 [0.4, 0.7]† | 0.5 [0.4, 0.7]† | 0.6 [0.3, 0.6] | 0.6 [0.4, 0.7] |
| EDT, ms | 133 [112, 165] | 175 [137, 220]* | 189 [150, 200]* | 178 [141, 212]* | 206 [155, 230]* | 172 [121, 220]* | 200 [167, 220]* | 170 [157, 225] |
| E/A ratio | 2.8 [2.1, 4.1] | 2.2 [1.2, 3.6] | 1.8 [1.0, 3.1] | 1.5 [1.0, 2.9]* | 1.6 [0.8, 2.3]* | 1.6 [1.3, 2.2]† | 1.6 [1.1, 2.8]† | 1.7 [1.0, 3.3] |
| E′ (l) wave, m/s | 0.08 [0.05, 0.11] | 0.09 [0.07, 0.10] | 0.11 [0.09, 0.12]† | 0.09 [0.06, 0.11] | 0.09 [0.05, 0.12] | 0.10 [0.07, 0.13] | 0.13 [0.09, 0.15]† | 0.12 [0.08, 0.12] |
| A′ (l) wave, m/s | 0.04 [0.03, 0.06] | 0.05 [0.04, 0.08] | 0.06 [0.04, 0.09] | 0.07 [0.04, 0.09] | 0.06 [0.04, 0.07] | 0.06 [0.03, 0.10] | 0.09 [0.06, 0.11]† | 0.09 [0.06, 0.10] |
| E/E′ (l) | 14 [9, 19] | 9 [6, 13]† | 8 [7, 10]* | 10 [6, 12] | 9 [7, 15] | 9 [7, 13] | 7 [5, 8]* | 10 [6, 11] |
| E′ (s) wave, m/s | 0.04 [0.03, 0.06] | 0.06 [0.05, 0.09]* | 0.07 [0.05, 0.09]* | 0.07 [0.05, 0.09]* | 0.07 [0.04, 0.08] | 0.07 [0.04, 0.09]* | 0.08 [0.06, 0.13]* | 0.07 [0.06, 0.10]† |
| A′ (s) wave, m/s | 0.04 [0.03, 0.06] | 0.04 [0.03, | 0.06 [0.04, 0.07] | 0.06 [0.03, 0.07] | 0.05 [0.03, 0.07] | 0.05 [0.02, 0.09] | 0.07 [0.05, 0.09]† | 0.07 [0.05, 0.10] |
| E/E′ (s) | 23 [16, 30] | 13 [9, 19]* | 11 [10, 15]* | 12 [9, 16]* | 14 [9, 19]† | 12 [9, 19]* | 10 [6, 14]* | 15 [7, 17]† |
A=mitral valve inflow atrial velocity; A′= late diastolic motion of the mitral annulus at the (l) lateral and (s) septal positions; E=mitral valve inflow early velocity; E′= early diastolic motion of the mitral annulus at the (l) lateral and (s) septal positions; EDT=E wave deceleration time; LADI=left atrial dimension index; LAVI=left atrial volume index; Values are expressed as median [25th, 75th percentiles]. For between-group comparisons:
p<0.01 vs. Pre LVAD
p<0.05 vs. Pre LVAD.
Figure 4. Serial changes on diastolic function echocardiographic parameters.

E=mitral valve inflow early velocity, E′= early diastolic motion of the mitral annulus. Data is presented as means and confidence intervals, *p<0.01 vs. Pre LVAD.
Discussion
This single-program, prospective study of a large cohort of LVAD patients demonstrates that continuous-flow mechanical unloading of the failing human heart results in significant changes at the structural, hemodynamic and functional levels. The study was designed to investigate these changes serially and under both decreased and renewed loading conditions induced by turn-down echocardiographic studies.
Diversity of myocardial changes
The magnitude of the LVAD-induced functional changes was diverse, while hemodynamic changes were more uniform. This diversity in systolic functional response is in agreement with data from studies of first generation LVADs (4-10, 23-27) and may reflect the diversity of the population studied in their propensity for myocardial functional recovery (HF etiology: acute vs. chronic HF and ischemic vs. non ischemic HF, extent of pre-LVAD pathologic and molecular myocardial remodeling, etc.) and differences in medical therapy added to LVAD therapy (10). The latter is a limitation of our study as well. However, the distribution of medications with direct effects on cardiac remodeling (e.g. renin-angiotensin-aldosterone axis inhibitors, beta blockers) was found to be comparable between the identified four groups of LVAD- induced systolic function response.
Our data also show that myocardial functional recovery after LVAD unloading is not an all-or-nothing phenomenon. Specifically, a subset of end-stage chronic HF patients had a marked improvement of their systolic heart function (i.e. 19% of patients that completed 6 months of mechanical unloading had an ≥ LVEF 40%) while another subset of patients showed improvement to a degree similar to that of stable HF outpatients (i.e. ‘partial recovery’: group 3 of Figure 3 and Supplemental Figure 2). The patients with greater functional improvement after LVAD unloading tended to be younger (5, 28) and with shorter duration of HF (5, 6, 28) but the correlation of age and duration of HF with recovery did not reach statistical significance. The small numbers of patients in these groups prevented us from conducting a subgroup analysis. Larger scale studies are needed in order to draw solid conclusions on these issues.
Importantly, the RV size as assessed by means of RV dimensions obtained at end-diastole from a RV-focused apical 4-chamber view (basal RV end-diastolic dimension) and from a parasternal long axis views (RV outflow tract) was found neither to improve nor deteriorate after chronic LVAD unloading. Regarding valvular abnormalities the incidence of moderate and severe mitral regurgitation significantly improved after LVAD unloading. However, consistent with other recent reports, we observed an increase in the incidence of mild and moderate aortic insufficiency. Given the relatively short duration of our study we cannot derive solid conclusion on the effects of chronic LVAD unloading on the aortic valve.
Impact of HF etiology
The impact of HF etiology on the prospect of reverse remodeling and myocardial recovery with mechanical unloading requires further investigation. In our study we excluded patients with acute HF, a group of patients that could confound our findings given that is more prone to myocardial recovery without any specific disease-modifying intervention. Furthermore, it has been proposed that the patients most likely to show reverse remodeling and myocardial recovery induced by LVAD unloading are those with non-ischemic cardiomyopathy (5, 6). However, ischemic cardiomyopathy patients with large areas of non-infarcted myocardium that ‘remodeled’ over the years could also be considered candidates for reverse remodelling and myocardial recovery (10, 29). Often these patients were discharged after their index acute myocardial infarction with a preserved LVEF and no symptoms of HF to come back later with severely impaired LV systolic function and overt HF due to remodeling of the non-infarcted regions of their myocardium (29). Notably, groups 3 and 4 of Figure 3 (i.e. the patients with the greater functional improvement) included high percentages of ischemic cardiomyopathy patients (55% and 33%, respectively). Probably the concept of myocardial recovery in ischemic cardiomyopathy patients deserves further investigation in larger scale studies. This approach could combine the excision of scarred myocardium, using LV reconstruction techniques, with LVAD unloading (10, 29). It can be argued that with this latter approach the initial insult that triggered the cascade of cardiac remodeling progression – i.e. the post-myocardial infarction scar, would be eliminated (10, 29). In contrast, in most non-ischemic cardiomyopathy patients, the initial insult that caused progressive ventricular remodeling and HF often remains undetermined, most likely persists despite an initially successful reversal of the process by mechanical unloading, and might recur and cause further progression of HF after the termination of LVAD support (10, 29). This may explain why long-term freedom from recurrent HF in the largest bridge to recovery series in non-ischemic cardiomyopathy patients was 74% and 66% at 3 and 5 years, respectively (5).
Impact of duration of mechanical unloading: myocardial recovery vs. atrophy
In our study, improvements in LV systolic and diastolic function were incremental, with the greatest degree of improvement being achieved within 6 months after LVAD implant. This finding may provide useful guidance to the design of future bridge-to-recovery LVAD studies. In addition, this finding suggests that an advanced HF patient without any signs of significant functional improvement during the first few months of LVAD unloading is not likely to show significant improvement subsequently. Given the long-term outcomes of heart transplantation (30), and the higher likelihood of LVAD induced recovery in young HF patients (5, 28), a 6-month ‘LVAD challenge’ before transplant candidacy might be a reasonable option for programs that are already investigating ways to improve the long-term outcomes of their younger patients by saving the transplant therapeutic option for a later stage.
Another issue is the durability of LVAD induced cardiac improvement. Data from the pulsatile LVAD era indicated that prolonged mechanical unloading might be associated with an initial phase of functional improvement followed by a later phase of deterioration. Specifically, the LVAD Working Group found in a multicenter study that pulsatile LVADs induced significant improvement in LVEF after 30 days of support that progressively decreased to pre-LVAD measurement at 120 days (4). So far, this is the largest prospective study (n=67, predominantly bridge to transplant patients) reporting on the LVAD unloading effects on myocardial function and structure (4). In our study of 80 continuous-flow LVAD patients, we found no decrease in LV function with long-term mechanical unloading, but the number of patients studied at long-term follow-up points was relatively low. This apparent advantage of continuous- flow mechanical unloading warrants further investigation with larger and longer-term studies.
A long-standing question, directly related to the aforementioned discussion about the sustainability of LVAD induced cardiac improvement, is whether prolonged LVAD unloading induces regression of cardiac hypertrophy to the point of atrophy and degeneration. Animal models of unloading of nonfailing/nonhypertrophic myocardium by means of heterotopic transplantation (31) or LVAD (32) suggested that prolonged mechanical unloading could lead to cardiac myocyte atrophy. Whether this phenomenon applies exclusively to unloaded nonfailing and nonhypertrophic, or also to hypertrophic and failing myocardium is controversial (6, 9, 33, 34). We show that LV mass did decrease with continuous-flow LVAD unloading, but remained within the normal reference range (21). Therefore, neither the structural nor the functional findings of our study suggest hypertrophy regression to the point of atrophy and degeneration. This is in agreement with histological, ultrastructural (electron microscopy), metabolic and molecular data we have recently presented (35).
LV loading conditions
Finally, an important issue is whether the systolic and diastolic functional changes we described would be sustained with discontinuation of mechanical unloading. The protocol to induce increased loading conditions on the LV used in our study is similar to published protocols used in bridge to recovery LVAD studies that led to sustained myocardial recovery post-LVAD explantation (6, 9, 20). An indirect way we used to confirm that the turn-down studies were effectively increasing the loading conditions on the myocardium was the continuous assessment of aortic valve opening. We confirmed that during our turn-down studies aortic valve opening occurred with each ventricular systole as opposed to very rare or no aortic valve opening at all during the regular full LVAD support. However, the ideal duration of a turn-down echocardiographic study in order to reliably evaluate the ‘underlying’ functional capacity of the LVAD supported native heart is not known. Consequently, whether the changes observed in our study predict the native heart's functional capabilities after an eventual LVAD explantation requires further investigation. Independent of this limitation, the fact that end-stage human failing hearts undergoing a mechanical unloading intervention substantially improved (and importantly, other hearts similarly sick undergoing the same intervention did not; i.e. responders and non-responders) invites for in depth translational and basic science research efforts to shed light into these differential functional responses, regardless of their eventual sustainability. This research could offer an important opportunity to understand the human heart's potential to respond to severe injury and recover function.
In conclusion, continuous-flow LVAD unloading induced in a subset of patients, both ischemic and nonischemic, early improvement in myocardial structure and systolic and diastolic function that was mostly completed within 6 months and with no evidence of regression subsequently. These new insights into the degree and time course of the induced myocardial improvement could be useful in guiding future research in the field of mechanical unloading and cardiac recovery.
Supplementary Material
Acknowledgments
Founding sources: This work was funded by grants from:
National Heart, Lung, and Blood Institute (NHLBI), National Institute of Allergy and Infectious Diseases (NIAID), Juvenile Diabetes Research Foundation, HA and Edna Benning Foundation, National Center for Research Resources Public Health Services research grant UL1-RR025764, and the Department of Defense (to Dr. Li).
European Union – Research Executive Agency (REA)/Seventh Framework Programme (FP7) – Marie Curie - #276776 (to Dr. Drakos)
NIH National Center for Research Resources (NCRR) grant that supports the Center Clinical Translational Sciences (CCTS) UL1-RR025764 and C06-RR11234 (to Drs. Drakos & Kfoury)
VA Merit Review Award, Clinical Science Research & Development / 1I01CX000710-01A1 (to Drs. Stehlik and Drakos)
Deseret Foundation #00571 (to Drs. Drakos & Kfoury)
American Heart Association #09CRP2050127 (to Dr. Stehlik)
4R01 HL089592-03 (to Dr Selzman)
United States Department of Veterans Affairs (to Dr Movsesian)
Foundation Leducq 06 CVD 02 (to Dr Movsesian)
VA Merit Review Award, Clinical Science Research & Development / 1I01CX000710-01A1 (to Drs. Stehlik and Drakos)
Abbreviationsand Acronyms
- ASE
American Society of Echocardiography
- EDT
E wave deceleration time
- HF
Heart failure
- INTERMACS
Interagency Registry for Mechanically Assisted Circulatory Support
- INR
International normalized ratio
- LA
Left atrium
- LV
Left ventricle
- LVAD
Left ventricular assist device
- LVEF
Left ventricular ejection fraction
- RPM
Revolutions per minute
- RV
Right ventricle
Footnotes
Publisher's Disclaimer: This is a PDF file of an unedited manuscript that has been accepted for publication. As a service to our customers we are providing this early version of the manuscript. The manuscript will undergo copyediting, typesetting, and review of the resulting proof before it is published in its final citable form. Please note that during the production process errors may be discovered which could affect the content, and all legal disclaimers that apply to the journal pertain.
None of the authors involved in this study has any relationship with industry to disclose.
References
- 1.Starling RC, Naka Y, Boyle AJ, et al. Results of the post-U.S. Food and Drug Administration-approval study with a continuous-flow left ventricular assist device as a bridge to heart transplantation: a prospective study using the INTERMACS. J Am Coll Cardiol. 2011;57:1890–1898. doi: 10.1016/j.jacc.2010.10.062. [DOI] [PubMed] [Google Scholar]
- 2.Slaughter MS, Rogers JG, Milano CA, et al. Advanced heart failure treated with continuous-flow left ventricular assist device. N Engl J Med. 2009;361:2241–2251. doi: 10.1056/NEJMoa0909938. [DOI] [PubMed] [Google Scholar]
- 3.Katz AM. Maladaptive growth in the failing heart: the cardiomyopathy of overload. Cardiovasc Drugs Ther. 2002;16:245–249. doi: 10.1023/a:1020604623427. [DOI] [PubMed] [Google Scholar]
- 4.Maybaum S, Mancini D, Xydas S, et al. Cardiac improvement during mechanical circulatory support: a prospective multicenter study of the LVAD working group. Circulation. 2007;115:2497–2505. doi: 10.1161/CIRCULATIONAHA.106.633180. [DOI] [PubMed] [Google Scholar]
- 5.Dandel M, Weng Y, Siniawski H, et al. Pre-explant stability of unloading-promoted cardiac improvement predicts outcome after weaning from ventricular assist devices. Circulation. 2012;126(11 Suppl 1):S9–19. doi: 10.1161/CIRCULATIONAHA.111.084640. [DOI] [PubMed] [Google Scholar]
- 6.Birks EJ, Tansley PD, Hardy J, et al. Left ventricular assist device and drug therapy for the reversal of heart failure. N Engl J Med. 2006;355:1873–1884. doi: 10.1056/NEJMoa053063. [DOI] [PubMed] [Google Scholar]
- 7.Liden H, Karason K, Bergh CH, Nilsson F, Koul B, Wiklund L. The feasibility of left ventricular mechanical support as a bridge to cardiac recovery. Eur J Heart Fail. 2007;9:525–530. doi: 10.1016/j.ejheart.2006.12.003. [DOI] [PubMed] [Google Scholar]
- 8.Simon MA, Primack BA, Teuteberg J, et al. Left ventricular remodeling and myocardial recovery on mechanical circulatory support. J Card Fail. 2010;16:99–105. doi: 10.1016/j.cardfail.2009.10.018. [DOI] [PMC free article] [PubMed] [Google Scholar]
- 9.Birks EJ, George RS, Hedger M, et al. Reversal of Severe Heart Failure With a Continuous-Flow Left Ventricular Assist Device and Pharmacological Therapy: A Prospective Study. Circulation. 2011;123:381–390. doi: 10.1161/CIRCULATIONAHA.109.933960. [DOI] [PubMed] [Google Scholar]
- 10.Drakos SG, Kfoury AG, Stehlik J, et al. Bridge to recovery: understanding the disconnect between clinical and biological outcomes. Circulation. 2012;126(2):230–41. doi: 10.1161/CIRCULATIONAHA.111.040261. [DOI] [PMC free article] [PubMed] [Google Scholar]
- 11.Birks EJ. Myocardial recovery in patients with chronic heart failure: is it real? J Card Surg. 2010;25:472–7. doi: 10.1111/j.1540-8191.2010.01051.x. [DOI] [PubMed] [Google Scholar]
- 12.Kato TS, Chokshi A, Singh P, et al. Effects of Continuous- Versus Pulsatile-Flow Left Ventricular Assist Devices on Myocardial Unloading and Remodeling. Circ Heart Fail. 2011;4:546–553. doi: 10.1161/CIRCHEARTFAILURE.111.962142. [DOI] [PMC free article] [PubMed] [Google Scholar]
- 13.Haft J, Armstrong W, Dyke DB, et al. Hemodynamic and exercise performance with pulsatile and continuous-flow left ventricular assist devices. Circulation. 2007;116:I8–15. doi: 10.1161/CIRCULATIONAHA.106.677898. [DOI] [PubMed] [Google Scholar]
- 14.Klotz S, Deng MC, Stypmann J, et al. Left ventricular pressure and volume unloading during pulsatile versus nonpulsatile left ventricular assist device support. Ann Thorac Surg. 2004;77:143–149. doi: 10.1016/s0003-4975(03)01336-5. [DOI] [PubMed] [Google Scholar]
- 15.Thohan V, Stetson SJ, Nagueh SF, et al. Cellular and hemodynamics responses of failing myocardium to continuous-flow mechanical circulatory support using the DeBakey-Noon left ventricular assist device: a comparative analysis with pulsatile-type devices. J Heart Lung Transplant. 2005;24:566–575. doi: 10.1016/j.healun.2004.02.017. [DOI] [PubMed] [Google Scholar]
- 16.Miller LW, Pagani FD, Russell SD, et al. Use of a continuous-flow device in patients awaiting heart transplantation. N Engl J Med. 2007;(357):885–96. doi: 10.1056/NEJMoa067758. [DOI] [PubMed] [Google Scholar]
- 17.Russell SD, Rogers JG, Milano CA, et al. Renal and hepatic function improve in advanced heart failure patients during continuous-flow support with the HeartMate II left ventricular assist device. Circulation. 2009;120:2352–7. doi: 10.1161/CIRCULATIONAHA.108.814863. [DOI] [PubMed] [Google Scholar]
- 18.Strueber M, O'Driscoll G, Jansz P, et al. Multicenter evaluation of an intrapericardial left ventricular assist system. J Am Coll Cardiol. 2011;57:1375–82. doi: 10.1016/j.jacc.2010.10.040. [DOI] [PubMed] [Google Scholar]
- 19.Adverse Event Definitions in the Manual of Operations Version 2.3 for the Interagency Registry of Mechanically Assisted Circulatory Support (INTERMACS) [Accessed September 1, 2012]; http://www.uab.edu/ctsresearch/intermacs/manuals.htm.
- 20.George RS, Sabharwal NK, Webb C, et al. Echocardiographic assessment of flow across continuous-flow ventricular assist devices at low speeds. J Heart Lung Transplant. 2010;29:1245–1252. doi: 10.1016/j.healun.2010.05.032. [DOI] [PubMed] [Google Scholar]
- 21.Lang RM, Bierig M, Devereux RB, et al. Chamber Quantification Writing Group; American Society of Echocardiography's Guidelines and Standards Committee; European Association of Echocardiography. Recommendations for chamber quantification: a report from the American Society of Echocardiography's Guidelines and Standards Committee and the Chamber Quantification Writing Group, developed in conjunction with the European Association of Echocardiography, a branch of the European Society of Cardiology. J Am Soc Echocardiogr. 2005;18:1440–63. doi: 10.1016/j.echo.2005.10.005. [DOI] [PubMed] [Google Scholar]
- 22.Nagueh SF, Appleton CP, Gillebert TC, et al. Recommendations for the evaluation of left ventricular diastolic function by echocardiography. J Am Soc Echocardiogr. 2009;22:107–33. doi: 10.1016/j.echo.2008.11.023. [DOI] [PubMed] [Google Scholar]
- 23.Farrar DJ, Holman WR, McBride LR, et al. Long-term follow-up of Thoratec ventricular assist device bridge-to-recovery patients successfully removed from support after recovery of ventricular function. J Heart Lung Transplant. 2002;21:516–521. doi: 10.1016/s1053-2498(01)00408-9. [DOI] [PubMed] [Google Scholar]
- 24.Mancini DM, Beniaminovitz A, Levin H, et al. Low incidence of myocardial recovery after left ventricular assist device implantation in patients with chronic heart failure. Circulation. 1998;98:2383–2389. doi: 10.1161/01.cir.98.22.2383. [DOI] [PubMed] [Google Scholar]
- 25.Drakos SG, Terrovitis JV, Nanas JN, et al. Reverse electrophysiologic remodeling after cardiac mechanical unloading for end-stage nonischemic cardiomyopathy. Ann Thorac Surg. 2011;91:764–769. doi: 10.1016/j.athoracsur.2010.10.091. [DOI] [PubMed] [Google Scholar]
- 26.Drakos SG, Athanasoulis T, Malliaras KG, et al. Myocardial sympathetic innervation and long-term left ventricular mechanical unloading. JACC Cardiovasc Imaging. 2010;3:64–70. doi: 10.1016/j.jcmg.2009.10.008. [DOI] [PubMed] [Google Scholar]
- 27.Matsumiya G, Monta O, Fukushima N, Sawa Y, Toda K, Matsuda H. Who would be a candidate for bridge to recovery during prolonged mechanical left ventricular support in idiopathic dilated cardiomyopathy? J Thorac Cardiovasc Surg. 2005;130:699–704. doi: 10.1016/j.jtcvs.2005.05.016. [DOI] [PubMed] [Google Scholar]
- 28.Goldstein DJ, Maybaum S, Macgillivray TE, et al. Young patients with nonischemic cardiomyopathy have higher likelihood of left ventricular recovery during left ventricular assist device support. J Card Fail. 2012;18:392–5. doi: 10.1016/j.cardfail.2012.01.020. [DOI] [PubMed] [Google Scholar]
- 29.Drakos SG, Terrovitis JV, Anastasiou-Nana MI, Nanas JN. Reverse remodeling during long-term mechanical unloading of the left ventricle. J Mol Cell Cardiol. 2007;43:231–42. doi: 10.1016/j.yjmcc.2007.05.020. [DOI] [PubMed] [Google Scholar]
- 30.Stehlik J, Edwards LB, Kucheryavaya AY, et al. The Registry of the International Society for Heart and Lung Transplantation: Twenty-eighth Adult Heart Transplant Report--2011. J Heart Lung Transplant. 2011;30:1078–94. doi: 10.1016/j.healun.2011.08.003. [DOI] [PubMed] [Google Scholar]
- 31.Razeghi P, Sharma S, Ying J, et al. Atrophic remodeling of the heart in vivo simultaneously activates pathways of protein synthesis and degradation. Circulation. 2003;108:2536–2541. doi: 10.1161/01.CIR.0000096481.45105.13. [DOI] [PubMed] [Google Scholar]
- 32.Kinoshita M, Takano H, Takaichi S, Taenaka Y, Nakatani T. Influence of prolonged ventricular assistance on myocardial histopathology in intact heart. Ann Thorac Surg. 1996;61:640–645. doi: 10.1016/0003-4975(95)01087-4. [DOI] [PubMed] [Google Scholar]
- 33.Hill JA, Olson EN. Cardiac plasticity. N Engl J Med. 2008;358:1370–1380. doi: 10.1056/NEJMra072139. [DOI] [PubMed] [Google Scholar]
- 34.Oriyanhan W, Tsuneyoshi H, Nishina T, Matsuoka S, Ikeda T, Komeda M. Determination of optimal duration of mechanical unloading for failing hearts to achieve bridge to recovery in a rat heterotopic heart transplantation model. J Heart Lung Transplant. 2007;26:16–23. doi: 10.1016/j.healun.2006.10.016. [DOI] [PubMed] [Google Scholar]
- 35.Drakos SG, Diakos NA, Kfoury AG, et al. Does prolonged continuous-flow LVAD unloading induce hypertrophy regression to the point of atrophy of the failing human heart? J Heart Lung Transplant. 2012;31:S73. abstract. [Google Scholar]
Associated Data
This section collects any data citations, data availability statements, or supplementary materials included in this article.