Abstract
Covalent labeling and mass spectrometry (MS) are increasingly used to obtain higher order structure of proteins and protein complexes. Because most covalent labels are relatively large, steps must be taken to ensure the structural integrity of the modified protein during the labeling reactions so that correct structural information can be obtained. Measuring labeling kinetics is a reliable way to ensure that a given labeling reagent does not perturb a protein’s structure, but obtaining such kinetic information is time and sample intensive because it requires multiple liquid chromatography (LC)/MS experiments. Here we present a new strategy that uses isotopically encoded labeling reagents to measure labeling kinetics in a single LC/MS experiment. We illustrate this new strategy by labeling solvent exposed lysine residues with commercially available tandem mass tags (TMTs). After tandem MS experiments, these tags enable simultaneous identification of modified sites and determination of the reaction rates at each site in a way that is just as reliable as experiments that involve multiple LC/MS measurements.
INTRODUCTION
Mass spectrometry (MS) has emerged as a valuable tool for studying the higher order structure of proteins and protein complexes, especially in instances in which more commonly used methods, such as NMR and X-ray crystallography, are not suitable due to protein size, conformational flexibility, aggregation propensity, and/or limited sample quantity. Typically, to obtain protein 3D structural information, MS is combined with H/D exchange,1-10 cross-linking,11-21 covalent labeling,22-30 or noncovalent labeling31-33 to encode structural information into the mass of the measured protein (or peptide fragments). Covalent labeling combined with MS has seen increased interest in recent years because it provides information about side chain solvent accessibility and is therefore particularly valuable for studying protein-protein interfaces.24,34-42 In addition, as compared to H/D exchange and cross-linking, reliably identifying modified protein sites is experimentally straightforward. Usually, fewer sites on proteins are modified by covalent labeling reagents than in H/D exchange; however, the use of hydroxyl radicals23-28,38-42 or other general modification reagents, such as diethylpyrocarbonate (DEPC),34-37,43,44 enable a higher percentage of a protein to be probed and therefore a greater effective “resolution” to be obtained.
Structural information obtained from covalent labeling is reliable, though, only if the structural integrity of a protein is preserved during the reaction. Because most covalent labels are relatively large compared to deuterium, for example, they can potentially distort a protein’s structure upon reaction. Consequently, appropriate checks are required to ensure that the labeling reaction preserves the protein’s structure and thus provides reliable information. Several methods, such as circular dichroism (CD) spectroscopy, activity assays, and fluorescence spectroscopy, have been used to check protein structure; however, these methods are often not sufficient for monitoring the effect of modification on protein structure because they report on either global structure (e.g. CD) or only a few regions of the protein (e.g. fluorescence spectroscopy and activity assays). Previously, we have demonstrated that dose-response curves can be used to reliably detect protein structural changes anywhere in the protein.34 Such plots involve measuring the extent of modification at each labeled site to determine labeling kinetics. Measuring the kinetics of the labeling reactions provides a very sensitive way to monitor any modification-induced structural changes caused by the covalent labels.
While this method is a sensitive and site-specific indicator of protein structural integrity, it requires multiple LC/MS measurements to establish reliable kinetics and therefore can be laborious and sample intensive. Here, we present a new approach based on isotopically encoded reagents that allow labeling kinetics to be measured at each site in a single LC/MS experiment, thus providing a faster and less sample intensive way to ensure protein structure integrity. To demonstrate this new approach, we employ commercially available tandem mass tags (TMTs),45,46 which are commonly used in MS-based quantification experiments. The tags react with lysine residues and the N-terminus, providing a good probe of protein surface structure. Importantly, they contain isotopic reporter groups that are liberated during either collision induced dissociation (CID) or electron transfer dissociation (ETD) experiments and can be used to quantify modification extent. In effect, the TMTs allow simultaneous identification and quantification of covalent labeling sites and therefore allow us to produce entire dose-response curves in a single LC/MS experiment.
EXPERIMENTAL SECTION
Materials
Immobilized chymotrypsin and triethylamine acetate (pH 8.0) were purchased from Princeton Separations (Adelphia, NJ, USA). Human β-2-microglobulin (β2m) was obtained from Lee Biosolutions, Inc. (St. Louis, MO, USA). Triethylammonium bicarbonate (TEAB), 50% (w/w) hydroxylamine, iodoacetamide, tris(2-carboxyethyl)phosphine (TCEP), and equine skeletal muscle myoglobin were obtained from Sigma-Aldrich (St. Louis, MO, USA). The sixplex Tandem Mass Tags (TMTs) reagent kit and TMTzero™ (TMT0) labeling reagent were purchased from Thermo Scientific (Rockford, IL, USA). Methanol, acetonitrile, and acetic acid were obtained from Fisher Scientific (Fair Lawn, NJ, USA). Centricon molecular weight cutoff (MWCO) filters were from Millipore (Burlington, MA, USA). Deionized water was generated with a Millipore (Burlington, MA, USA) Simplicity 185 water purification system.
Sample Preparation and Reaction Conditions
The TMT0 modification reagent, which has no isotope substitutions, was used to optimize and validate the reaction conditions that were eventually conducted with the TMTsixplex™ (TMT6) reagent set. The TMT reagents (TMT0 or TMT6) were first dissolved in acetonitrile. Proteins (2 μM) were then covalently modified with the TMT reagents at varying concentrations (0.04 – 0.24 mM) in a 20 mM TEAB solution at pH 7.4. The reactions were then quenched after 1 min (myoglobin) or 10 s (β2m) by adding a hydroxylamine solution (5 wt % in 200 mM TEAB). Before proteolytic digestion, the modified proteins were purified using a 10,000 MWCO filter. β2m, which has a disulfide bond, was reacted with TCEP (protein:TCEP=1:40 molar ratio) to reduce the disulfide bond. Iodoacetamide was added simultaneously at room temperature for 30 min in the dark to alkylate the reduced Cys residues.35 Both β2m and myoglobin were incubated with 10% (vol/vol) acetonitrile at 50 °C for 45 min prior to digestion. The resulting samples were then digested by immobilized chymotrypsin (enzyme/substrate ratio of 1:10) at 37 °C. After 2 h, the reaction mixture was centrifuged for 2 min at 9000 relative centrifugal force to separate the enzyme from the protein. Digestions after the parallel reactions with the TMT6 reagents were done in parallel and then pooled for immediate analysis by LC-MS/MS.
Instrumentation
The MS analyses were carried out on a Bruker AmaZon (Billerica, MA, USA) quadrupole ion trap mass spectrometer, which is equipped with an electrospray ionization source. Typically, the electrospray needle voltage was kept at ~4 kV, and the capillary temperature was set to 250 °C. Either collision-induced dissociation (CID) in the PAN™ mode or electron transfer dissociation (ETD) was used to obtain tandem mass spectra. Because CID on quadrupole ion traps typically suffers from a limited product ion range, the reporter ions from the TMT6 reagents are often not measurable for larger peptide ions during standard CID experiments. To overcome this limitation, we used the panorama (PAN™) mode to enable lower m/z ions to be observed in the CID spectra. The PAN mode works in a way that is comparable to the pulsed Q dissociation47 and HASTE48 methods described previously. For the CID PAN™ mode, the activation was set to 70%, and the low CID cutoff was set to 17%. For the ETD experiments, fluoranthene radical anions were used with an accumulation time of 10 ms. Low m/z cutoff (LMCO) values ranging from 50 to 100 and reaction times ranging from 50–180 ms were used. The MS and MS/MS scan ranges were 100–3000 m/z unless otherwise stated. An HP1100 HPLC system (Agilent, Wilmington, DE, USA) with a Discovery C18 column (15 cm × 2.1 mm, 5 μm particle size; Supelco, St. Louis, MO, USA) was used for HPLC analysis. Peptide fragments from the proteolytic digests were eluted using a linear gradient of methanol containing 0.1% acetic acid that increased from 10% to 100% methanol over 30 min at a flow rate of 0.25 mL/min.
RESULTS AND DISCUSSION
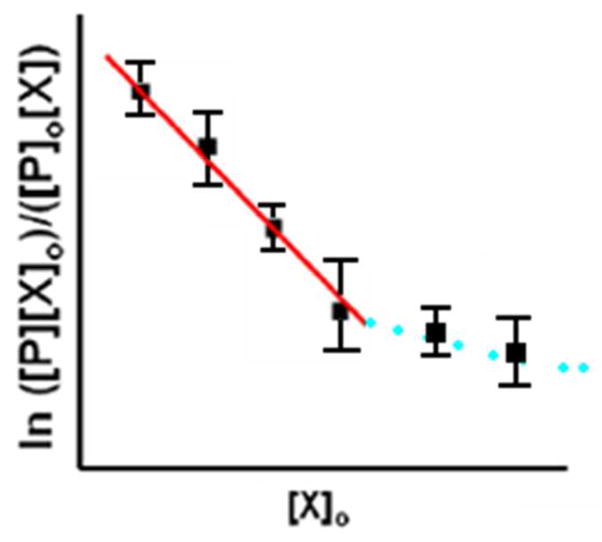
Previously we have demonstrated that dose-response plots are reliable ways to ensure the structural integrity of a protein during covalent labeling reactions. These plots rely on measuring the modification rates of individual peptide fragments and looking for deviations from linearity as a way to indicate the range of label concentrations that maintain a protein’s structure. The reaction of a covalent label with a protein follows second-order kinetics under the conditions we typically use34 and can be described by equation 1, where [P]0 is the initial unmodified protein concentration, [X]0 is the initial covalent label concentration, [P] is the unmodified protein concentration at time t, [X] is the labeling reagent concentration at time t, and k is the second-order rate coefficient. Typically we use a constant reaction time, and hence, a plot of will result in a straight line if the protein’s structure remains unchanged over a range of reagent concentrations. Deviations from linearity indicate a change in protein structure, as hypothetically illustrated in Scheme 1. In our usual protocol, we react a given protein with at least six different concentrations of the covalent labeling reagent, with three replicates at each concentration. Therefore, a minimum of 18 HPLC-MS runs are conducted.
Scheme 1.
Hypothetical dose-response plot for a second-order reaction indicating that the protein/peptide’s structure deviates at higher reagent (X0) concentrations
| (1) |
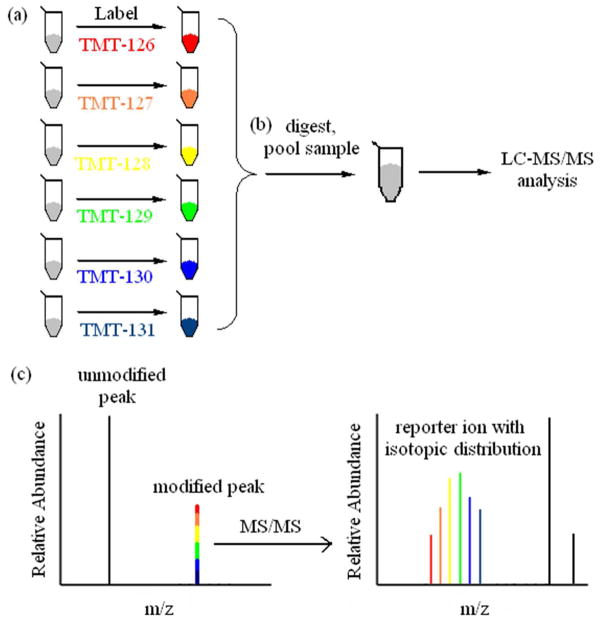
While this approach is very effective for finding reaction conditions that ensure protein integrity and the measured rates provide quantitative insight into the solvent accessibility of a given residue, this approach is very time consuming. Consequently, we hypothesized that parallel reactions of different concentrations of isotopically encoded reagents could dramatically shorten the time frame of our approach by minimizing the number of LC-MS runs. Scheme 2 shows the experimental steps to implement this isotopic labeling method: (a) each isotopically encoded reagent is reacted at a different concentrations with the protein under otherwise identical conditions; (b) the resulting products are digested, pooled together, and analyzed by LC-MS/MS; and (c) the ion abundances of the different m/z that arise from the isotopically encoded reagents are used to generate a dose-response plot that helps ensure the structural integrity of the protein.
Scheme 2.
Experimental work-flow for TMT labeling strategy. (a) A protein is labeled in parallel with different concentrations of isotopically encoded reagents. (b) The protein samples are digested and pooled for LC-MS/MS analysis. (c) MS/MS is used as a readout of the isotopically labeled peptides.
To explore the feasibility of this idea, we investigated tandem mass tags (TMTs) as the isotopically encoded covalent labeling reagents. TMTs comprise a set of structurally identical tags that mainly label the free N-terminus and lysine side chains (Scheme S1 in the Supporting Information). After the labeling reaction, the protein and eventual peptide digestion products will have a mass shift for every TMT molecule that is added. The isotopically encoded regions of the molecule that carry the information necessary to generate the dose-response plots are measured at the MS/MS, not MS, stage of the experiment, meaning that the pooled solution-phase reaction products give rise to the same m/z ratio for the labeled peptides (Scheme 2 (c)). A common measured m/z product ion during the MS stage of the experiment avoids diluting the ion signal across multiple reaction products and ensures co-elution of the products. During MS/MS, dissociation of the modified peptides from the pooled reactions gives rise to reporter ions at different m/z ratios whose relative ion abundances contain information about the extent of reaction with the different label concentrations and can be used to generate the dose-response plots (Scheme 2 (c)). The TMTs have been designed to give rise to product ions in a m/z region that is typically devoid of peptide product ions.
The ability of the TMT reagents to enable accurate dose-response plots to be constructed was tested using the TMT sixplex (TMT6), which has five isotopic substitutions per tag (see Scheme S1 (c) in the Supporting Information). These labeling reagents give a mass increase of 229 for every TMT that is added and generate reporter ions at m/z 126 through m/z 131 for CID and m/z 114 through 119 for ETD (Scheme S1 (c)). The relative abundances of these reporter ions are used to measure the modification rate of a given labeled amino acid (in a given modified peptide) and determine the reagent concentrations that ensure the structural integrity of the protein.
To simplify data analysis, the TMTs were reacted with proteins of interest under pseudo-first order conditions (equation 2) in which the isotopically encoded labeling reagents had concentrations that exceeded protein concentrations by at least 20 times.
| (2) |
Using the ion abundances for the unmodified (Iunmodi) and modified (Imodi) peptides, equation 2 can be converted to equation 3.
| (3) |
If only one isotopomer of the TMTs is used, Iunmodi and Imodi are easily determined from the mass spectrum, and a plot of would give a straight line when the protein’s structure remains unchanged and would deviate from linearity at high concentrations when the protein’s structure changes. If all six TMTs are used in parallel reactions and the digested products are mixed for LC-MS analysis, then the data analysis is slightly more complicated. The ion abundances of the unmodified (i.e. Iunmodi) peptide cannot be directly related to each TMT label because it carries no information about the reaction solution from which it came. The modified peptide ion abundance (i.e. Imodi), however, does contain the necessary information, but it is not revealed until the modified peptide is dissociated during MS/MS (Scheme 2(c)). As an example, the extent of modification for the TMT that gives rise to a product ion at m/z 126 for CID can be determined by equation 4, where in indicates the ion abundance of each reporter product ion.
| (4) |
If we assume that the total peptide amount is the same in each of the parallel modification reactions, then equation 5 can be used together with equation 4 to generate equation 6. Assuming the peptide amounts are identical is reasonable because each reaction is done with identical protein concentrations, and the proteins are digested under identical conditions.
| (5) |
| (6) |
We can then use equations 4, 5, and 6 to arrive at an expression (equation 7) that uses the measured product ion abundances to determine the percentage of the modified peptide that forms by reaction of a given TMT label.
| (7) |
Putting this into a pseudo first-order reaction expression leads to equation 8.
| (8) |
If equation 8 is then plotted as a function of the concentrations used in each individual TMT reaction, a dose-response plot will be created. In this plot a straight line will be obtained for the range of TMT concentrations over which the protein’s structure remains unchanged, just as in the previous approach for constructing dose-response plots.34 The protein’s structure is distorted when the plot deviates from linearity.
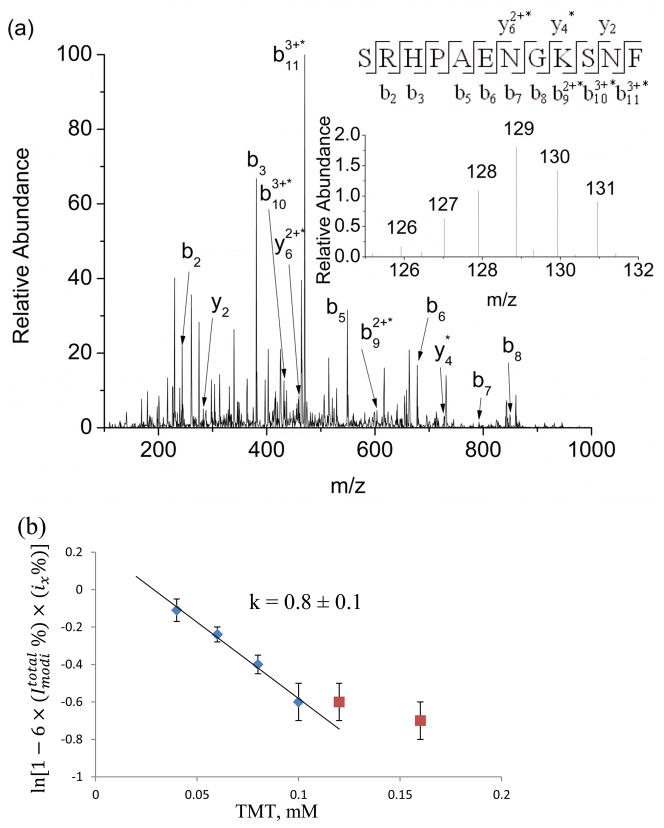
The suitability of this isotopic encoding approach was initially tested with the protein β-2-microglobulin (β2m). In parallel reactions, the protein (2 μM) was reacted with 0.04 mM, 0.06 mM, 0.08 mM, 0.10 mM, 0.12 mM, and 0.16 mM of the TMT sixplex reagents, with the reagents having the more massive reporter ions (see Scheme S1) used at increasingly higher concentrations. After the 10 s reactions were completed, the protein was digested, pooled and analyzed by LC-MS/MS to identify the modified sites and determine the rate of modification. As an example of the data that is obtained, Figure 1a shows the CID mass spectrum of the peptide fragment SRHPAENGKSNF, which was found to be modified at Lys19. The inset of Figure 1a shows the relative abundances of the reporter ions as centroid spectra because such centroid spectra more accurately indicate ion abundances. The ion abundances of these reporter ions are then plugged into equation 8 to produce a dose-response plot for this peptide (Figure 1b). At TMT concentrations equal to or below 0.10 mM, a linear relationship is observed, suggesting that the protein’s structure is maintained during the covalent modification reactions at these lower concentrations. Deviations from linearity occur at TMT concentrations above 0.10 mM, which implies that the protein’s structure is distorted at these higher TMT concentrations. The rate coefficient, k, obtained from these data is 0.8 ± 0.1 s−1. The plotted values that result in this reaction rate coefficient are included in Table S1 of the Supporting Information.
Figure 1.
(a) CID tandem mass spectrum of the [M+4H+TMT6]4+ ion of the peptide fragment SRHPAENGKSNF, acquired using the PAN mode (see experimental section for details). A series of unmodified b ions from b2 to b8, modified b9 b10 and b11 ions, unmodified y2 and modified y4 and y6 ions confirm that Lys19 is the site of modification. The product ions with an asterisk are the product ions that contain the TMT6 modification. The inset is an enlarged view of the reporter ion region. (b) Dose-response plots for the peptide fragment (SRHPAENGKSNF) obtained by plugging the reporter ion abundances at m/z’s 126 to 131 into equation 8. The k value is obtained from the slope and is corrected using equation 2.
To validate the data obtained with this isotope encoding method, we reacted β2m with the same six concentrations of the non-isotopically enriched TMT reagent (i.e. TMT0) and carried out separate LC-MS/MS analyses for each reaction concentration. Figure 2 is the resulting dose-response plot for the same peptide in Figure 1 (i.e. SRHPAENGKSNF). Because the reaction products from each concentration are analyzed by separate LC-MS experiments, the much simpler equation 3 is used to generate the plot in Figure 2. The results in Figure 2 are in very good agreement with the results shown in Figure 1. At TMT concentrations equal to or below 0.10 mM, a linear relationship is observed, and deviations from linearity occur at TMT concentrations above 0.10 mM. Moreover, the rate coefficient (k = 0.7 ± 0.1 s−1) is essentially identical for this peptide. The plotted values for each TMT concentration are included in Table S2 of the Supporting Information.
Figure 2.
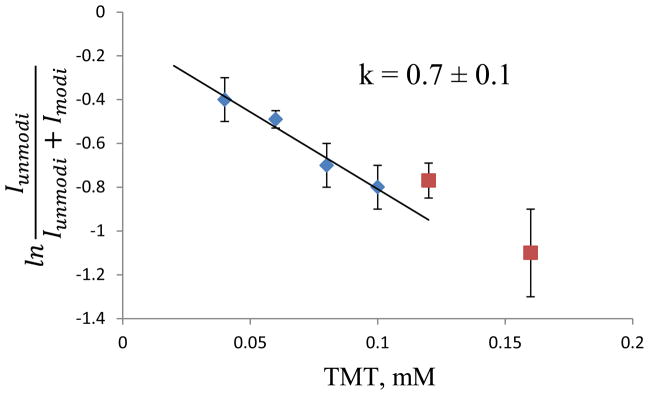
Dose-response plot for the proteolytic fragment SRHPAENGKSNF after reaction with the TMT0 reagent. The k value is obtained from the slope and is corrected using equation 2.
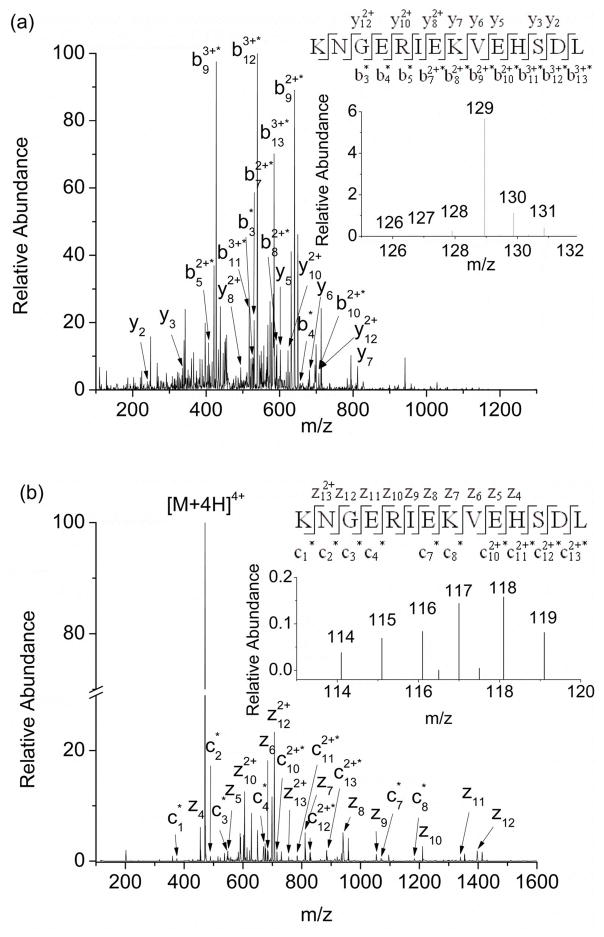
While the isotopic encoding approach appears to be valid for at least one modification site on β2m, confidence in this approach requires that all labeled sites be validated. A comparison of the data for all the sites, however, was made challenging by an unexpected interfering product ion at m/z 129 that is observed in the CID spectra of several peptides. We found that peptides with an unmodified lysine residue generate a product ion at m/z 129 that overlaps with one of the reporter ions from the TMT6 set of reagents. The result is that the ion abundances of the reporter ions from CID could not be confidently used in some cases. The CID spectrum of the peptide fragment KNGERIEKVEHSDL, modified at Lys41, illustrates this fact (Figure 3). This peptide has two lysine residues that can both be modified, and each modified form is separated by LC. CID of the peptide modified at Lys41 by the TMT6 set of reagents reveals reporter ions in the expected m/z region (inset in Figure 3(a)); however, the ion at m/z 129 peak has an unexpectedly high abundance relative to the other reporter ions. Upon observing the unexpectedly high abundance of m/z 129, we surmised that the ion at this m/z ratio might be a mixture of the reporter ion at m/z 129 and another interfering product ion at the same m/z. Indeed, m/z 129 is a common low mass product ion found in the CID spectra of lysine-containing peptides, and the presence of the unmodified Lys48 might lead to this product ion. CID of the same peptide (KNGERIEKVEHSDL) labeled at Lys41 with the TMT0 reagent confirms that the interfering ion does not arise from the modification reagent (Figure S1(b) in the SI), as the TMT0 reagent should only produce a reporter ion at m/z 126. The product ion at m/z 129 is even generated after CID of the unmodified peptide (Figure S1(a) in the SI), which further establishes that this ion is not caused by the TMT6 reagent. Overall, we found the interfering ion to arise in peptides containing two or more lysine residues, with one or more of the lysines remaining unmodified.
Figure 3.
(a) CID mass spectrum of the [M+4H+TMT6]4+ ion of the peptide fragment KNGERIEKVEHSDL, acquired using the PAN mode (see experimental section for details). A series of modified b3 to b13 ions, and a series of unmodified y2 to y12 ions confirm that Lys41 is the site of modification. The inset is an enlarged view of the reporter ion region. (b) ETD mass spectrum of the [M+4H+TMT6]4+ ion of the peptide fragment KNGERIEKVEHSDL. A series of modified ions from c1 to c13 and a series of unmodified ions from z4 to z13 confirm that Lys41 is the site of modification by TMT6. The inset is an enlarged view of the reporter ion region. In all spectra, the product ions with an asterisk are the product ions that contain the TMT modification.
The solution to the problem caused by this interference ion is to dissociate the modified peptides via ETD. The effectiveness of this solution is exemplified in the ETD spectrum of the same peptide (i.e. KNGERIEKVEHSDL) modified at Lys41. The inset in the figure shows the reporter ions at m/z 114 through m/z 119. No interfering ions appear in the reporter ion range of this spectrum or the ETD spectrum of the unmodified peptide (data not shown). Thus, ETD can provide interference free data. If ETD or ECD is not available for dissociation, an alternate approach would be to modify the remaining free Lys residues with a Lys specific reagent before analysis to avoid the CID produced m/z 129 ion.
Using ETD to dissociate the peptides with interfering ions and CID to dissociate all other peptides, the isotope encoding method can now be validated for all eight labeled sites in β2m. Indeed, Table 1 shows good agreement between the rate coefficients obtained by the more labor intensive TMT0 analysis (TMT0 column in Table 1) and the 6x faster TMT6 analysis (TMT6/CID or TMT6/ETD columns in Table 1).
Table 1.
Rate coefficients of TMT-modified amino acids of β2m and myoglobin.
| β2m | ||||||
|---|---|---|---|---|---|---|
| modified sites | TMT0 | TMT6 | [TMT] mMa | |||
| CID | CID 100–150 | ETD | ETD 100–150 | |||
| N-term. | 0.010 ± 0.001 | --b | -- | 0.014 ± 0.003 | 0.017 ± 0.003 | 0.12 |
| K6 | 0.10 ± 0.01 | -- | -- | 0.09 ± 0.03 | 0.09 ± 0.03 | 0.12 |
| K19 | 0.7 ± 0.1 | 0.8 ± 0.1 | 0.96 ± 0.04 | 0.8 ± 0.1 | 0.7 ± 0.1 | 0.10 |
| K41 | 0.009 ± 0.001 | -- | -- | 0.019 ± 0.002 | 0.012 ± 0.001 | 0.12 |
| K48 | 0.016 ± 0.002 | -- | -- | 0.022 ± 0.003 | 0.020 ± 0.002 | 0.12 |
| K58 | 0.10 ± 0.01 | 0.058 ± 0.008 | 0.092± 0.008 | -- | -- | 0.10 |
| K75 | 0.15 ± 0.02 | 0.20 ± 0.02 | 0.17 ± 0.03 | -- | -- | 0.10 |
| K91/K94 | 0.18 ± 0.03 | -- | -- | 0.20 ± 0.02 | 0.17 ± 0.01 | 0.10 |
| Myoglobin | ||||||
| N-term. | 0.057 ± 0.002 | -- | -- | -- | 0.070 ± 0.002 | 0.20 |
| K16 | 0.025 ± 0.005 | 0.046 ± 0.007 | 0.042 ± 0.003 | 0.038 ± 0.003 | 0.035 ± 0.005 | 0.16 |
| K42 | 0.028 ± 0.002 | 0.023 ± 0.003 | 0.023 ± 0.002 | 0.020 ± 0.003 | 0.017 ± 0.001 | 0.16 |
| K62/K63 | 0.077 ± 0.007 | -- | -- | 0.080 ± 0.007 | 0.09 ± 0.01 | 0.16 |
| K77/K78/K79 | 0.016 ± 0.001 | -- | -- | 0.015 ± 0.002 | 0.012 ± 0.002 | 0.20 |
| K87 | 0.037 ± 0.007 | -- | -- | 0.043 ± 0.003 | 0.040 ± 0.008 | 0.20 |
| K145 | 0.008 ± 0.001 | 0.012 ± 0.002 | 0.010 ± 0.002 | 0.009 ± 0.007 | 0.010 ± 0.005 | 0.16 |
| K147 | 0.048 ± 0.007 | 0.042 ± 0.007 | 0.040 ± 0.003 | -- | -- | 0.12 |
The TMT concentration above which the pseudo first-order reaction deviates from the linearity.
-- indicates that the data are not applicable either because there are interfering ions or the charge state is too low for efficient ETD.
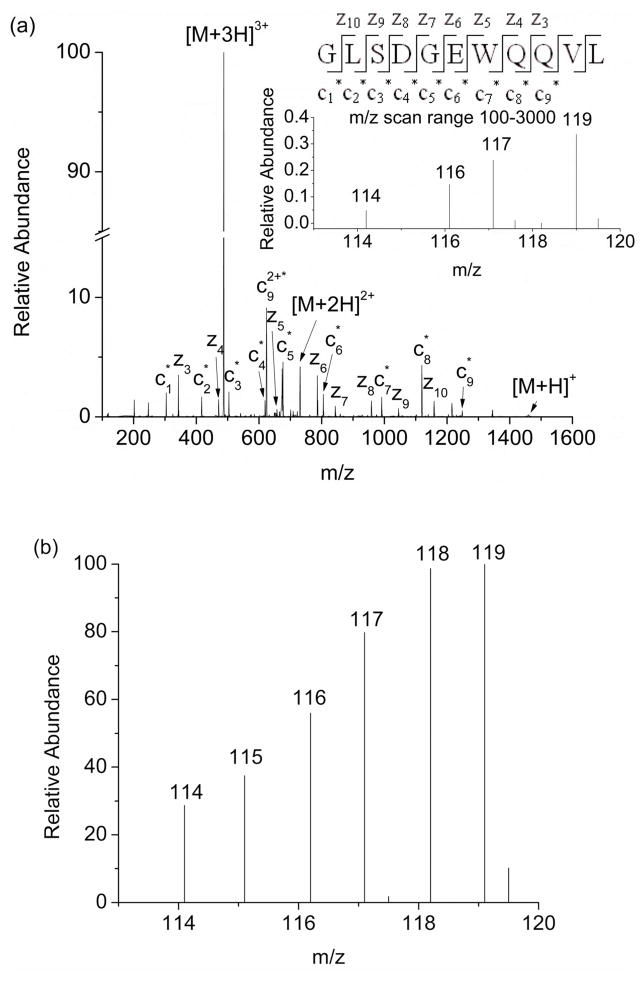
While ETD avoids the interference ion that complicates data analysis in the TMT6 labeling experiments, the longer dissociation times required during the ETD experiment can limit the number of mass spectra that are obtained as an LC peak elutes. This longer duty cycle makes it challenging to analyze peptides with low levels of modification or low ion abundances. For example, the peptide fragment GLSDGEWQQVL, which is labeled at the N-terminus, has a low ion abundance when modified by the TMT6 reagent. As such, the ETD spectrum does not provide a complete collection of reporter ions (Figure 4a). To increase the effective signal for peptides like this one, we investigated shortening the quadrupole ion trap scan range used in these experiments to obtain more spectra during the same amount of time, and thus obtain higher quality spectra. Instead of acquiring data from m/z 100 to 3000, we explored whether a shorter scan range (i.e m/z 100 to 150) would improve the signal in the reporter ion region. This shorter scan range increases the number of spectra acquired per unit time by at least a factor of 2 and thus provides better ion statistics and more reliable reporter ion information (Figure 4b). A drawback of this approach, however, is that two LC-MS/MS runs are needed; one to identify the labeled residues using a broader scan range and a second to obtain the reporter ion information necessary to construct the dose-response plots for the sites that are modified to a minor extent. As Table 1 shows the shorter scan range provides excellent rate coefficient data that is comparable to the more involved analysis with the TMT0 reagent.
Figure 4.
(a) ETD mass spectrum of the [M+3H+TMT6]3+ ion of the peptide fragment GLSDGEWQQVL. A series of modified c1 to c9 ions and a series of unmodified z3 to z10 ions confirm that the N-terminus is the site of modification. The product ions with an asterisk are the product ions that contain the TMT modification. The inset spectrum is an enlarged view of the reporter ion region, showing that poor ion statistics leads to insufficient information to construct a reliable dose-response plot. (b) ETD mass spectrum of the [M+3H+TMT6]3+ ion of the peptide fragment GLSDGEWQQVL, acquired using a shorter scan range (from m/z 100 to 150).
To demonstrate that this isotope encoding method can work with another protein, we also investigated the covalent labeling of myoglobin. The results for this protein are also listed in Table 1. In comparing the results from the more involved TMT0 experiment, which requires six LC-MS/MS runs per experiment, and the TMT6 experiment, which requires one (or two) LC-MS/MS runs per experiment, we find very good agreement in the dose-response plots for myoglobin, as indicated by the measured rate coefficients. To emphasize the time and sample savings involved in the isotope encoding approach, it should be noted that a total of 18 LC-MS/MS runs each were required to obtain the TMT0 results for myoglobin and β2m, while only three LC-MS/MS runs each were required to obtain the TMT6 results. Together the data for these two proteins indicate both the robustness and greater efficiency of this approach.
Finally, it should be noted that while TMT reacts most readily with N-termini and lysine residues, it can also modify other residues, such as serine, threonine and tyrosine residues. In fact, we found that at higher TMT concentrations some serine and tyrosine residues were modified. In each case, though, these residues were modified at TMT concentrations that were too high to be useful as they were modified under conditions in which the protein’s structure had been distorted. Interestingly, CID and ETD both produce the same set of reporter ions for these modified residues as they do for lysine. It is quite possible that for other proteins serine, threonine, and tyrosine residues could be modified in a structurally informative way, thereby increasing the information available with the TMT reagent.
CONCLUSION
We have developed a new strategy for ensuring protein structural integrity during covalent labeling reactions. Our new strategy uses isotopically encoded covalent labeling reagents to simultaneously investigate the range of covalent labeling reagent concentrations that will provide information about the surface structure of the protein while avoiding modification-induced structural changes. To illustrate this new strategy, we used tandem mass tags (TMTs) to isotopically encode the desired reactivity information. In using the TMTs, MS/MS is used to generate reporter ions that provide a readout of a given site’s reactivity with the covalent labeling reagent. This new approach is faster and requires less sample than previous approaches based on dose-response plots. We have validated this new approach by comparing the isotope encoding method to another more time-consuming method of ensuring protein structural integrity and found that the new approach provides comparable results. In addition, we find that both CID and ETD can generate the required reporter ions. In cases where a peptide fragment contains an unmodified lysine residue, though, ETD provides more reliable data by avoiding the formation of an interfering ion. Overall, this new strategy represents a faster and more efficient way to ensure the accuracy of covalent labeling/MS experiments. We envision that this strategy could be used with other covalent labeling reagents that are isotopically labeled and could be used in a different format where MS, instead of MS/MS, is used to provide a readout of the modification reactivity.
Supplementary Material
Acknowledgments
This work was supported by a grant from the National Institutes of Health (R01 GM075092).
References
- 1.Wales TE, Engen JR. Mass Spectrom Rev. 2006;25:158–170. doi: 10.1002/mas.20064. [DOI] [PubMed] [Google Scholar]
- 2.Engen JR. Anal Chem. 2009;81:7870–7875. doi: 10.1021/ac901154s. [DOI] [PMC free article] [PubMed] [Google Scholar]
- 3.Hoofnagle AN, Resing KA, Ahn NG. Annu Rev Bioph Biom. 2003;32:1–25. doi: 10.1146/annurev.biophys.32.110601.142417. [DOI] [PubMed] [Google Scholar]
- 4.Marcsisin SR, Engen JR. Anal Bioanal Chem. 2010;397:967–972. doi: 10.1007/s00216-010-3556-4. [DOI] [PMC free article] [PubMed] [Google Scholar]
- 5.Tsutsui Y, Wintrode PL. Curr Med Chem. 2007;14:2344–2358. doi: 10.2174/092986707781745596. [DOI] [PubMed] [Google Scholar]
- 6.Englander SW. J Am Soc Mass Spectrom. 2006;17:1481–1489. doi: 10.1016/j.jasms.2006.06.006. [DOI] [PMC free article] [PubMed] [Google Scholar]
- 7.Percy AJ, Rey M, Burns KM, Schriemer DC. Anal Chim Acta. 2012;721:7–21. doi: 10.1016/j.aca.2012.01.037. [DOI] [PubMed] [Google Scholar]
- 8.Konermann L, Pan J, Liu Y. Chem Soc Rev. 2011;40:1224–1234. doi: 10.1039/c0cs00113a. [DOI] [PubMed] [Google Scholar]
- 9.Konermann L, Tong X, Pan J. J Mass Spectrom. 2008;43:1021–1036. doi: 10.1002/jms.1435. [DOI] [PubMed] [Google Scholar]
- 10.Chalmers ML, Busby SA, Pascal BD, West Gm, Griffin PR. Expert Rev Proteomics. 2011;8:43–59. doi: 10.1586/epr.10.109. [DOI] [PMC free article] [PubMed] [Google Scholar]
- 11.Petrotchenko Evgeniy V, Borchers Christoph H. Mass Spectrom Rev. 2010;29:862–876. doi: 10.1002/mas.20293. [DOI] [PubMed] [Google Scholar]
- 12.Sinz A. Anal Bioanal Chem. 2010;397:3433–3440. doi: 10.1007/s00216-009-3405-5. [DOI] [PubMed] [Google Scholar]
- 13.Sinz A. Mass Spectrom Rev. 2006;25:663–682. doi: 10.1002/mas.20082. [DOI] [PubMed] [Google Scholar]
- 14.Steen H, Jensen ON. Mass Spectrom Rev. 2002;21:163–182. doi: 10.1002/mas.10024. [DOI] [PubMed] [Google Scholar]
- 15.Singh P, Panchaud A, Goodlett DR. Anal Chem. 2010;82:2636–2642. doi: 10.1021/ac1000724. [DOI] [PubMed] [Google Scholar]
- 16.Leitner A, Walzthoeni T, Kahraman A, Herzog F, Rinner O, Beck M, Aebersold R. Mol Cell Proteomics. 2010;9:1634–1649. doi: 10.1074/mcp.R000001-MCP201. [DOI] [PMC free article] [PubMed] [Google Scholar]
- 17.Chakravarti B, Lewis SJ, Chakravarti DN, Raval A. Curr Proteomics. 2006;3:1–21. [Google Scholar]
- 18.Back JW, De Jong L, Muijsers AO, De Koster CG. J Mol Biol. 2003;331:303–313. doi: 10.1016/s0022-2836(03)00721-6. [DOI] [PubMed] [Google Scholar]
- 19.Calabrese AN, Pukala TL. Aust J Chem. 2013;66:749–759. [Google Scholar]
- 20.Stengel F, Aebersold R, Robinson CV. Mol Cell Proteomics. 2012;11 doi: 10.1074/mcp.R111.014027. doi:0.1074/mcp.R111. 014027. [DOI] [PMC free article] [PubMed] [Google Scholar]
- 21.Rappsilber J. Expert Rev Proteomics. 2012;9:485–487. doi: 10.1586/epr.12.44. [DOI] [PMC free article] [PubMed] [Google Scholar]
- 22.Mendoza VL, Vachet RW. Mass Spectrom Rev. 2009;28:785–815. doi: 10.1002/mas.20203. [DOI] [PMC free article] [PubMed] [Google Scholar]
- 23.Konermann L, Stocks BB, Pan Y, Tong X. Mass Spectrom Rev. 2010;29:651–667. doi: 10.1002/mas.20256. [DOI] [PubMed] [Google Scholar]
- 24.Xu G, Chance MR. Chem Rev. 2007;107:3514–3543. doi: 10.1021/cr0682047. [DOI] [PubMed] [Google Scholar]
- 25.Hambly DM, Gross ML. J Am Soc Mass Spectrom. 2005;16:2057–2063. doi: 10.1016/j.jasms.2005.09.008. [DOI] [PubMed] [Google Scholar]
- 26.Hambly DM, Gross ML. Int J Mass Spectrom. 2007;259:124–129. [Google Scholar]
- 27.Gau BC, Sharp JS, Rempel DL, Gross ML. Anal Chem. 2009;81:6563–6571. doi: 10.1021/ac901054w. [DOI] [PMC free article] [PubMed] [Google Scholar]
- 28.Chen J, Rempel DL, Gross ML. J Am Chem Soc. 2010;132:15502–15504. doi: 10.1021/ja106518d. [DOI] [PMC free article] [PubMed] [Google Scholar]
- 29.Konermann L, Pan Y. Expert Rev Proteomics. 2012;9:497–504. doi: 10.1586/epr.12.42. [DOI] [PubMed] [Google Scholar]
- 30.Chen J, Rempel DL, Gau BC, Gross ML. J Am Chem Soc. 2012;134:18724–18731. doi: 10.1021/ja307606f. [DOI] [PMC free article] [PubMed] [Google Scholar]
- 31.Liu ZJ, Cheng SJ, Gailie DR, Julian RR. Anal Chem. 2008;80:3846–3852. doi: 10.1021/ac800176u. [DOI] [PubMed] [Google Scholar]
- 32.Ly T, Julian RR. J Am Soc Mass Spectrom. 2008;19:1663–1672. doi: 10.1016/j.jasms.2008.07.006. [DOI] [PubMed] [Google Scholar]
- 33.Ly T, Julian RR. J Am Soc Mass Spectrom. 2006;17:1209–1215. doi: 10.1016/j.jasms.2006.05.007. [DOI] [PubMed] [Google Scholar]
- 34.Mendoza VL, Vachet RW. Anal Chem. 2008;80:2895–2904. doi: 10.1021/ac701999b. [DOI] [PMC free article] [PubMed] [Google Scholar]
- 35.Srikanth R, Mendoza VL, Bridgewater JD, Zhang G, Vachet RW. Biochemistry. 2009;48:9871–9881. doi: 10.1021/bi901172y. [DOI] [PMC free article] [PubMed] [Google Scholar]
- 36.Mendoza VL, Antwi K, Baron-Rodriguez MA, Blanco C, Vachet RW. Biochemistry. 2010;49:1522–1532. doi: 10.1021/bi901748h. [DOI] [PMC free article] [PubMed] [Google Scholar]
- 37.Mendoza VL, Baron-Rodriguez MA, Blanco C, Vachet RW. Biochemistry. 2011;50:6711–6722. doi: 10.1021/bi2004894. [DOI] [PMC free article] [PubMed] [Google Scholar]
- 38.Takamono K, Chance MR. Annu Rev Bioph Biom. 2006;35:251–276. doi: 10.1146/annurev.biophys.35.040405.102050. [DOI] [PubMed] [Google Scholar]
- 39.Maleknia SD, Downard K. Mass Spectrom Rev. 2001;20:388–401. doi: 10.1002/mas.10013. [DOI] [PubMed] [Google Scholar]
- 40.Wong JWH, Maleknia SD, Downard KM. Anal Chem. 2003;75:1557–1563. doi: 10.1021/ac026400h. [DOI] [PubMed] [Google Scholar]
- 41.Wong JWH, Maleknia SD, Downard KM. J Am Soc Mass Spectrom. 2005;16:225–233. doi: 10.1016/j.jasms.2004.11.009. [DOI] [PubMed] [Google Scholar]
- 42.Guan JQ, Vorobiev S, Almo SC, Chance MR. Biochemistry. 2002;41:5765–5775. doi: 10.1021/bi0121104. [DOI] [PubMed] [Google Scholar]
- 43.Zhou Y, Vachet RW. J Am Soc Mass Spectrom. 2012;23:708–717. doi: 10.1007/s13361-011-0332-4. [DOI] [PMC free article] [PubMed] [Google Scholar]
- 44.Zhou Y, Vachet RW. J Am Soc Mass Spectrom. 2012;23:899–907. doi: 10.1007/s13361-012-0349-3. [DOI] [PMC free article] [PubMed] [Google Scholar]
- 45.Thompson A, Schafer J, Kuhn K, Kienle S, Schwarz J, Schmidt G, Neumann T, Johnstone R, Mohammed AK, Hamon C. Anal Chem. 2003;75:1895–1904. doi: 10.1021/ac0262560. [DOI] [PubMed] [Google Scholar]
- 46.Dayon L, Hainard A, Licker V, Turck N, Kuhn K, Hochstrasser DF, Burkhard PR, Sanchez JC. Anal Chem. 2008;80:2921–2931. doi: 10.1021/ac702422x. [DOI] [PubMed] [Google Scholar]
- 47.Schwartz JC, Syka JEP, Quarmby ST. 53rd ASMS Conference on Mass Spectrometry; San Antonio, TX. 2005. [Google Scholar]
- 48.Cunningham C, Glish GL, Burinsky DJ. J Am Soc Mass Spectrom. 2006;17:81–84. doi: 10.1016/j.jasms.2005.09.007. [DOI] [PubMed] [Google Scholar]
Associated Data
This section collects any data citations, data availability statements, or supplementary materials included in this article.


