Abstract
Two squaraine (SQ) dyes, N-propanesulfonate-benzothiazolium squaraine (SQ-1) and N-propanesulfonate-benzoindolium squaraine (SQ-2), were synthesized with sulfonate groups to increase water solubility. Both dyes are almost nonfluorescent in aqueous solution with fluorescent quantum yields of 0.03, but exhibited fluorescence enhancement after noncovalently binding with bovine serum albumin (BSA). Upon addition of BSA, the fluorescence intensity increased by ca. a factor of 10, along with a 10-fold extension in the fluorescence lifetime. SQ-1 and SQ-2 interacted with BSA efficiently and appeared to show a preference for binding at site II, which involves combinational effects of electrostatic and hydrophobic interactions. The fluorogenic squaraine dyes were then used to label BSA, forming BSA-based nanoparticles (NPs) through noncovalent binding. The resulting BSA-SQ NPs exhibited enhanced near-IR fluorescence and reduced aggregation of the squaraine moiety. The BSA-SQ NPs were used for cell incubation and bioimaging studies. Confocal fluorescent images were obtained for HCT 116 cells incubated with the BSA-SQ NPs and LysoSensor Green, demonstrating the utility of the NP probes for intracellular imaging. This strategy ovecomes the generally low fluorescence emission of SQ dyes in water and aggregation-reduced fluorescence, providing a versatile strategy for sensing and imaging in biological environments.
Keywords: squaraine dyes, near-IR-emitting, fluorogenic, BSA nanoparticles, fluorescence bioimaging
Introduction
Serum albumin is the major protein in blood plasma and is well known for its ability to bind and to transport various ligands to specific sites, both exogenous and endogenous. This unique ligand-delivery property benefits from two major binding sites of serum albumins, namely, site I and site II.1,2 Both binding sites are structurally selective; noncovalent binding at site I is primarily driven by hydrophobic forces, while a combination of hydrophobic and electrostatic interactions are involved when small molecules bind at site II.3 Bovine serum albumin (BSA) is one of the most widely used serum albumins and has been employed as a model structure for studies of protein morphology and drug delivery, since serum albumin conjugates can enhance the solubility of hydrophobic drugs in plasma and play an important role in modulating drug delivery in biological environments.4 Nanoparticles (NPs) made of albumins garnered interest recently as carriers to encapsulate hydrophobic drugs as well. After a breakthrough in the clinical application of albumin NPs for breast cancer treatment, albumin NPs have been extensively studied as nano-scale medicine delivery systems.5,6 Compared to other NPs, the biodegradable and biocompatible albumin NPs are less toxic and easier to make, simply by water-in-oil emulsion7 or desolvation method8,9 followed by cross-linking with glutaraldehyde.10
Since proteins play very important roles in biological systems, there is growing interest in developing probes that can noncovalently bind and show fluorescent response to individual proteins. Several fluorescent compounds have been synthesized and used as detection reagents of proteins in solution, such as cyanine dyes,11,12 ruthenium complex,13 conjugated malononitrile,14 and squaraine dyes.15,16 These dyes exhibited “turn on” fluorescence intensity and increased life-time, which was explained by changes in the environment due to protein micro-encapsulation. In addition, the exploration of fluorescent protein labels may contribute to the development of imaging materials, which are expected to recognize and sense cellular analytes.17,18
For instance, the labeling molecule may contain reactive anchors for chemical conjugation to the biomolecules of interest. Alternatively, fluorescent labels may noncovalently bind with biomolecules in a process that involves a combination of hydrophobic, electrostatic, and/or hydrogen bonding interactions, resulting in the formation of a stabilized complex. Although the noncovalent interactions are normally weaker than chemical bond linkage, they generally occur at a faster rate and in a physiological pH range. When the noncovalent binding constant is large and the stoichiometry of the complex is known, purification steps are usually unnecessary.19 Moreover, noncovalent fluorescent labels are usually encapsulated by the biomolecules, shielded from quenchers that are abundant in biological environments, thus adding stability advantages while reducing the tendency to form fluorescence-quenching aggregates.
The squaraine family is a group of interesting organic chromophores, the backbone of which is a resonance stabilized zwitterionic structure. Squaraine dyes were studied extensively in the 1990s, and such research covered numerous areas, ranging from synthesis and mechanisms to physical and photophysical properties.20-22 Normally, their absorption and emission spectra lie in the visible red and near-IR regions; as for fluorescence imaging studies, they are typically outside the self-absorption and autofluorescence regions of biological matrices.23 These unique chemical and physical properties of squaraine molecules have led to studies of their application as near-IR fluorescent chromophores and environmental sensors,24 for bioimaging and biochemical labeling,25-28 chromo/fluorogenic probes,29 pH responsive probes,30 and metal ion recognition.31-33 Despite optical advantageous, studies using squaraine dye as chromophores for bioimaging are scarce.23,26,27,34-36 The low fluorescence quantum yield in aqueous solution as well as the strong tendency to form aggregates21 hinders the performance of this potentially important class of materials. To address this problem, encapsulation of squaraine dyes with rotaxanes25,26 and mesoporous silica nanoparticles36 has been developed to provide protection of the squaraine core and inhibit aggregation.
Herein, we report the synthesis of benzothiazolium and benzoindolium squaraine dyes with sulfonate pendants to enhance water solubility. The difference of heterocyclic conjugates provides a means to tune the absorption and emission wavelengths, as well as aggregation behavior in aqueous solution. Both squaraine dyes exhibit a preference for binding with site II of BSA with a high association constant. After noncovalent binding with BSA, enhancement of fluorescent intensity, quantum yield, and extended fluorescent lifetime was observed. The BSA-SQ complex also showed reduced tendency toward aggregation along with enhanced stability. In order to show the potential applications of using squaraine dyes as a noncovalent near-IR protein labeling reagent, BSA-squaraine nanoparticles (BSA-SQ NPs) were synthesized from the complex of BSA-SQ with particle size ca. 100 nm, and the BSA-SQ NPs were then utilized in cell incubation and imaging studies.
Experimental Section
Materials and methods
Squaric acid and 2-methylbenzothiazole were purchased from Alfa Aesar, and 1,1,2-trimethylbenz[e]indole was purchased from Fluka. 1,3-Propanesultone was purchased from TCI. 5-Dimethylamino-1-naphthalenesulfonamide (DNSA) and dansylproline (DP) were purchased from BroadPharm and were used without further purification. All solvents were used as received from commercial suppliers. Doubly distilled water was employed in all studies. 1H and 13C NMR spectra were recorded on an NMR spectrometer at 500 and 125 MHz, respectively. MS analyses were performed at the University of Florida. Melting points are uncorrected. Particle sizes of BSA-SQ NPs were analyzed by the light-scattering method using Zetasizer Nano-ZS90 (Malvern Instruments).
Linear absorption was measured using an Agilent 8453 UV-vis spectrophotometer. Fluorescence spectra were measured with a PTI Quantamaster spectrofluorimeter, which was equipped with a photomultiplier tube (PMT) detector. Emission spectra were corrected for the spectral sensitivity of the PMT. Emission spectra were used for calculation of the relative fluorescence quantum yield, using cresyl violet (ΦFL = 0.54) as a reference.37 Lifetime measurements were performed using a tunable Ti:sapphire laser system with pulse duration ~200 fs/pulse, and repetition rate of 76 MHz. The laser beam was linearly polarized and oriented at the magic angle. For the lifetime measurements, a band-pass filter was placed in front of an avalanche photodiode detector (APD), allowing the collection of suitable emission wavelengths. Data were acquired with a time-correlated single photon counting system (PicoHarp300) with time resolution ≈ 80 ps.
Synthesis of 3-(2-methylbenzo[d]thiazol-3-ium-3-yl)propane-1-sulfonate
This compound was obtained as reported in the literature.38 In general, 2-methylbenzothiazole (2.0 g, 13.4 mmol) was mixed with 1,3-propanesultone (1.2 mL, 13.4 mmol) in 6 mL of toluene. The solution was brought to reflux with a water condenser for 8 h. After cooling to room temperature, the precipitate was filtrated and washed with dichloromethane and diethyl ether, affording 2.3 g of off-white solid (63.2% yield); mp 284 – 286 °C (dec.). 1H NMR (500 MHz, DMSO-d6) δ: 8.43 (t, J = 8.8 Hz, 2H), 7.89 (m, 1H), 7.8 (m, 1H), 4.92 (t, 2H), 3.19 (s, 3H), 2.64 (t, J = 6.4 Hz, 2H), 2.16 (m, 2H).
N-Propanesulfonate-benzothiazolium squaraine (SQ-1)
A mixture of 3-(2-methylbenzo[d]thiazol-3-ium-3-yl)propane-1-sulfonate (1.0 g, 3.69 mmol) and squaric acid (210 mg, 1.84 mmol) in 8 mL toluene and 2mL pyridine was refluxed with a Dean-Stark apparatus for 3 h. Upon cooling, diethyl ether was added, and the resulting precipitate was collected by filtration. The resulting solid was purified by recrystallization in methanol twice, yielding 800 mg of SQ-1 product as blue solid (54% yield); mp 261-263 °C (dec.). 1H NMR (500 MHz, DMSO-d6) δ: 8.93 (d, 4H), 8.58 (m, 2H), 8.06 (m, 4H), 7.91 (d, 2H), 7.74 (d, 2H), 7.47 (t, 2H), 7.30 (m, 2H), 5.92 (s, 2H), 4.43 (m, 4H), 2.61 (m, 4H), 2.02 (m, 4H). 13C NMR (125 MHz, DMSO-d6) δ: 178.45, 159.16, 142.72, 140.93, 127.36, 126.55, 124.24, 121.94, 112.73, 84.97, 48.48, 47.72, 44.73, 23.34. HRMS (ESI) theoretical [M-2C5H6N]2− = 309.0135, [M-2C5H6N+Na]− = 641.0312, found [M-2C5H6N]2− = 309.0140, [M-2C5H6N+Na]− = 641.0321.
Synthesis of 3-(1′,1′,2′-trimethyl-1′ H-3′-benz[e]indolio)propanesulfonate
The compound was obtained as previously reported.39 In summary, 1,1,2-trimethyl-1H-benz[e]indole (2.0 g, 9.56 mmol) was mixed with 1,3-propanesultone (1 mL, 11.17 mmol) in 10 mL of p-xylene. The solution was brought refluxed for 6 h. After cooling to room temperature, the precipitate was filtered and washed with dichloromethane and diethyl ether, resulting in 2.1 g yellow solid was (66% yield); mp 273-275 °C (dec.). 1H NMR (500 MHz, DMSO-d6) δ: 8.35 (d, J = 8.3 Hz, 1H), 8.24 (m, 3H), 7.77 (t, J = 8 Hz, 1H), 7.71 (t, J = 8 Hz, 1H), 4.77 (t, J = Hz, 2H), 2.93 (s, 3H), 2.66 (t, J = 6.4 Hz, 2H), 2.21 (m, 2H), 1.75 (s, 6H).
N-Propanesulfonate-benzoindoilum squaraine (SQ-2)
A mixture of 3-(1′,1′,2′-trimethyl-1′ H-3′-benz[e]indolio)propanesulfonate (1.5 g, 4.52 mmol) and squaric acid (250 mg, 2.19 mmol) in 10 mL n-butanol and 3mL pyridine was refluxed with a Dean-Stark apparatus for 5 h. Upon cooling, diethyl ether was added, and the resulting precipitate was collected by filtration. Purification by recrystallization in methanol three times gave 708 mg of SQ-2 product as green solid (36% yield); mp 283-285 °C (dec.). 1H NMR (500 MHz, DMSO-d6) δ: 8.89 (d, 4H), 8.50 (t, 2H), 8.22 (m, 2H), 8.00 (m, 8H), 7.83 (d, 2H), 7.62 (d, 2H), 7.45 (m, 2H), 5.90 (s, 2H), 4.37 (t, 4H), 2.61 (t, 4H), 2.08 (m, 4H), 1.97 (s, 6H). 13C NMR (125 MHz, DMSO-d6) δ: 196.69, 139.19, 137.38, 133.27, 130.98, 130.48, 128.93, 127.70, 123.83, 113.80, 55.57, 47.85, 24.42, 21.88, 13.92. HRMS (ESI) theoretical [M-2C5H6N]2− = 369.1040, [M-2C5H6N+Na]− = 761.1973, found [M-2C5H6N]2− = 369.1044, [M-2C5H6N+Na]− = 761.1965.
Synthesis of dye-encapsulated BSA NPs (BSA-SQ NPs)
BSA was labeled with squaraine dyes SQ-1 and SQ-2 by combining them together in water (3:1 molar ratio of BSA to SQ). BSA NPs were prepared by the desolvation technique.40 BSA (~ 20 mg/mL) was combined with the SQ dye (~ 0.1 mg/mL) in DI-water and stirred for 1 h at room temperature. The pH of the mixture was then adjusted to 7.4 using 0.01 M NaOH. Under constant stirring at 500 rpm, acetone was added continuously to the mixture at a rate of 0.5 mL/min until the solution became turbid. Then, 20 μL of 8% glutaraldehyde solution was added, and the BSA particles with SQ labels formed during desolvation were crosslinked. After 24 h incubation at room temperature under continuous stirring, the resultant NPs were purified three times by centrifugation and re-dispersed in DI-water in an ultrasonication bath. The solution was filtered before use,41 and the concentration of the BSA-SQ was determined via UV-vis spectrophotometry using the molar absorptivity (BSA-SQ-1 ε660 = 1.6 × 10⁵ M−1 cm−1 and BSA-SQ-2 ε675 = 2.1 × 10⁵ M−1 cm−1).
Cytotoxcity assay
HCT 116 cells (America Type Culture Collection, Manassas, VA) were placed in 96 well plates and incubated until there were no fewer than 6 × 10³ cells per well for the cytotoxicity assays. After that, the cells were incubated at different concentrations of BSA-SQ NPs for an additional 20 h. Next, 10 μL of CellTiter 96 Aqueous One solution reagent was added into each well and incubated for 4 h. The relative cell viability, incubated with BSA-SQ NPs and a control for untreated cells, was determined by measuring the MTS-formazan absorbance on a microplate reader at 490 nm. All absorbance values were subtracted from the blank volume from a cell-free control. The results are given from the average of the three individual experiments.
Cell incubation and fluorescence microscopy imaging
For bioimaging studies, HTC 116 cells were placed onto poly-D-lysine-coated glass coverslips, and the cells were incubated for 48 h in order to grow a suitable amount for imaging. After that, the cells were incubated with BSA-SQ NPs at a concentration of 10 μM for 1 h; the incubation growth medium was made by diluting BSA-SQ NPs stock solution with PBS buffer. For the co-staining experiment, HTC 116 cells were incubated with a mixture of BSA-SQ NPs and Lysosensor Green (Invitrogen). After the incubation with dyes, the cells were washed three times using PBS buffer and then fixed using 3.7% formaldehyde solution for 15 min. NaBH4 solution in PBS (1 mg/mL, pH = 8.0) was added to each well for 15 min, followed by washing with PBS and water again. Finally, glass coverslips were mounted on glass slides using Prolong Gold (Invitrogen) mounting media for microscopy imaging. Fluorescence images were obtained using a Leica TCS SP5 II laser-scanning confocal microscope. For BSA-SQ NPs, cells were excited at 622 nm, and fluorescence emission was collected at longer wavelengths. A confocal pinhole was applied for better image quality.
Results and Discussion
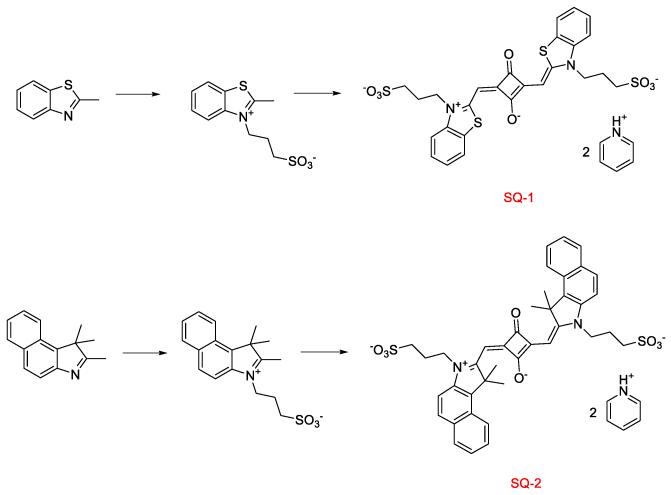
The squaraine dyes were synthesized by condensation reactions between squaraic acid and according sulfonate inner salt, 3-(2-methylbenzo[d]thiazol-3-ium-3-yl)propane-1-sulfonate and 3-(1′,1′,2′-trimethyl-1′ H-3′-benz[e]indolio)propanesulfonate, as shown in Scheme 1. The sulfonate pendants in the molecules were incorporated to enhance water solubility and play an important role when forming complexes with BSA through electrostatic interactions. Molecular structures of the SQ dyes structures were confirmed by 1H NMR, 13C NMR, and HRMS.
Scheme 1.
Synthesis route for preparation of SQ-1 and SQ-2.
Interactions of squaraines with BSA
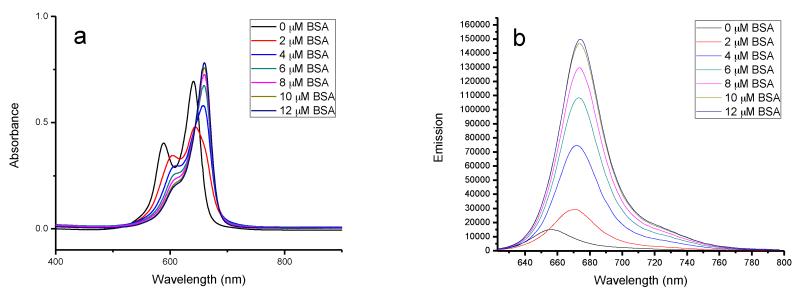
The absorption and emission of squaraine dyes are sensitive to the environment.24 Both absorption and emission spectra of squaraine dyes exhibit large changes in the presence of BSA, characterized by red shifts in wavelength. In the case of SQ-1, the initial absorption contains a monomer peak at 641 nm and a dimer peak located at a shorter wavelength (590 nm). The addition of BSA decreased absorption corresponding to both the monomer and dimer at first. However, continuous addition resulted in a gradual increase in absorption intensity with a new band at 660 nm (Figure 1a). When the concentration of BSA and SQ dyes reached the ratio of 2:1, the absorption of dimer completely disappeared. According to changes observed in absorption spectra, the noncovalently binding strength of SQ-1 with BSA was strong enough to cause dissociation of dimer aggregates with aggregation tendency highly reduced after the formation of the BSA-SQ-1 complex. Figure 1b shows the corresponding changes in fluorescence spectra of SQ-1 with increasing BSA concentration. Increasing the concentration of BSA resulted in corresponding increase in fluorescence intensity, and there was a red shift of the maximum emission wavelength from 656 to 674 nm. This significant change in fluorescence with increasing intensity and bathochromic shift of approximately 20 nm facilitated naked eye detection.
Figure 1.
Changes in the absorption (a) and emission (b) spectra of SQ-1 (5.0 μM) with addition of BSA. BSA concentration increased from 0 to 12 μM.
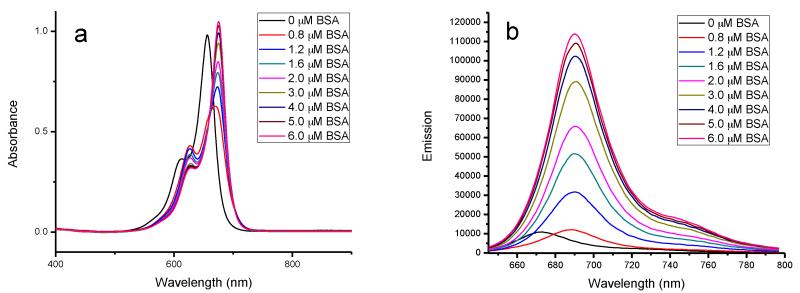
Similar to the behavior of SQ-1, SQ-2 exhibited the same tendency to conjugate with BSA (see Figure 2). In the initial state, when SQ-2 was dissolved in pure water, no dimer absorption was apparent in the absorption spectrum. This was probably due to the four methyl groups in the benzoindole structures, which hampered the aggregation of hydrophobic squaraine chromophore. The maximum absorption wavelength was 656 nm, which was 15 nm longer than that of the SQ-1 monomer. When BSA was added to the solution, the absorption spectra showed an initial decrease and then increased with a new absorbance appearing at 675 nm. Relative fluorescence intensities of SQ-2 increased with the addition of BSA until they reached a saturation point. Then, 5 μM of BSA was needed in order to saturate the fluorescence intensity of 5 μM SQ-2, resulting a 1:1 stoichiometry for the complex between SQ-2 and BSA. Compared to SQ-1, more BSA was needed to bring the fluorescence of 5 μM SQ-1 to saturation; this may be because extra BSA was required to dissociate SQ-1 dimers. Thus, SQ-2 exhibited higher association constants with BSA of 7.6 × 10⁷ M−1 compared to 6.2 × 10⁶ M−1 for the BSA-SQ-1 complex.
Figure 2.
Changes in the absorption (a) and emission (b) spectra of SQ-2 (5.0 μM) with addition of BSA. BSA concentration increased from 0 to 6 μM.
In order to gain a better understanding of the interaction between these squaraine dyes and BSA, time-resolved fluorescence studies were conducted. Table 1 shows the fluorescence quantum yields and lifetimes of SQ-1 and SQ-2 in the presence and absence of BSA. SQ-1 and SQ-2 exhibited very weak fluorescent and low quantum yield in the absence of BSA, whereas in the presence of BSA, these two squaraine dyes showed 10-fold emission enhancement. In addition, both dyes dissolved in water without BSA and exhibited similarly short lifetime of approximately 0.03 ns. However, after the introduction of BSA, the lifetime increased to 3.7 and 2.6 ns, respectively. The observed red shift and extended fluorescence lifetime after the introduction of BSA indicated environmental changes surrounding the squaraine chromophore, likely caused by the strong noncovalent interactions.
Table 1.
Photophysical properties of SQ-1 and SQ-2 in the presence and absence of BSA in aqueous solution. Absorption (λabs), fluorescence (λEm), Stokes shift (Δλ), fluorescence quantum yield (Φf), and fluorescence lifetime (τexp). Fluorescence quantum yields were calculated relative to cresyl violet as the reference standard in methanol (Φf = 0.52).
| Dyes | λabs (nm) | λEm (nm) | Δλ (nm) | Φ f | τexp (ns) |
|---|---|---|---|---|---|
| SQ-1 | 641 ± 1 | 652 ± 1 | 11 ± 2 | 0.03 ± 0.006 | 0.32 ± 0.08 |
| SQ-1 + BSA | 660 ± 1 | 669 ± 1 | 9 ± 2 | 0.27 ± 0.03 | 3.7 ± 0.2 |
| SQ-2 | 655 ± 1 | 668 ± 1 | 13 ± 2 | 0.03 ± 0.006 | 0.27 ± 0.08 |
| SQ-2 + BSA | 675 ± 1 | 684 ± 1 | 9 ± 2 | 0.24 ± 0.02 | 2.6 ± 0.1 |
Investigation of site-selective binding of squaraine dyes to BSA
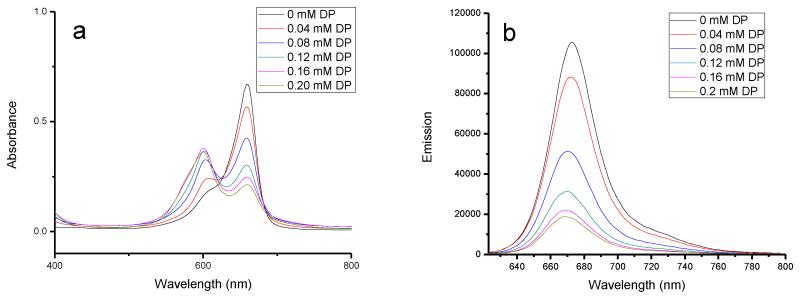
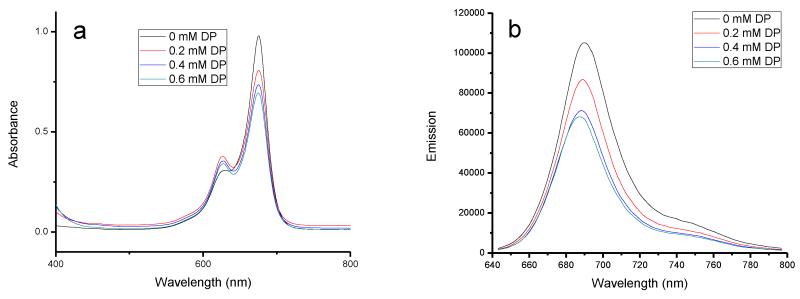
The complex formation and binding position between squaraine dyes and BSA were further studied by ligand displacement experiments; BSA site-specific binding reagents were used, dansylamide (DNSA) for site I selectivity and dansylproline (DP) for site II binding.15, 42, 43 When DP was added to a solution of the BSA-SQ-1 complex, a gradual decrease of the original absorption band at 660 nm resulted with an increase of a new band at 600 nm (Figure 3). Meanwhile, the emission intensity decreased gradually with an increase in DP concentration; an effective displacement of about 90% was achieved at 0.2 mM DP. However, the addition of DNSA had a lesser affect on both the absorption and emission of the BSA-SQ-1 complex (Supporting Information). Only approximately 10% effective displacement was found at a high concentration of DNSA. On the other hand, the BSA-SQ-2 complex exhibited similar properties; an effective displacement of 46% was achieved with increasing DP concentration (Figure 4), whereas DNSA showed only 17% displacement according to fluorescence intensity changes (Supporting Information). Titrations of DP and DNSA with SQ-1 and SQ-2 alone showed small changes in both absorption and emission spectra (Supporting Information), which indicate that the photophysical changes observed for BSA-SQ complexes were mainly caused by displacement of SQ dyes by the binding ligands DNSA and DP. The absorption and emission response of BSA-SQ complexes to the added ligands revealed that SQ-1 and SQ-2 could bind to both site I and site II of BSA, with preference to site II.
Figure 3.
Absorption and emission changes of SQ-1 (5 μM) complexes with BSA (10 μM), followed by the addition of DP. DP concentration increased from 0 to 0.2 mM.
Figure 4.
Absorption and emission changes of SQ-2 (5 μM) complexes with BSA (5 μM), followed by the addition of DP. DP concentration increased from 0 to 0.6 mM.
Characterization of SQ-BSA NPs
The BSA particles with SQ labels were prepared and crosslinked via a literature procedure, described in the Experimental Section.40 Particles sizes were analyzed by dynamic light scattering (DLS) using Zetasizer Nano-ZS90 (Malvern Instruments). The samples were measured at 25 °C and a scattering angle of 90°. Figure 5 shows the number-averaged particle size distribution results for BSA-SQ-1 and BSA-SQ-2 NPs. BSA-SQ-1 and BSA-SQ-2 NPs show similar size distribution results with average particle sizes of 90 and 130 nm, respectively. The absorption and emission of BSA-SQ NPs were measured, and the maximum intensity corresponded to that of the BSQ-SQ complex, with bathochromic shifts of 20 nm compared with SQ in aqueous solution without BSA (Supporting Information).
Figure 5.
BSA-SQ-1 NPs (left) and BSA-SQ-2 NPs (right) number-averaged particle size distribution measured by dynamic light scattering.
Cytotoxicity
Before using BSA-SQ NPs for potential protein tracking and bioimaging applications, biocompatibility was tested. A cytotoxicity assay was performed using the HCT 116 cell line (a common human colorectal cancer cell line). Since the squaraine dyes were noncovalently bound with BSA and were stabilized and shielded by a BSA pocket of through electrostatic and hydrophobic interactions, the toxicity should be low enough even at high concentrations of NPs. The concentrations of BSA-SQ NPs tested ranged from 1.56 to 25 μM, after 20 h incubation with cells, and the percentage of viable cells remained above 80% and 90% for BSA-SQ-1 NPs and BSA-SQ-2 NPs, respectively (Supporting Information).
Fluorescence microscopy imaging
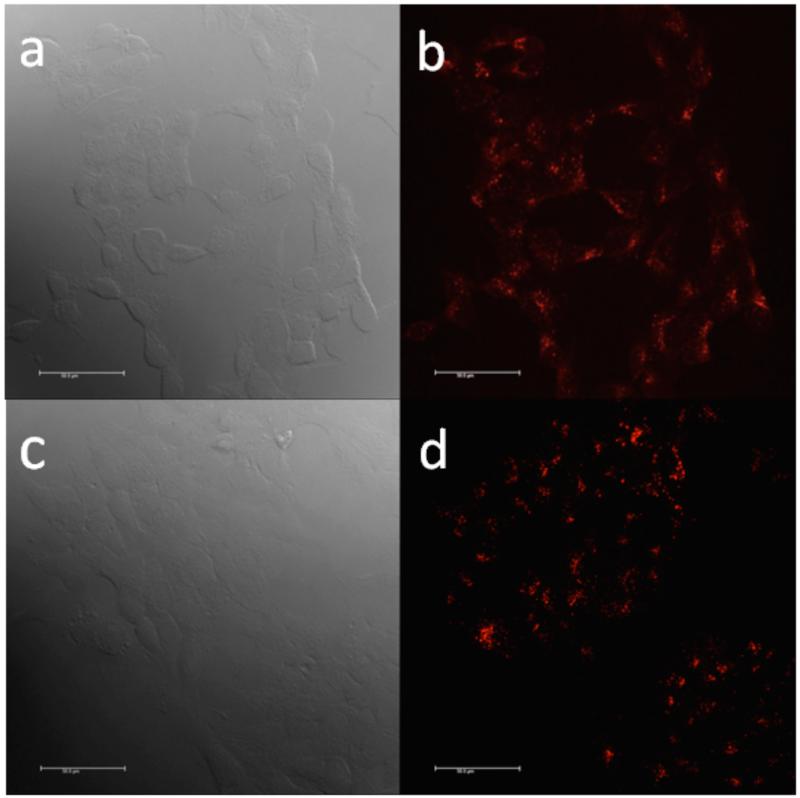
Uptake of the serium particles was conveniently monitored using fluorescence microscopy by determining the red fluorescence emitted from the cells that internalized the BSA-SQ NPs. HCT 116 cells were incubated with 10 μM of BSA-SQ NPs for 1 h, and, after fixing and washing, glass coverslips were mounted using Prolong Gold before imaging. For both BSA-SQ-1 and BSA-SQ-2 NP-incubated cells, the excitation wavelength was 622 nm, which largely avoids self-absorption and autofluorescence of biological specimens. Fluorescence images were collected at longer wavelengths from 640 to 750 nm using a band pass filter. Figure 6 shows the differential interference contrast (DIC) and fluorescence images of HCT 116 cells after incubation with BSA-SQ NPs.
Figure 6.
Images of HCT 116 incubated with 10 μM BSA-SQ-1 NPs, DIC (a), fluorescence microscopy imaging (b). Images of HCT 116 incubated with 10 μM BSA-SQ-2 NPs, DIC (c), fluorescence microscopy imaging (d). Scale bar is 50 μm.
Intracellular distribution of BSA-SQ nanoparticle tracking
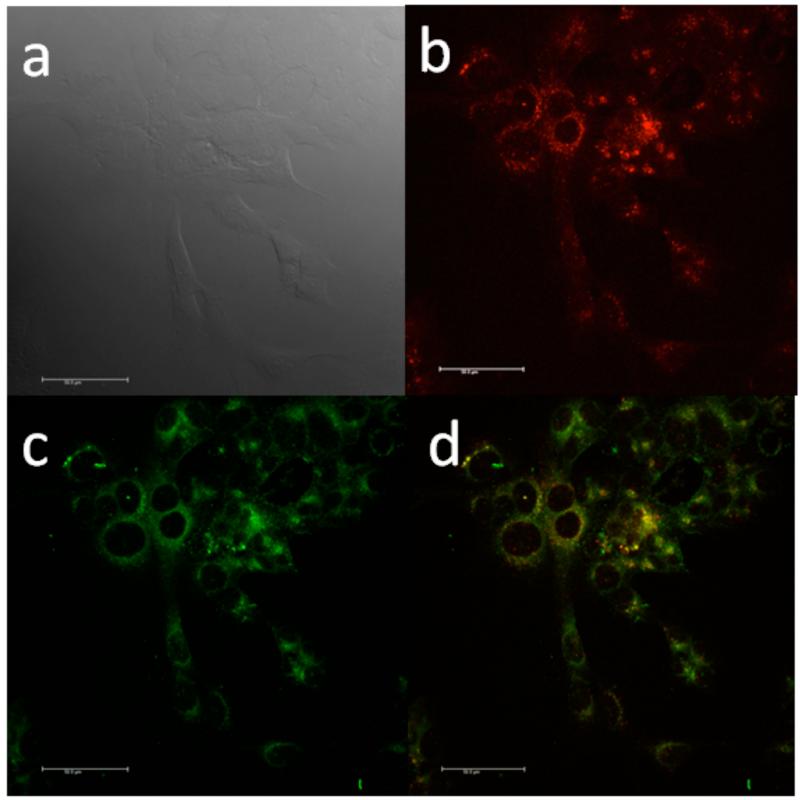
It is well known that serum proteins can accelerate the cellular uptake of nanoscale particles through receptor-mediated endocytosis.44 At the initial stage of this process, the exogenous nanoparticles are enclosed into endosomes, which later mature into late endosomes and end by fusing with lysosomes. For internalized proteins, late endocytic transportation delivers them to lysosomes for degradation.45Both BSA NPs9 and BSA-coated NPs46-50 have been reported to be uptaken by cells into the endosomes and/or lysosomes. To track the BSA-SQ NPs following their uptake, the lysosomal compartments of HCT 116 cells were stained with LysoSensor Green. Figure 7 shows, that after incubation with BSA-SQ-2 NPs for 1 h, large amounts of red fluorescent particles overlapped with LysoSensor-stained lysosomes (green color), as seen by the yellow areas in the merged images. A similar result was observed for BSA-SQ-1 NPs. Aafter uptake by cells, the BSA NPs localize in lysosomes (Supporting Information). The bright red to near-IR fluorescent micrographs collected from BSA-SQ NPs provides potential for in vivo protein tracking and bioimaging.
Figure 7.
Confocal fluorescence images of HCT 116 cells incubated with BSA-SQ-2 NPs (10 μM, 2 h) and LysoSensor Green (75 nM, 2 h). (a) DIC, (b) fluorescence image with BSA-SQ-2, (c) LysoSensor Green, & (d) colocalization imaging, overlay of (b) and (c). Scale bar is 50 μm.
Conclusions
In summary, two squaraine dyes, SQ-1 and SQ-2, were synthesized with sulfonate moieties with enhanced water solubility. SQ-2 with a benzoindolium structure processed longer absorption and emission wavelengths compared with benzothiazolium SQ-1. On the other hand, SQ-1 exhibited a stronger tendency to form a dimer aggregate in aqueous solution. Through noncovalent interactions with the biomacromolecule BSA, both squaraine dyes exhibited significant fluorescence enhancement and extended fluorescence lifetimes. This “fluorescence turn-on” is attributed to the change in environment after complexation with the BSA protein. Site-selective experiments show these squaraine dyes were binding to both site I and site II of BSA, with a preference to site II. BSA-SQ noncovalent complexes were used to make BSA NPs with an average particle size of ca. 100 nm. Capatalizing on the reduced tendency for aggregation and increased near-IR fluorescence intensity, BSA-SQ NPs were incubated with HCT 116 cells for imaging by fluorescence microscopy. To track the BSA-SQ NPs following their uptake by HCT 116 cells, lysosomal compartments of HCT 116 cells were costained with LysoSensor Green. Red to near-IR fluorescence was observed from BSA-SQ particles, characteristic of the BSA-SQ nonconvalent conjugates that overlapped nicely with LysoSensor Green in the lysosomes. These two water-soluble squaraine dyes act as fluorogenic sensing agents with BSA through noncovalent interactions, showing their potential application as a near-IR protein-labeling reagent for protein tracking and, potentially, in vivo imaging.
Supplementary Material
Acknowledgments
We wish to acknowledge the National Science Foundation (CHE-0832622), the US National Academy of Sciences (PGA-P210877), and the National Academy of Sciences of the Ukraine (grants 1.4.1.B/153 and VC/157), and the National Institute of Biomedical Imaging and Bioengineering of the National Institutes of Health (1 R15EB008858-01).
Footnotes
Supporting Information Available:
1H NMR and 13C NMR spectra for compounds SQ-1 and SQ-2 and intermediates, picosecond time resolved fluorescence decay profiles of the SQ-1 and SQ-2 in the absence and presence of BSA, absorption and emission spectra of titrations of DP and DNSA with SQ-1 and SQ-2, cytotoxicity of BSA-SQ-1 and BSA-SQ-2 NPs, confocal fluorescence images of HCT 116 cells incubated with BSA-SQ-1 NPs (10 μM, 1 h) and LysoSensor Green (75 nM, 1 h). This material is available free of charge via the Internet at http://pubs.acs.org/.
References
- (1).He XM, Carter DC. Nature. 1992;358:209–215. doi: 10.1038/358209a0. [DOI] [PubMed] [Google Scholar]
- (2).Krenzel ES, Chen Z, Hamilton JA. Biochemistry. 2013;52:1559–1567. doi: 10.1021/bi301458b. [DOI] [PubMed] [Google Scholar]
- (3).Jiménez MC, Miranda MA, Vayá I. J. Am. Chem. Soc. 2005;127:10134–10135. doi: 10.1021/ja0514489. [DOI] [PubMed] [Google Scholar]
- (4).Kratz F. J. Controlled Release. 2008;132:171–183. doi: 10.1016/j.jconrel.2008.05.010. [DOI] [PubMed] [Google Scholar]
- (5).Rhaese S, Briesen HV, Rbsamen-Waigman H, Kreuter J, Langer H. J. Controlled Release. 2003;92:199–208. doi: 10.1016/s0168-3659(03)00302-x. [DOI] [PubMed] [Google Scholar]
- (6).Hawkins MJ, Soon-Shiong P, Desai N. Adv. Drug Delivery Rev. 2008;60:876–885. doi: 10.1016/j.addr.2007.08.044. [DOI] [PubMed] [Google Scholar]
- (7).Trotta M, Chirio D, Cavalliand R, Peira E. Pharm. Res. 2004;21:1445–1449. doi: 10.1023/b:pham.0000036919.94865.57. [DOI] [PubMed] [Google Scholar]
- (8).Weber C, Coester C, Kreuter J, Langer K. Int. J. Pharm. 2000;194:91–102. doi: 10.1016/s0378-5173(99)00370-1. [DOI] [PubMed] [Google Scholar]
- (9).Xie L, Tong W, Yu D, Xu J, Li J, Gao C. J. Mater. Chem. 2012;22:6053, 6060. [Google Scholar]
- (10).Langer K, Balthasar S, Vogel V, Dinauer N, von Briesen H, Schubert D. Int. J. Pharm. 2003;257:169–180. doi: 10.1016/s0378-5173(03)00134-0. [DOI] [PubMed] [Google Scholar]
- (11).Szent-Gyorgyi C, Schmidt BF, Creeger Y, Fisher GW, Zakel KL, Adler S, Fitzpatrick JA, Woolford CA, Yan Q, Vasilev KV, Berget PB, Bruchez MP, Jarvik JW, Waggoner A. Nat. Biotechnol. 2008;26:235–240. doi: 10.1038/nbt1368. [DOI] [PubMed] [Google Scholar]
- (12).Zanotti KJ, Silva GL, Creeger Y, Robertson KL, Waggoner AS, Berget PB, Armitage BA. Org. Biomol. Chem. 2011;9:1012–1020. doi: 10.1039/c0ob00444h. [DOI] [PMC free article] [PubMed] [Google Scholar]
- (13).Berggren K, Steinberg TH, Lauber WM, Carroll JA, Lopez MF, Chernokalskaya E, Zieske L, Diwu Z, Haugland RP, Patton WE. Anal. Biochem. 1999;276:129–143. doi: 10.1006/abio.1999.4364. [DOI] [PubMed] [Google Scholar]
- (14).Suzuki Y, Yokoyama K. J. Am. Chem. Soc. 2005;127:17799–17802. doi: 10.1021/ja054739q. [DOI] [PubMed] [Google Scholar]
- (15).Jisha VS, Arun KT, Hariharan M, Ramaiah D. J. Am. Chem. Soc. 2006:6024–6025. doi: 10.1021/ja061301x. [DOI] [PubMed] [Google Scholar]
- (16).Xu Y, Li Z, Malkovshiy A, Sun S, Pang Y. J. Phys. Chem. B. 2010:8574–8580. doi: 10.1021/jp1029536. [DOI] [PubMed] [Google Scholar]
- (17).Que EL, Domaille DW, Chang CJ. Chem. Rev. 2008;108:1517–1549. doi: 10.1021/cr078203u. [DOI] [PubMed] [Google Scholar]
- (18).Thoumine O, Ewers H, Heine M, Groc L, Frischknecht R, Giannone G, Poujol C, Legros P, Lounis B, Cognet L, Choquet D. Chem. Rev. 2008;108:1565–1587. doi: 10.1021/cr078204m. [DOI] [PubMed] [Google Scholar]
- (19).Patonay G, Salon J, Sowell J, Strekowski L. Molecules. 2004;9:40–49. doi: 10.3390/90300040. [DOI] [PMC free article] [PubMed] [Google Scholar]
- (20).Law K-Y. Chem. Mater. 1992;4:605–611. [Google Scholar]
- (21).Chen H, Farahat MS, Law K-Y, Whitten DG. J. Am. Chem. Soc. 1996;118:2584–2594. [Google Scholar]
- (22).Liang K, Farahat MS, Perlstein J, Law K-Y, Whitten DG. J. Am. Chem. Soc. 1997;119:830–831. [Google Scholar]
- (23).Ahn H-Y, Yao S, Wang X, Belfield KD. ACS Appl. Mater. Interfaces. 2012;4:2847–2854. doi: 10.1021/am300467w. [DOI] [PMC free article] [PubMed] [Google Scholar]
- (24).McEwen JJ, Wallace KJ. Chem. Commun. 2009;6339 doi: 10.1039/b909572a. [DOI] [PubMed] [Google Scholar]
- (25).Johnson JR, Fu N, Arunkumar E, Leevy WM, Gammon ST, Piwnica-Worms D, Smith BD. Angew. Chem. Int. Ed. 2007;46:5528–5531. doi: 10.1002/anie.200701491. [DOI] [PMC free article] [PubMed] [Google Scholar]
- (26).Gassensmith JJ, Arunkumar E, Barr L, Baumes JM, DiVittorio KM, Johnson JR, Noll BC, Smith BD. J. Am. Chem. Soc. 2007;129:15054–15059. doi: 10.1021/ja075567v. [DOI] [PMC free article] [PubMed] [Google Scholar]
- (27).Wang W, Fu A, Lan J, Gao G, You J, Chen L. Chem. Eur. J. 2010;16:5129–5137. doi: 10.1002/chem.200903492. [DOI] [PubMed] [Google Scholar]
- (28).Thomas J, Sherman DB, Amiss TJ, Andaluz SA, Pitner JB. Bioconjugate Chem. 2007;18:1841–4846. doi: 10.1021/bc700146r. [DOI] [PubMed] [Google Scholar]
- (29).Ros-Lis JV, García B, Jinméez D, Martinez-Máñez R, Sancenón F, Soto J, Gonzalvo F, Valldecabres MC. J. Am. Chem. Soc. 2004;126:4064–4065. doi: 10.1021/ja031987i. [DOI] [PubMed] [Google Scholar]
- (30).Snee PT, Somers RC, Nair G, Zimmer JP, Bawendi MG, Nocera DG. J. Am. Chem. Soc. 2006;128:13320–13321. doi: 10.1021/ja0618999. [DOI] [PubMed] [Google Scholar]
- (31).Arunkumar E, Chithra P, Ajayaghosh A. J. Am. Chem. Soc. 2004;126:6590–6598. doi: 10.1021/ja0393776. [DOI] [PubMed] [Google Scholar]
- (32).Arunkumar E, Ajayaghosh A, Daub J. J. Am. Chem. Soc. 2005;127:3156–3164. doi: 10.1021/ja045760e. [DOI] [PubMed] [Google Scholar]
- (33).Hewage HS, Anslyn EV. J. Am. Chem. Soc. 2009;131:13099–13106. doi: 10.1021/ja904045n. [DOI] [PubMed] [Google Scholar]
- (34).Beverina L, Crippa M, Landenna M, Ruffo R, Salice P, Silvestri F, Versari S, Villa A, Ciaffoni L, Collini E, Ferrante C, Bradamante S, Mari CM, Bozio R, Pagani GA. J. Am. Chem. Soc. 2008;130:1894–1902. doi: 10.1021/ja075933a. [DOI] [PubMed] [Google Scholar]
- (35).Oushiki D, Kojima H, Takahashi Y, Komatsu T, Terai T, Hanaoka K, Nishiawa M, Takakura Y, Nagano T. Anal. Chem. 2012;84:4404–4410. doi: 10.1021/ac300061a. [DOI] [PubMed] [Google Scholar]
- (36).Sreejith S, Ma X, Zhao Y. J. Am. Chem. Soc. 2012;134:17346–17349. doi: 10.1021/ja305352d. [DOI] [PubMed] [Google Scholar]
- (37).Lakowicz JR. Principles of Fluorescence Spectroscopy. Springer; New York: 2006. [Google Scholar]
- (38).Ge Z, Li Y, Sun N, Wang S, Zhu D. Supramol. Chem. 2001;12:451–455. [Google Scholar]
- (39).Strekowski L, Mason CJ, Lee H, Gupta R, Sowell J, Patonay G. J. Heterocycl. Chem. 2003;40:913–916. [Google Scholar]
- (40).Li F-Q, Su H, Wang J, Liu J-Y, Zhu Q-G, Fei Y-B, Pan Y-H, Hu J-H. Int. J. Pharm. 2008;349:274–282. doi: 10.1016/j.ijpharm.2007.08.001. [DOI] [PubMed] [Google Scholar]
- (41).Jun JY, Nguyen HH, Paik S-Y-R, Chun HS, Kang B-C, Ko S. Food Chem. 2011;127:1892–1898. [Google Scholar]
- (42).Jisha VS, Arun KT, Hariharan M, Ramaiah D. J. Phys. Chem. B. 2010;114:5912–5919. doi: 10.1021/jp100369x. [DOI] [PubMed] [Google Scholar]
- (43).Xu Y, Malkovshiy A, Pang Y. Chem. Commun. 2011;47:6662–6664. doi: 10.1039/c1cc11355k. [DOI] [PubMed] [Google Scholar]
- (44).Zhao F, Zhao Y, Liu Y, Chang X, Chen C, Zhao Y. Small. 2011;7(10):1322–1337. doi: 10.1002/smll.201100001. [DOI] [PubMed] [Google Scholar]
- (45).Luzio JP, Pryor PR, Bright NA. Nat. Rev. Mol. Cell Biol. 2007;8:622–632. doi: 10.1038/nrm2217. [DOI] [PubMed] [Google Scholar]
- (46).Tkachenko AG, Xie H, Liu Y, Coleman D, Ryan J, Glomm WR, Shipton MK, Franzen S, Feldheim DL. Bioconjugate Chem. 2004;15:482–490. doi: 10.1021/bc034189q. [DOI] [PubMed] [Google Scholar]
- (47).Bale SS, Kwon SJ, Shah DA, Banerjee A, Dordick JS, Kane RS. ACS Nano. 2010;4(3):1493–1500. doi: 10.1021/nn901586e. [DOI] [PubMed] [Google Scholar]
- (48).Chithrani BD, Stewart J, Allen C, Jaffray DA. Nanomedicine. 2009;5:118–127. doi: 10.1016/j.nano.2009.01.008. [DOI] [PubMed] [Google Scholar]
- (49).Su S, Wang H, Liu X, Wu Y, Nie G. Biomaterials. 2013;34:3523–3533. doi: 10.1016/j.biomaterials.2013.01.083. [DOI] [PubMed] [Google Scholar]
- (50).Franchini MC, Baldi G, Bonacchi D, Gentili D, Giudetti G, Lascialfari A, Corti M, Marmorato P, Ponti J, Micotti E, Guerrini U, Sironi L, Gelosa P, Ravagli C, Ricci A. Small. 2010;6(3):366–370. doi: 10.1002/smll.200901689. [DOI] [PubMed] [Google Scholar]
Associated Data
This section collects any data citations, data availability statements, or supplementary materials included in this article.


