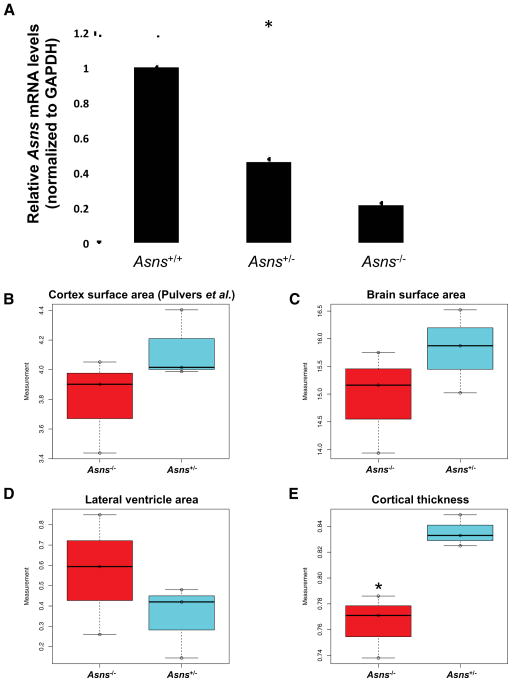
Figure 5. Asns deficient mice and structural brain abnormalities.
A. Detection of Asns mRNA (qRT-PCR) in the mouse brain. Four mice of each genotype were used (all between three and four months of age). The expression differences between the three genotypes are significant (*one-way ANOVA test P<0.00001). A post-hoc two-tailed t-test revealed both mutant genotypes were significantly different from wild type expression (PWT-ASNS(+/−) =0.00001, *PWT-ASNS(−/−)<0.00001) and significantly different from each other (*PASNS(+/−)-ASNS(−/−)=0.00083). Error bars represent SEM.
B–E. Measurements of adult mouse brain (P84) coronal sections, analyzed using Image J software(Rasband, 2008), comparing three homozygous mutants to heterozygous littermates. (B) Cortical surface area as measured in Pulvers et al. 2010. (C) Surface area of the left hemisphere of the brain section, (D) surface area of the lateral ventricle in the left hemisphere of the brain section, and (E) cortical thickness, measured from the edge of the hippocampus to the outer cortex. Asterisk (*) indicates a significant difference by an unpaired t-test (P=0.022).
See also Figures S3, S4, and S5.

