

Abstract
Indocyanine green (ICG) is an optical contrast agent commonly used for a variety of imaging applications. However, certain limitations of the free dye molecule, concerning its low stability, uncontrolled aggregation and lack of targeting ability, have limited its use. Presented here is a method of embedding ICG in a novel polymer/protein hybrid nanocarrier so as to overcome the above inherent drawbacks of the free molecule. The hybrid nanocarrier consists of a non-toxic and biocompatible polyacrylamide nanoparticle (PAA NP) matrix that incorporates human serum albumin (HSA). This nanocarrier was synthesized through pre-conjugation with HSA and amine functionalized monomer, followed by polymerization using biodegradable cross-linkers, in a water-in-oil emulsion. The ICG dye is loaded into the HSA conjugated PAA nanoparticles (HSA–PAA NPs) through post-loading. Compared to the PAA polymer matrix, the presence of hydrophobic pockets in the HSA–PAA NPs further increases the chemical and physical stability of ICG. This is manifested by lowering the chemical degradation rates under physiological conditions, as well as by improving the thermal- and photo-stability of the dye. A targeting moiety, F3–Cys peptide, was attached to the surface of the NPs, for selective delivery to specific cancer cell lines. The suitability of these NPs for optical imaging applications was demonstrated by performing fluorescence imaging on a rat gliosarcoma cell line (9L). We also present the photoacoustic response of the HSA–PAA NPs, used as imaging contrast agents, in the spectral window of 700 nm to 800 nm.
1. Introduction
Indocyanine Green (ICG) is a Food and Drug Administration (FDA) approved tricarbocyanine fluorescent dye; it is negatively charged and is extremely water soluble.1–5 It has an absorption and fluorescence maxima in the near infrared (NIR) region, at around 780 nm and 820 nm, respectively.6–8 The use of NIR radiation facilitates deep tissue imaging in vivo, due to good penetration of the NIR photons. Moreover, biological tissues have significantly reduced auto-fluorescence in the NIR region, which also leads to a much better signal to noise ratio (SNR) as compared to visible radiation.1, 5
ICG has been used as a contrast agent for fluorescence imaging (FI), which is one of the most commonly used medical imaging modalities, due to its simplicity, safety, high sensitivity, fast imaging speed, and capability to provide molecular level information9 (e.g. hepatic excretory function10, uterine blood flow11, lymph nodes in breast cancer12, atherosclerotic plaques13, retinal angiography9, 14, 15). Apart from its use in fluorescence imaging, which is a purely optical method, ICG is also a good contrast agent for the emerging method of photoacoustic imaging (PI).16, 17 PI is a non-invasive imaging technique that combines the advantages of both light and ultrasound. The acoustic waves are generated by the instantaneous thermal-elastic expansion in tissues due to the conversion of absorbed light energy into heat.18, 19 With its unique advantages of high optical contrast and excellent resolution in deep-lying tissue, PI holds promise for numerous medical applications.18–21
Although ICG is one of the most widely used contrast agents for FI and PI, its applications have often been limited due to its intrinsic drawbacks, such as: 1) it does not have specificity towards the target tissue;22 2) it aggregates to form dimers and oligomers, depending on the local dye concentration (dimers and oligomers at concentrations > 3.9 mg/L and J - aggregates at concentrations > 103 mg/L), leading to a reduction in signal intensity;5, 23 3) the “naked” dye gets degraded under enzymatic in vivo conditions, by losing its carbon-carbon double bond in its conjugated chain, which results in the formation of a colorless leuko form;2, 5, 24 4) in the blood circulatory system, ICG has a short circulation lifetime (t1/2 = 2–4 min), as it is rapidly bioeliminated through the kidneys;1, 22, 24 and 5) ICG shows lower fluorescence intensity with increasing temperature, making it more difficult to obtain strong signals under in vivo conditions, compared to room temperature.25
Recently, diverse approaches have been utilized to overcome the above mentioned disadvantages of ICG as an imaging contrast agent. Metallic particles such as gold and silver colloids have been used to enhance the fluorescence and photo-stability of ICG, utilizing the metal enhanced fluorescence (MEF) effect, which occurs due to the presence of surface plasmons on the noble metal surface.7, 26 It was also reported that biocompatible nanocarriers such as phospholipid–polyethylene glycol (PL–PEG), poly(lactic–co–glycolic acid) (PLGA) and organic modified silica (Ormosil) nanostructures have been utilized for the purpose of increasing the thermal- and photo-stability of ICG in aqueous solutions.22, 24, 27–29 In addition, specific targeting of ICG was accomplished by attaching targeting moieties to the surface of a carbon nanotube, acting as a nanocarrier, to increase the cellular uptake and obtain stronger contrast enhancement.16, 30
Here, a new kind of polymer/protein hybrid nanoparticle – a polyacrylamide nanoparticle (PAA NP) incorporated with human serum albumin (HSA), decorated with tumor-specific peptide on the surface – was developed as a tumor-targeting nanocarrier of ICG. HSA (66.5 kDa and d = 7 nm), the most abundant protein present in human blood, has a high affinity towards ICG through non-covalent bonding, resulting from electrostatic interactions, hydrophobic interactions and hydrogen bonding.31–33 The PAA NPs have been shown to be promising nanoplatforms for in vivo applications, such as sensing and drug delivery, for both diagnosis and therapy, due to their excellent biomedical properties and engineerability, including high aqueous solubility, small size, nontoxicity, biodegradability and easy surface modification with PEG, for longer circulation times, as well as with targeting moieties, for high targeting efficiency.19, 34–38 In addition, the PAA nanomatrix efficiently protects the encapsulated chromophore from external interference.39, 40 Due to these advantages, it has already been shown that loading of PAA NPs that include ICG into brain tumor cells can be used for tumor delineation purposes.41
We incorporated HSA into the PAA NPs so as to help overcome the drawbacks of free ICG dye molecule, while maximizing biocompatibility by keeping all the in vivo advantages of the PAA nanoparticles listed above. We report on (1) the optimized loading parameters of ICG into HSA–PAA NPs; (2) minimizing perturbations on the chemical and physical properties of ICG (i.e. reduced chemical degradation, and increased thermal- or photo-stability); (3) the use of ICG–HSA–PAA NPs for photoacoustic response; (4) the specific targeting capabilities of the NPs towards tumoric endothelial cells through fluorescence imaging.
2. Experimental methods
2.1 Materials
Materials
Indocyanine green (ICG), acrylamide (AA), acrylic acid N-hydroxysuccinimide ester (NAS) (≥ 90%), glycerol dimeathacrylate, mixture of isomers (85%) (GDMA), ammonium persulfate (APS), N,N,N′,N′-tetramethylethylenediamine (TEMED), sodium dioctylsulfosuccinate (AOT), Brij 30, dimethyl sulfoxide (DMSO), L-cysteine, and 3-(4,5-dimethylthiazolyl-2)-2,5-diphenyltetrazolium bromide (MTT agent), Phosphate buffered saline (BioReagent, pH 7.4, for molecular biology), fluorescein 5(6)-isothiocyanate (FITC), and hexane were purchased from Sigma-Aldrich. N-(3-aminopropyl)methacrylamide hydrochloride (APMA) was purchased from Polysciences. Coomassie protein assay kit and 8-well chambered coverglasses were purchased from Thermo Scientific. Ethanol (95%) were purchased from Fisher Scientific. F3–Cys peptide (KDEPQRRSARLSAKPAPPKPEPKPKKAPAKKC) was purchased from SynBioSci. The heterobifunctional PEG (MAL–PEG–NHS, 2 k) was purchased from Creative PEG Works. Six-well cell culture plates and 96-well microplates were purchased from BD Biosciences. Roswell Park Memorial Institute 1640 medium (RPMI), RPMI 1640 medium, no Phenol Red (colorless RPMI) and Dulbecco’s phosphate buffered saline (DPBS) were purchased form Life Technologies. The water was purified with a Milli-Q system from Millipore. All chemicals were used without further purification.
2.2 ICG loaded nanoparticle synthesis
Preparation of HSA–PAA NPs
The HSA–PAA NPs were prepared by reverse microemulsion polymerization adapted from our previous study involving PAA NPs synthesis.34 The monomer solution was prepared in two steps: 1) dissolving HSA (67 mg) in 1mL of PBS (pH 7.4) and then adding 0.3 mL of NAS (1.7 mg) to the HSA solution under stirring for 2 h at 37 °C; 2) adding AA (689.5 mg), APMA (53.6 mg) and then subsequently GDMA (85%, 360 μL), a cross-linker, to the mixture solution under stirring. This monomer solution was added to 45 mL of deoxygenated hexane that contained surfactants, AOT (1.6 g) and 3.3 mL of Brij 30 (3.1 g). After stirring the mixture under inert atmosphere for 20 min, 100 μL of TEMED and a freshly prepared 100 μL of APS (10%, w/v) were added to the mixture solution to initiate polymerization. The reaction mixture was stirred under inert atmosphere at room temperature. During the radical polymerization, the double bonds in monomer and cross-linker react with initiator or initiated monomers, resulting in a three dimensional polymer network. After 2 h, the solution was concentrated by rotary evaporator and the remaining residue subsequently suspended in ethanol. The reaction mixture solution was transferred into an Amicon Stirred Ultrafiltration Cells (200 mL, equipped with a Biomax 300,000 MWCO membrane) and washed thoroughly with ethanol and distilled water five times respectively. After washing and freeze-drying, 1.0 g (94%) of HSA–PAA NPs was obtained, (Scheme 1).
Scheme 1.
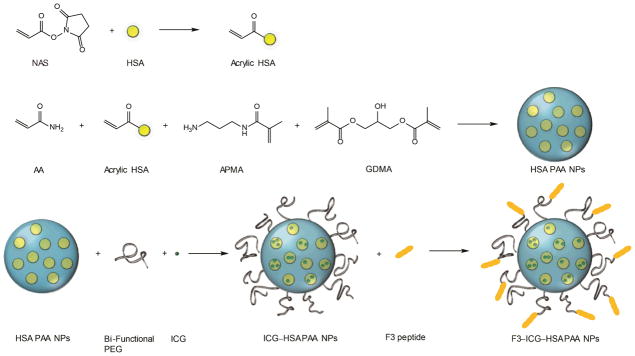
Synthesis of F3–(3% ICG)–HSA–PAA NPs
Preparation of ICG–HSA–PAA NPs
ICG stock solution (1 mg/mL) was prepared in purified water. HSA–PAA NP (50mg) was dissolved in 8.5 mL of pure water and stirred for 1 h at room temperature. 1.5 mL of ICG stock solution (1mg/mL) was added into nanoparticle solution and stirred during 2 h at room temperature. These ICG “post-loaded” NPs were rinsed with pure water (20 mL) by Amicon centrifugal cell (100 kDa). After washing, the NPs were freeze-dried and 42.7 mg of ICG–HSA–PAA NPs were obtained.
Preparation of F3–ICG–HSA–PAA NPs
HSA–PAA NPs (50 mg) were dissolved in 8.5 mL of PBS (pH 7.4) and stirred and sonicated until the solution became homogeneous. 4 mg of bi-functional PEG (MAL–PEG–SCM, 2k) was added into nanoparticle solution and stirred at room temperature. After 20 min, 1.5 mL of ICG solution (1 mg/mL in water) was added and stirred for another 10 min. The NPs solution was washed three times with PBS (pH 7.4) by Amicon centrifugal filter (100 kDa). After diluting the solution into a 5 mg/mL solution in PBS (pH 7.4), 7mg of F3–Cys peptide was added and the solution was stirred for 2 h at room temperature. To inactivate unreacted maleimide esters, 1.74 mg of L-cysteine was added to the solution and stirred for another 1 h. F3–(3% ICG)–HSA–PAA NPs were washed completely with water using Amicon centrifugal filter (100 kDa). After freeze-drying, 33.0 mg of F3–ICG–HSA–PAA NPs were obtained, (Scheme 1).
2.3 Characterization
Dynamic Light Scattering Measurement
The size and surface charge of the NPs were measured using dynamic light scattering (DLS) with a Delsa Nano C particle analyser (Beckman Coulter). For the size measurements, the HSA–PAA NPs solution was prepared in PBS (pH 7.4) (0.5 mg/mL), stirred for 1 h and sonicated for 5 min. For the surface charge measurements, the sample solution was prepared in pure water instead of PBS (pH 7.4). All the measurements were conducted in triplicate.
Absorbance & Fluorescence Measurement
To monitor the ICG–HSA–PAA NPs’ absorption spectrum, UV-1601 UV-vis spectrometer (Shimadzu) was used. A FluoroMax-3 Spectrofluorometer (Jobin Yvon Horiba) was used for fluorescence measurements. The ICG–HSA–PAA NPs solution was prepared (0.1 mg/mL) in PBS (pH 7.4). The measurements were conducted in triplicate.
Temperature dependent Fluorescence Test
Fluorescence spectra of 2 mL of (3% ICG)–HSA–PAA NPs, (3% ICG)–PAA NPs (0.1 mg/mL), and of naked ICG (0.00291 mg/mL) in PBS (pH 7.4), were measured at 25 °C. The temperature was then increased to 37 °C, in a temperature control chamber, and each sample was incubated for 5 min in the chamber. Any molecular degradation that might have occurred during this incubation period has been corrected, based on Figure 4(a). All measurements were conducted in triplicate.
Figure 4.
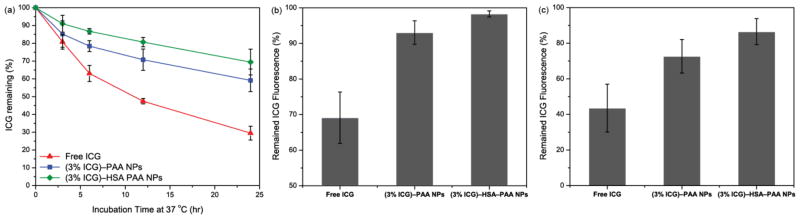
Advantages of dye encapsulation in HSA–PAA and PAA NPs. (a) Enhancement of ICG stability, under aqueous conditions at 37 °C, by PAA or HSA–PAA NPs. (b) Prevention of ICG fluorescence quenching, under physiological condition (37 °C) compared to room temperature (25 °C), by encapsulation in PAA or HSA–PAA NPs. (C) Enhancement of ICG photo-stability, under UV lamp illumination (240 nm) for 10 min, by encapsulation in PAA or HSA–PAA NPs.
Photo-stability Test
3 mL of (3% ICG)–HSA–PAA NPs, (3% ICG)–PAA NPs (0.1 mg/mL), and naked ICG (0.00291 mg/mL) in PBS (pH 7.4) were placed at 9 cm below an UV lamp (Spectroline EF-160C, 254 nm, 115 volts, 60 Hz, 0.2 Amps). These samples were exposed to UV light for 10 min at room temperature. The fluorescence spectra were obtained before and after the light exposure and compared.
Transmission Electron Microscopy (TEM)
The TEM image was obtained using a Philips CM-100 transmission electron microscope. The NP sample for TEM was prepared by dissolving 0.1 mg of (3% ICG)–HSA–PAA NPs in 1 mL of pure water. The NPs were stained with uranyl-acetate and imaged on carbon coated copper grids.
Coomassie Protein Assay
The amount of HSA in HSA–PAA NPs was analyzed by Coomassie protein assay. 30 μL of HSA–PAA NPs solution (10 mg/mL in PBS (pH 7.4)) was added into 1.5 mL of Coomassie protein assay solution. As a control sample, 30 μL of pure PBS (pH 7.4) was mixed with 1.5 mL of Coomassie protein assay solution. The absorbance of this mixture and that of the control were taken at 595 nm and the HSA amount was calculated from a calibration curve made with free HSA.
Photoacoustic Set-up and Measurement
A homemade photoacoustic imaging setup (Scheme 2) was employed to obtain the photoacoustic spectra from the ICG NPs. A tuneable optical parametric oscillator (OPO) (Vibrant B, Opotek) pumped by the second harmonic of a Nd:YAG laser (Brilliant B, BigSky), with a pulse duration of 10 ns, a tuning range of 700–800 nm, and a repetition rate of 10 Hz was used as the excitation source. This light was collimated and used to illuminate a transparent soft tubing (0.58 mm - BD Intramedic, Sparks, MD, USA), mimicking a blood vessel, containing the ICG NPs. The NPs were used at a concentration of 5 mg/mL. The OPO was used to illuminate ICG–HSA–PAA NPs flowing through soft tubing that mimics blood vessels. The light fluence was about 5 mJ/cm2, which is much lower than the ANSI standard limit of 30 mJ/cm2. A high-sensitivity, wide-bandwidth (132.63% at − 6 dB with a central frequency of 9.01 MHz) ultrasonic transducer, cylindrically focused with a focal length of 0.75 inch, was used to detect the photoacoustic signals emitted by the NPs. The photoacoustic signals received by the transducer were amplified and digitized using a 500 MHz digital oscilloscope (TDS, 540B, Tektronix), and subsequently transferred to a computer. Each data point was obtained by averaging of 30 signal measurements. A beam splitter was used to direct a small fraction of the beam from the OPO to a photodiode (Model 2031, Newport Corporation) for the monitoring of laser fluctuation. This served to normalize the measured photoacoustic signal intensities so as to take into account any errors due to the instability in the laser output power.
Scheme 2.
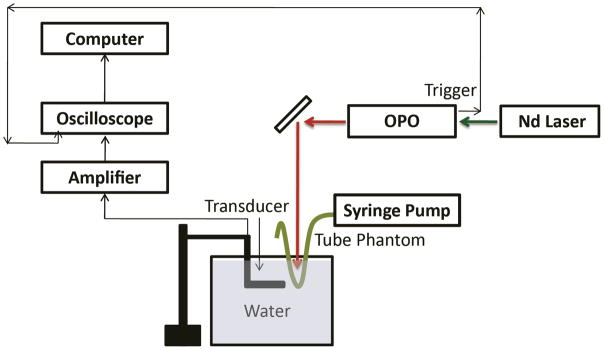
Homemade setup for photoacoustic image.
2.4 In vitro tests
Cell Culture
Two different cell lines, rat gliosarcoma cell line (9L) and human breast adenocarcinoma cell line (MCF-7) were cultivated in RPMI-1640 media with 10% heat inactivated fetal bovine serum (HI-FBS) and 1% Antibiotic-Antimycotic (100X). These cells were plated into 96 well plates for the cell viability assays and 8 well chambered slides for fluorescence imaging.
Cytotoxicity (CCK-8 Assay)
The cytotoxicity of the NPs was tested by the CCK-8 assay, which is based on the reduction of tetrazolium salt, WST-8, to a water soluble formazan dye by the dehydrogenase activity of viable cells.42 Approximately 5000 9L cells, in 100 μL of RPMI, were seeded on each well of a 96 well plate. The 25 μL of (3% ICG)–HSA–PAA NPs, HSA–PAA NPs and PAA NPs solution (10, 5, 2.5 and 1.25 mg/mL in PBS (pH 7.4)) were added into each well to prepare final NP concentrations of 2, 1, 0.5 and 0.25 mg/mL. Wells containing 9L cells without any NPs treatment served as the control. After 24 h incubation at 37 °C, the NP solutions were removed gently to avoid absorbance interference of ICG and/or phenol red with WST-8 formazan dye. CCK-8 stock solution (9% (v/v) CCK-8 in colorlesss RPMI, no phenol red) was then pipetted into each well (100 μL) and incubated for 4 h at 37°C. The amount of WST-8 formazan dye produced was analysed, by measuring absorbance at 492 nm, by an Anthos 2010 Microplate Absorbance Reader (Biochrom Ltd.).
Fluorescence Imaging
For fluorescence imaging, both 9L (F3 positive cell line) and MCF-7 cells (F3 negative cell line) were seeded into 8 well chambered slides. F3–(3% ICG)–FITC–HSA–PAA NPs, F3–(3% ICG)–FITC–PAA NPs and PEG–(3% ICG)–FITC–PAA NPs were added to each well to prepare a final concentration of 1 mg/mL in cell culture medium. After 30 min incubation, any unbound NPs were washed with DPBS three times, followed by addition of colorless RPMI. Confocal fluorescence images were obtained on a Leica Inverted SP5X Confocal Microscope System.
3. Results and discussion
3.1 Characterization of ICG–HSA–PAA NPs
Compared to traditional PAA NPs, the HSA–PAA NPs have a larger size, presumably due to the inclusion of HSA inside the NPs. The hydrodynamic size of PAA NPs was 63.3 (± 1.0) nm and the zeta potential was 25.2 (± 0.9) mV, as measured by DLS. For the HSA–PAA NPs, the size increased to 136.6 (± 15.4) nm, but the zeta potential was 26.1 (± 0.7) mV, similar to that of the PAA NPs. The negative charge of the HSA did not affect the overall surface charge, probably since most of the conjugated HSA were present inside the polymer matrix. After ICG post-loading, neither size nor zeta potential of the NPs changed much. The latter were recorded, respectively, as 67.3 (± 2.1) nm and 24.9 (± 0.5) mV for (3% ICG)–PAA NPs and as 133.1 (± 7.2) nm and 24.5 (± 0.7) mV for (3% ICG)–HSA–PAA NPs (Table 1). In addition to the hydrodynamic NPs size, we also monitored the dehydrated size of the NPs using TEM. The size of the dehydrated (3% ICG)–HSA–PAA NPs was around 48 nm (Figure 1). We note that the hydrogel matrix easily swells under aqueous conditions but shrinks back when it is dried, leading to a difference between the actual volume and the hydrodynamic volume.34 The amount of HSA in the NPs was determined by a Coomassie blue assay kit and 403.3 μg of HSA was incorporated in 10 mg of HSA–PAA NPs, which amounted to 4% (w/w) of loading in NPs. To achieve specific targeting, the NPs were attached to the F3 peptide by using a bi-functional PEG as crosslinker, which was conjugated to the primary amines in APMA prior to ICG loading. This order was chosen since if ICG is loaded in advance, the binding site, primary amine, can be blocked by post-loaded ICG.
Table 1.
Size and zeta potential of PAA and HSA–PAA NPs with 3% (w/w) ICG loading.
| Hydrogel Nanoparticles (NPs) | Size (nm) | Zeta Potential (mV) |
|---|---|---|
| PAA NPs | 63.3 (± 1.0) | 25.2 (± 0.9) |
| (3% ICG)–PAA NPs | 67.3 (± 2.1) | 24.9 (± 0.5) |
| HSA–PAA NPs | 136.6 (± 15.4) | 26.1 (± 0.7) |
| (3% ICG)–HSA–PAA NPs | 133.1 (± 7.2) | 24.5 (± 0.7) |
Figure 1.

TEM image of (3% ICG)–HSA–PAA NPs.
3.2 Optimization of ICG loading within HSA–PAA NPs
ICG has a tendency to aggregate and also leach out of the NP platform when it is loaded at high concentrations. To optimize the ICG loading into the NPs, different amounts of free ICG were loaded into HSA–PAA NPs. During the radical polymerization, ICG loses its double bond and is converted into a leuko form, preventing it from being preconjugated or encapsulated in the nanomatrix. Thus HSA–PAA NPs were loaded with ICG by the post-loading method, which is a quick and easy modification method which facilitates small scale reactions, compared to pre-conjugation or encapsulation. Up to 12% (w/w), ICG was loaded into the HSA–PAA NPs through post-loading modification that is free of any dye leaching.
We monitored the absorption spectra from the HSA–PAA NPs containing different amounts of ICG (Figure 2a). At lower ICG loading, we observe a strong absorbance around 780 nm which corresponds to the free ICG monomer. However, on increasing the amount of ICG, there was a marked increase in the absorbance at 720 nm, due to the formation of ICG dimers. We also compared the fluorescence from the ICG–HSA–PAA NPs’ for different ICG loadings (Figure 2b). Since the (3% ICG)–HSA–PAA NPs have the highest fluorescence signal, we used the 3% loading for all further experiments.
Figure 2.
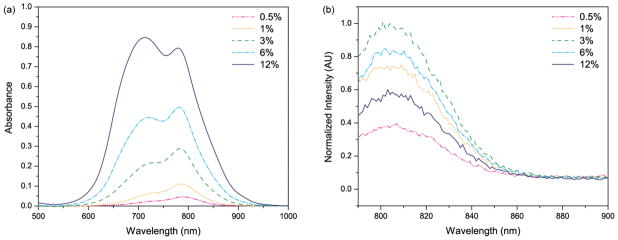
(a) Absorption spectra and (b) normalized fluorescence emission spectra of HSA–PAA NPs, using 780 nm excitation. The absorption and fluorescence measurements were taken with 0.1 mg/mL of 0.5–12% (w/w) ICG loaded HSA–PAA NPs in PBS (pH 7.4) buffer, showing spectral changes with different ICG loading.
3.3 In Vitro test results for toxicity
Polyacrylamide hydrogel is a nontoxic polymer and has been used extensively in biomedical applications.38, 43 The nontoxicity of PAA NPs was demonstrated in previous studies, for both in vitro and in vivo experiments.34, 39, 44 The ICG–HSA–PAA NPs are expected to be non-toxic since HSA is one of the constituents of human blood and ICG is already an FDA approved dye. To test the NP’s toxicity, we performed a cytotoxicity assay using a CCK-8 assay on the 9L cell line, with a variety of NPs concentration (0.25, 0.5, 1 and 2 mg/mL). All (3% ICG)–HSA–PAA, HSA3PAA and PAA NPs showed higher than 98% cell survival over the 24 h incubation time (Figure 3). This result demonstrates that the ingredients of ICG–HSA–PAA NPs do not cause any cytotoxicity.
Figure 3. Cytotoxicity of NPs in 9L cells.

Cell viability of (3% ICG)–HSA–PAA, HSA3PAA and PAA NPs at various concentrations (0.25, 0.5, 1, 2 mg/mL) was monitored after 24 h incubation with NPs by CCK-8 assay (n = 8). Control (100%) was 9L cells incubated for 24 h without NPs.
3.4 Stability enhancement of post-loaded ICG within HSA–PAA NPs
The ICG–HSA–PAA NPs were designed to further enhance the chemical stability of ICG over ICG–PAA NPs. The PAA NPs, like other nano carriers, such as silica, PL–PEG and PLGA NPs, help to increase chemical stability of the ICG dye since the dye is trapped inside the porous PAA nanomatrix, thus limiting accessibility of other chemicals, especially of the large enzymes.22, 27–29, 39 For HSA–PAA NPs, the HSA, with its hydrophobic cavities, binds strongly to the ICG molecules, thus offering greater stability to the ICG, compared to the HSA-less PAA NPs.45, 46
First, encapsulation in the HSA–PAA NPs helps to improve the stability of ICG in aqueous solution. The degradation rate of free ICG and ICG in different matrixes in PBS (pH 7.4) were monitored by measuring the absorbance of ICG at different time points. The free ICG solution showed fast degradation and only 30 (± 3.9) % of the dye remained intact after 24 h at normal body temperature, 37 °C. However, 59 (± 6.4) % and 69 (± 7.3) % of the ICG remained intact when encapsulated inside the PAA and HSA–PAA NPs, respectively, over the 24 h period, at 37 °C (Figure 4a).
Secondly, the HSA–PAA NPs also help to prevent the reduction of ICG fluorescence intensity due to rise in temperature, from 25 °C to 37 °C. For free ICG, we observed a 31% decrease in fluorescence intensity when the temperature was increased to 37 °C. The reduction in fluorescence can be attributed to faster diffusion of ICG at higher temperature, leading to an increased rate of collision with oxygen molecules, and thus increased quenching.25 However, the reduction in fluorescence intensity was only 7% and 2% for ICG in PAA NPs and HSA–PAA NPs, respectively (Figure 4b), due to the limited mobility in the matrix.
Lastly, the HSA–PAA NPs improve the photo-stability by preventing photo-degradation of the ICG dye. Photo-degradation is an irreversible process that leads to a loss in optical properties due to the breakdown of dye molecule into smaller fragments through oxidation processes.47 The photo-degradation renders the dye ineffective as a contrast agent, due to loss of colour, and also increases its photo-toxicity since ICG produces toxic products following photo-degradation.48 We observed significant reduction in the photo-degradation of the ICG dye in the (3% ICG)–HSA–PAA NPs, compared to the free dye. After 10 min UV lamp exposure at 254 nm, 87% and 73% of ICG remained intact in the HSA–PAA and PAA NPs, respectively, while only 44% of the free ICG remained intact (Figure 4c). It is well known that this photo-decomposition is caused by reaction of photo-excited ICG molecules with solvent radical species and ions.2 This protection from photo-decomposition by the NP platform could be attributed to the higher scattering cross section in the UV region of the spectrum and also limiting the interaction of the solvent radical species with the dye molecules compare to free ICG. Additionally, the hydrophobic pocket in HSA might prevent the interaction of radical ions and helps to further improve the photo-stability of ICG.
3.5 Photoacoustic response of ICG–HSA–PAA NPs
To demonstrate the feasibility of photoacoustic imaging using the NPs, we monitor the photoacoustic spectrum from ICG–HSA–PAA NPs (Scheme 2). The photoacoustic spectrum was monitored over the range of 700–800 nm (Figure 5). We observed two peaks at around 720 nm and 790 nm, which respectively correspond to the signals from the dimer and monomer forms of ICG. Interestingly, the signal peak corresponding to the dimer ICG is much stronger, as compared to the other peak corresponding to the monomer ICG. This is in contrast to the observed optical absorption spectrum of the NPs (Figure 2a), where the monomer peak showed a higher value than the dimer peak, at 3% loading, since the photoacoustic signal is generally proportional to the absorbance. This may be attributed to the higher fluorescence quantum yield for the ICG monomer, compared to its dimer form. For the ICG monomer, most of the energy is converted to fluorescence; whereas for the dimer form, most of the energy is converted to heat and subsequently to photoacoustic signal, due to the low fluorescence quantum yield. Thus we observed a higher photoacoustic signal at 720 nm than at 790 nm.
Figure 5.

Photoacoustic spectrum of (3% ICG)–HSA–PAA NPs (0.5 mg/mL) in PBS (pH 7.4).
3.6 In vitro cell targeting using fluorescence imaging
The fluorescence imaging of ICG–HSA–PAA NPs and ICG–PAA NPs, both in targeted (F3 conjugated) and non-targeted (PEG conjugated) forms, were performed using a Leica SP5X confocal microscope. Due to limited availability of appropriate light source and filters, we could not obtain clear ICG images. To overcome this limitation, we introduced FITC dye into the HSA–PAA NPs. FITC has a high fluorescence quantum yield and helped compliment the fluorescence signal from ICG, so as to determine the targeting efficiency, with very high accuracy, for each of the three NPs carrying ICG. To avoid leaching out, the FITC dye was pre-conjugated into the HSA–PAA and PAA NPs during NP synthesis, using a previously reported protocol, and then the ICG dye was post-loaded after conjugation of the targeting moiety, F3.34 The F3 peptide was used since it is a commercially available targeting moiety and has been reported to bind to the nucleolin receptors, which are overexpressed in some cancer cells.49, 50 To study the specific binding ability of the ICG carrier, three different NPs were prepared, including F3–(3% ICG)–FITC–HSA–PAA NPs, F3–(3% ICG)–FITC–PAA NPs and PEG–(3% ICG)–FITC–PAA NPs. All three types of NPs were loaded into 9L and MCF-7 cell lines and incubated for 30 min, at a 1 mg/mL concentration. The 9L cells (high expression of nucleolin receptors) were used as a positive control, and the MCF-7 cells (lower expression of nucleolin) as the negative control. The targeting efficiency of the NPs was calculated, based on the fluorescence intensity from the cells. We observed a 2.4 and 2.3 times higher binding efficiency in the 9L cell line, for F3–(3% ICG)–HSA–PAA NPs and F3–(3% ICG)–PAA NPs, respectively, compared to the MCF-7 cells (Figure 6). The PEG–PAA NPs were barely visible, indicating poor uptake of these NPs by both cell lines.
Figure 6.

Confocal images of F3 targeted selective delivery of ICG: A-a) F3–(3% ICG)–FITC–HSA–PAA NPs in 9L cells; A–b) F3–(3% ICG)–FITC–PAA NPs in 9L cells; A–c) PEG–(3% ICG)–FITC–PAA NPs in 9L cells; A–d) F3– (3% ICG)–FITC–HSA–PAA NPs in MCF-7 cells; A–e) F3–(3% ICG)–FITC–PAA NPs in MCF-7 cells; A–f) PEG–(3% ICG)–FITC–PAA NPs in MCF-7 cells; B) Relative cell specificity of F3 and ICG containing NPs, based on averaged fluorescence intensity of the FITC fluorescence confocal image (blue bar is for 9L and red bar is for MCF-7 cells). For quantification, the averaged background was subtracted from the intensity of the cell images.
4. Conclusions
In summary, a novel ICG nanocarrier based on a hybrid polyacrylamide matrix and HSA was developed, so as to effectively overcome the inherent drawbacks associated with the free ICG dye. This new type of NP carrier contains 40.3 μg of HSA per 1 mg of NPs, i.e. 4% (w/w) loading, with a size of 133.1 nm and surface charge of 24.5 mV. In vitro toxicity of the NPs was monitored at several concentrations, showing no significant biological toxicity. These NPs were modified by adding the contrast agent, ICG, and also the tumor targeting F3 peptides. The optimized ICG loading into NPs was found to be 3%, since at this loading, the NPs containing ICG have the strongest fluorescence intensity. The ICG–HSA–PAA NPs show an outstanding ability to protect the encapsulated ICG from (1) fast chemical degradation under aqueous conditions, (2) reduction in fluorescence at higher temperature, and (3) photo-degradation. The photoacoustic spectrum of ICG–HSA–PAA NPs showed two strong peaks, at 720 nm and 790 nm, in the NIR range. However, contrary to the absorbance and fluorescence spectra, the dimeric ICG form (720 nm) shows a stronger photoacoustic signal than the monomeric form of ICG (790 nm), due to the lower fluorescence quantum yield of the dimeric ICG form. Moreover, after successful modification with the targeting moiety, F3–Cys, these NPs showed high cell specific selectivity. We believe that this polymeric nanoparticle design could also be used as an efficient, biodegradable and biocompatible carrier for other kinds of fluorescent molecules, which could be of interest in important biomedical applications of fluorescence and photoacoustic imaging.51
Acknowledgments
This project is financially supported by NIH grants R01AR060350 and R01AR055179, and by NSFC grant no. 11028408. The authors thank to Hee-ju Ryu to help a preparation of NPs samples and Leshern Karamchand for helpful discussion.
Contributor Information
Xueding Wang, Email: xdwang@umich.edu.
Raoul Kopelman, Email: kopelman@umich.edu.
Notes and references
- 1.Yaseen MA, Yu J, Jung B, Wong MS, Anvari B. Molecular pharmaceutics. 2009;6:1321–1332. doi: 10.1021/mp800270t. [DOI] [PMC free article] [PubMed] [Google Scholar]
- 2.Saxena V, Sadoqi M, Shao J. Journal of pharmaceutical sciences. 2003;92:2090–2097. doi: 10.1002/jps.10470. [DOI] [PubMed] [Google Scholar]
- 3.Jung B, Anvari B. Biotechnology progress. 2012;28:533–539. doi: 10.1002/btpr.732. [DOI] [PubMed] [Google Scholar]
- 4.Berezin MY, Lee H, Akers W, Achilefu S. Biophysical journal. 2007;93:2892–2899. doi: 10.1529/biophysj.107.111609. [DOI] [PMC free article] [PubMed] [Google Scholar]
- 5.Kirchherr AK, Briel A, Mader K. Molecular pharmaceutics. 2009;6:480–491. doi: 10.1021/mp8001649. [DOI] [PubMed] [Google Scholar]
- 6.McCorquodale EM, Colyer CL. Electrophoresis. 2001;22:2403–2408. doi: 10.1002/1522-2683(200107)22:12<2403::AID-ELPS2403>3.0.CO;2-B. [DOI] [PubMed] [Google Scholar]
- 7.Malicka J, Gryczynski I, Geddes CD, Lakowicz JR. Journal of biomedical optics. 2003;8:472–478. doi: 10.1117/1.1578643. [DOI] [PMC free article] [PubMed] [Google Scholar]
- 8.Yu J, Yaseen MA, Anvari B, Wong MS. Chem Mater. 2007;19:1277–1284. [Google Scholar]
- 9.Alander JT, Kaartinen I, Laakso A, Patila T, Spillmann T, Tuchin VV, Venermo M, Valisuo P. International journal of biomedical imaging. 2012;2012:940585. doi: 10.1155/2012/940585. [DOI] [PMC free article] [PubMed] [Google Scholar]
- 10.Recknagel P, Claus RA, Neugebauer U, Bauer M, Gonnert FA. Journal of biophotonics. 2012;5:571–581. doi: 10.1002/jbio.201100118. [DOI] [PubMed] [Google Scholar]
- 11.Kisu I, Banno K, Mihara M, Lin LY, Tsuji K, Yanokura M, Hara H, Araki J, Iida T, Abe T, Kouyama K, Suganuma N, Aoki D. PloS one. 2012;7:e35124. doi: 10.1371/journal.pone.0035124. [DOI] [PMC free article] [PubMed] [Google Scholar]
- 12.Kitai T, Inomoto T, Miwa M, Shikayama T. Breast cancer. 2005;12:211–215. doi: 10.2325/jbcs.12.211. [DOI] [PubMed] [Google Scholar]
- 13.Vinegoni C, Botnaru I, Aikawa E, Calfon MA, Iwamoto Y, Folco EJ, Ntziachristos V, Weissleder R, Libby P, Jaffer FA. Science translational medicine. 2011;3:84ra45. doi: 10.1126/scitranslmed.3001577. [DOI] [PMC free article] [PubMed] [Google Scholar]
- 14.Fineman MS, Maguire JI, Fineman SW, Benson WE. Archives of ophthalmology. 2001;119:353–355. doi: 10.1001/archopht.119.3.353. [DOI] [PubMed] [Google Scholar]
- 15.Desmettre T, Devoisselle JM, Mordon S. Surv Ophthalmol. 2000;45:15–27. doi: 10.1016/s0039-6257(00)00123-5. [DOI] [PubMed] [Google Scholar]
- 16.de la Zerda A, Liu Z, Bodapati S, Teed R, Vaithilingam S, Khuri-Yakub BT, Chen X, Dai H, Gambhir SS. Nano letters. 2010;10:2168–2172. doi: 10.1021/nl100890d. [DOI] [PMC free article] [PubMed] [Google Scholar]
- 17.de la Zerda A, Bodapati S, Teed R, May SY, Tabakman SM, Liu Z, Khuri-Yakub BT, Chen X, Dai H, Gambhir SS. ACS nano. 2012;6:4694–4701. doi: 10.1021/nn204352r. [DOI] [PMC free article] [PubMed] [Google Scholar]
- 18.Ray A, Wang XD, Lee YEK, Hah HJ, Kim G, Chen T, Orringer DA, Sagher O, Liu XJ, Kopelman R. Nano Res. 2011;4:1163–1173. doi: 10.1007/s12274-011-0166-1. [DOI] [PMC free article] [PubMed] [Google Scholar]
- 19.Ray A, Rajian JR, Lee YE, Wang X, Kopelman R. Journal of biomedical optics. 2012;17:057004. doi: 10.1117/1.JBO.17.5.057004. [DOI] [PMC free article] [PubMed] [Google Scholar]
- 20.Wang LV. Nature photonics. 2009;3:503–509. doi: 10.1038/nphoton.2009.157. [DOI] [PMC free article] [PubMed] [Google Scholar]
- 21.Zhang Y, Hong H, Cai W. Cold Spring Harbor Protocols. 2011;2011:pdb.top065508. doi: 10.1101/pdb.top103. [DOI] [PMC free article] [PubMed] [Google Scholar]
- 22.Zheng X, Xing D, Zhou F, Wu B, Chen WR. Molecular pharmaceutics. 2011;8:447–456. doi: 10.1021/mp100301t. [DOI] [PubMed] [Google Scholar]
- 23.Mauerer M, Penzkofer A, Zweck J. J Photoch Photobio B. 1998;47:68–73. [Google Scholar]
- 24.Saxena V, Sadoqi M, Shao J. Journal of photochemistry and photobiology B, Biology. 2004;74:29–38. doi: 10.1016/j.jphotobiol.2004.01.002. [DOI] [PubMed] [Google Scholar]
- 25.Boddington S, Sutton EJ, Jones E, Purcell DD, Henning TD, Tavri S, Meier R, Sista A, Fu Y, Daldrup-Link H. Contrast media & molecular imaging. 2008;3:191–197. doi: 10.1002/cmmi.251. [DOI] [PubMed] [Google Scholar]
- 26.Geddes CD, Cao H, Gryczynski I, Gryczynski Z, Fang JY, Lakowicz JR. J Phys Chem A. 2003;107:3443–3449. doi: 10.1021/jp022040q. [DOI] [PMC free article] [PubMed] [Google Scholar]
- 27.Kim G, Huang SW, Day KC, O’Donnell M, Agayan RR, Day MA, Kopelman R, Ashkenazi S. Journal of biomedical optics. 2007;12:044020. doi: 10.1117/1.2771530. [DOI] [PubMed] [Google Scholar]
- 28.Quan B, Choi K, Kim YH, Kang KW, Chung DS. Talanta. 2012;99:387–393. doi: 10.1016/j.talanta.2012.05.069. [DOI] [PubMed] [Google Scholar]
- 29.Zheng C, Zheng M, Gong P, Jia D, Zhang P, Shi B, Sheng Z, Ma Y, Cai L. Biomaterials. 2012;33:5603–5609. doi: 10.1016/j.biomaterials.2012.04.044. [DOI] [PubMed] [Google Scholar]
- 30.De la Zerda A, Zavaleta C, Keren S, Vaithilingam S, Bodapati S, Liu Z, Levi J, Smith BR, Ma TJ, Oralkan O, Cheng Z, Chen X, Dai H, Khuri-Yakub BT, Gambhir SS. Nature nanotechnology. 2008;3:557–562. doi: 10.1038/nnano.2008.231. [DOI] [PMC free article] [PubMed] [Google Scholar]
- 31.Bunschoten A, Buckle T, Kuil J, Luker GD, Luker KE, Nieweg OE, van Leeuwen FW. Biomaterials. 2012;33:867–875. doi: 10.1016/j.biomaterials.2011.10.005. [DOI] [PMC free article] [PubMed] [Google Scholar]
- 32.Lim YT, Noh YW, Han JH, Cai QY, Yoon KH, Chung BH. Small. 2008;4:1640–1645. doi: 10.1002/smll.200800582. [DOI] [PubMed] [Google Scholar]
- 33.Naik PN, Chimatadar SA, Nandibewoor ST. Journal of photochemistry and photobiology B, Biology. 2010;100:147–159. doi: 10.1016/j.jphotobiol.2010.05.014. [DOI] [PubMed] [Google Scholar]
- 34.Hah HJ, Kim G, Lee YE, Orringer DA, Sagher O, Philbert MA, Kopelman R. Macromolecular bioscience. 2011;11:90–99. doi: 10.1002/mabi.201000231. [DOI] [PubMed] [Google Scholar]
- 35.Lee YE, Ulbrich EE, Kim G, Hah H, Strollo C, Fan W, Gurjar R, Koo S, Kopelman R. Analytical chemistry. 2010;82:8446–8455. doi: 10.1021/ac1015358. [DOI] [PMC free article] [PubMed] [Google Scholar]
- 36.Avula UM, Kim G, Lee YE, Morady F, Kopelman R, Kalifa J. Heart rhythm : the official journal of the Heart Rhythm Society. 2012;9:1504–1509. doi: 10.1016/j.hrthm.2012.05.011. [DOI] [PMC free article] [PubMed] [Google Scholar]
- 37.Wang S, Kim G, Lee YE, Hah HJ, Ethirajan M, Pandey RK, Kopelman R. ACS nano. 2012;6:6843–6851. doi: 10.1021/nn301633m. [DOI] [PMC free article] [PubMed] [Google Scholar]
- 38.Caulfield MJ, Qiao GG, Solomon DH. Chemical reviews. 2002;102:3067–3084. doi: 10.1021/cr010439p. [DOI] [PubMed] [Google Scholar]
- 39.Qin M, Hah HJ, Kim G, Nie G, Lee YE, Kopelman R. Photochemical & photobiological sciences : Official journal of the European Photochemistry Association and the European Society for Photobiology. 2011;10:832–841. doi: 10.1039/c1pp05022b. [DOI] [PMC free article] [PubMed] [Google Scholar]
- 40.Tang W, Xu H, Park EJ, Philbert MA, Kopelman R. Biochemical and biophysical research communications. 2008;369:579–583. doi: 10.1016/j.bbrc.2008.02.066. [DOI] [PMC free article] [PubMed] [Google Scholar]
- 41.Orringer DA, Koo YE, Chen T, Kim G, Hah HJ, Xu H, Wang S, Keep R, Philbert MA, Kopelman R, Sagher O. Neurosurgery. 2009;64:965–971. doi: 10.1227/01.NEU.0000344150.81021.AA. discussion 971–962. [DOI] [PMC free article] [PubMed] [Google Scholar]
- 42.Zhang Y, Wang L, Sun Y, Zhu Y, Zhong Z, Shi J, Fan C, Huang Q. ACS Appl Mater Interfaces. 2013;5:5291–5297. doi: 10.1021/am401153k. [DOI] [PubMed] [Google Scholar]
- 43.Christensen LH, Breiting VB, Aasted A, Jorgensen A, Kebuladze I. Plastic and reconstructive surgery. 2003;111:1883–1890. doi: 10.1097/01.PRS.0000056873.87165.5A. [DOI] [PubMed] [Google Scholar]
- 44.Nie G, Hah HJ, Kim G, Lee YE, Qin M, Ratani TS, Fotiadis P, Miller A, Kochi A, Gao D, Chen T, Orringer DA, Sagher O, Philbert MA, Kopelman R. Small. 2012;8:884–891. doi: 10.1002/smll.201101607. [DOI] [PubMed] [Google Scholar]
- 45.Trynda-Lemiesz L. Bioorgan Med Chem. 2004;12:3269–3275. doi: 10.1016/j.bmc.2004.03.073. [DOI] [PubMed] [Google Scholar]
- 46.Sulkowska A. J Mol Struct. 2002;614:227–232. [Google Scholar]
- 47.Verhoeven JW. Pure Appl Chem. 1996;68:2223–2286. [Google Scholar]
- 48.Engel E, Schraml R, Maisch T, Kobuch K, Konig B, Szeimies RM, Hillenkamp J, Baumler W, Vasold R. Invest Ophthalmol Vis Sci. 2008;49:1777–1783. doi: 10.1167/iovs.07-0911. [DOI] [PubMed] [Google Scholar]
- 49.Porkka K, Laakkonen P, Hoffman JA, Bernasconi M, Ruoslahti E. Proceedings of the National Academy of Sciences of the United States of America. 2002;99:7444–7449. doi: 10.1073/pnas.062189599. [DOI] [PMC free article] [PubMed] [Google Scholar]
- 50.Christian S, Pilch J, Akerman ME, Porkka K, Laakkonen P, Ruoslahti E. The Journal of cell biology. 2003;163:871–878. doi: 10.1083/jcb.200304132. [DOI] [PMC free article] [PubMed] [Google Scholar]
- 51.Zhang Y, Yang J. Journal of materials chemistry B, Materials for biology and medicine. 2013;1:132–148. doi: 10.1039/C2TB00071G. [DOI] [PMC free article] [PubMed] [Google Scholar]