Abstract
Proof-of-concept of vibrational photoacoustic tomography is demonstrated with a homebuilt Raman laser generating greater than 100 mJ of energy per pulse at 1197 nm wavelength. We employed this system for excitation of second overtone transition of C-H bonds. Vibrational photoacoustic signal from C-H rich polyethylene tube phantom placed under 3 cm thick chicken breast tissue was obtained with a signal to noise ratio of 2.5. Further, we recorded photoacoustic image of a polyethylene ring placed under 5 mm chicken tissue with excellent contrast. This development opens new opportunities of performing label free vibrational imaging in the deep tissue regime.
Keywords: Photoacoustic tomography, lipid, molecular vibration, Raman laser
As a molecular and functional imaging modality, photoacoustic tomography (PAT) has proved the imaging capability of several centimeters deep into biological tissues.1-4 In PAT, pulsed light is used to induce optical absorption inside a tissue by diffused photons. Part of the absorbed energy is converted into heat, which raises the temperature of the absorbed region on the order of mK. This sudden temperature change then creates pressure transients and subsequent generation of photoacoustic (PA) waves detectable by an ultrasonic transducer in real time. From the measured signal, the distribution of optical absorbers is reconstructed. Till now the contrast mechanism in PAT is mainly based on electronic absorption in near infrared region extending up to 950 nm. PAT imaging of hemoglobin5-7 and exogenous contrast agents such as dyes and nanoparticles8-11 has been reported. Inherent molecular vibration offers a contrast mechanism for chemical imaging in a label free manner. In vibrational microscopy based on either infrared absorption or Raman scattering, the imaging depth is limited to the ballistic photon mean free path, which is a few hundred microns in a biological sample. Owing to much weaker acoustic scattering in tissues as compared to optical scattering, photoacoustic detection of harmonic molecular vibration has enabled significant improvement in imaging depth.12-14 In this method, optical absorption is induced by overtone transitions at near infrared wavelengths, such as the second overtone transition of C-H bond occurring around 1200 nm.15 Upon excitation, this vibrational energy quickly turns into heat, which leads to bond-selective photoacoustic signals. Overtone transitions have been used for intravascular photoacoustic imaging of lipid accumulation.13, 16 In these studies,12-16 focused high-frequency ultrasonic transducers were used. The transducer was moved along a line or rotated about its own axis and the photoacoustic signals were required from the focused region. The image was then built by converting time into distance according to the speed of sound and signal amplitude into a color map. The image depth with a focused transducer was limited to its focused region, generally in the millimeter scale. Further, the imaging configuration, which is similar to photoacoustic microscopy, was limited to thin samples. Therefore, less energy per pulse illumination was required, which was possible through the use of existing laser sources.
Despite these advances, vibrational photoacoustic tomography, abbreviated as VPAT thereafter, is not yet demonstrated. Tomography uses unfocused transducer along with the unfocused light and is capable of obtaining centimeter scale depth information. A technical challenge for VPAT is the unavailability of laser source having sufficient energy for diffused photon excitation of entire object. The optical parametric oscillator currently used for PAT has been designed for excitation of hemoglobin and other contrast agents in wavelengths below 950 nm. Specifically, using Nd-YAG laser as the pump source, the wavelengths above 1064 nm are provided by the idler beam of the optical parametric oscillator at very low conversion efficiency.
In this letter, we report first VPAT system enabled by a homebuilt high energy Raman laser. The Raman laser works based on the principle of stimulated Raman scattering, which shifts the input laser frequency by the vibrational frequency of the crystal. Ba(NO3)2 crystal based Raman laser with maximum output energy of 21.4 mJ per pulse has been used for microscopic photoacoustic imaging of lipids.17 By using a larger Ba(NO3)2 crystal and no prior focusing of input laser, our new Raman laser is able to produce stable laser pulses at 1197 nm with maximum pulse energy exceeding 100 mJ. Since this wavelength falls within the second overtone vibrational band of C-H bond, C-H rich species can be imaged in tomography mode.
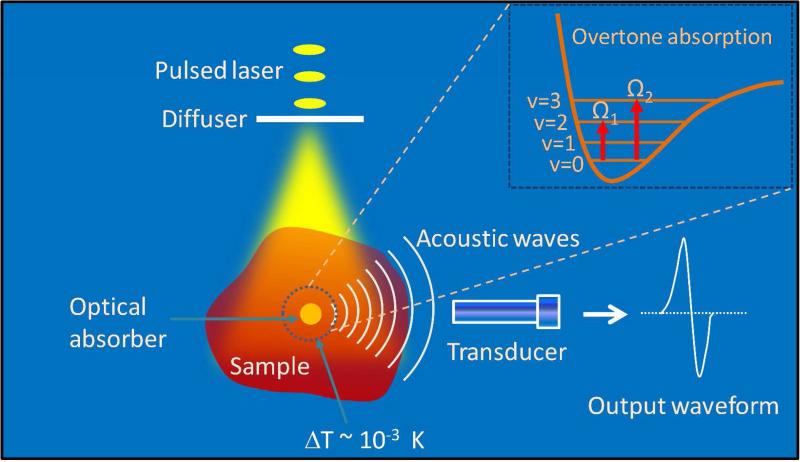
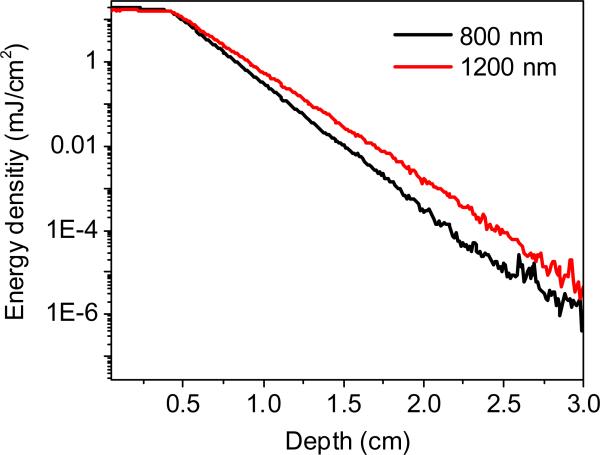
Fig. 1 shows the overtone vibrational absorption and photoacoustic wave generation processes. Vibrational absorption takes place when the incident photon frequency matches a transition frequency between the vibrational states (v). The nth overtone absorption takes place by transition from v = 0 to v = n, with n = 2, 3.... Unlike microscopy, in VPAT, the entire object is irradiated by the laser. Both the scattered and non-scattered photons contribute to the overtone absorption and subsequent generation of PA waves. Since the imaging depth is primarily determined by how deep the light can reach in a given sample, pulse energy of tens of mJ or more is required for an object of few cubic cm in size. To evaluate the effect of scattering and absorption on VPAT imaging depth, we estimated the photon energy density in deep tissue at 1200 nm by Monte Carlo simulations18 and compared it to that at 800 nm, where PAT imaging of blood is often performed. For the simulation, we considered a tissue with two layers, dermis of thickness 0.4 cm and subcutaneous tissue of varying thickness from 0 to 2.6 cm. Tissue optical parameters such as absorption and scattering coefficients were obtained from reference19 and a refractive index of 1.4 was assumed. The simulated energy density versus the depth is given in Fig. 2. It is seen that at 3.0 cm depth, the light fluence is reduced by ~8 orders of magnitude, suggesting the need for high energy laser to perform VPAT. Moreover, it is noted that the fluence for 1200 nm at 2.0 cm depth is 5 times higher than that for 800 nm. Such enhancement is due to lower scattering coefficients at longer wavelengths. Since the PA signal is proportional to light fluence, this result indicates that 1200 nm excitation is beneficial for deep tissue vibrational imaging.
Figure 1.
Signal generation and detection in vibrational photoacoustic tomography. v = 0, 1, 2 and 3 denote ground and excited vibrational states.
Figure 2.
Energy density (fluence) versus depth by Monte Carlo simulation on a tissue with a dermis layer (μa=0.11cm−1, μs'=2.18cm−1 at 800 nm & μa=0.13 cm−1, μs'=1.65 cm−1 at 1200 nm) and a subcutaneous layer (μa=1.07 cm−1, μs'=11.6 cm−1 at 800 nm & μa=1.06 cm−1, μs'=7.91cm−1 at 1200 nm).
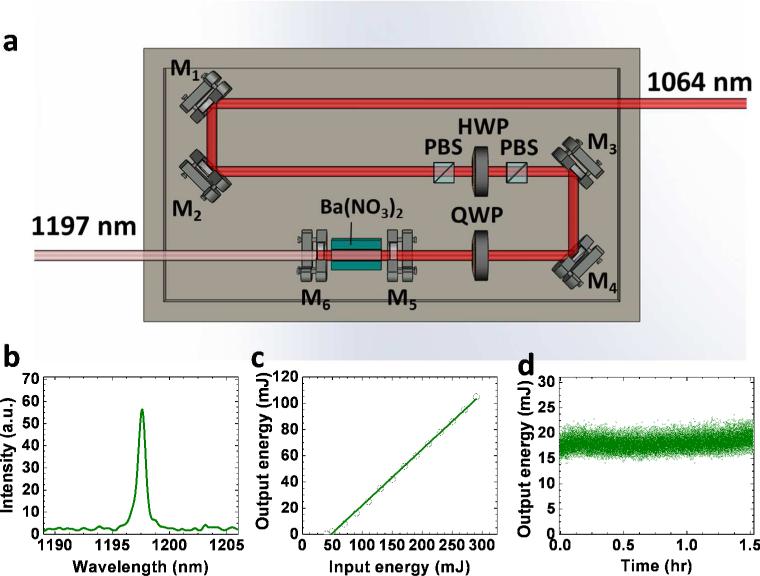
Schematic of our Raman laser is given in Fig. 3 (a). An 1064 nm Nd:YAG laser beam with 5 ns pulse width and 10 Hz repetition rate, after deflection by mirrors M1 and M2, passes through a polarizing beam splitter (PBS) to purify the polarization. Then it passes through a half wave plate and a second PBS. This combination is used to adjust the input pulse energy to obtain the desired output. After deflection by mirrors M3 and M4, the beam enters into the cavity through a quarter wave plate, which protects the Nd:YAG laser from perturbation by backscattered light. The laser cavity contains a Ba(NO3)2 crystal with size of 8×8×80 mm3 placed between mirrors M5 and M6. These mirrors were coated such that M5 has high reflectivity at 1197 nm and high transmission at 1064 nm and M6 has high reflectivity at 1064 nm and 40% transmission at 1197 nm.
Figure 3.
Setup and performance of the Raman laser. (a) Schematic; (b) Output spectral profile measured by a USB2000 spectrometer; (c) Output energy versus the input; (d) Output energy versus time. PBS: polarizing beam splitter. HWP: half wave plate. QWP: quarter wave plate.
The Raman laser outputs pulses with a narrow spectrum centered at 1197 nm as given in Fig. 3(b). Performance of the laser was tested by measuring the output energy versus the input energy. Also, the energy was monitored as a function of time to examine the long term stability. The plot of the output versus the input energy is given in Fig. 3(c). It is seen that, the output energy varies linearly with the input in the range from 50 to 290 mJ. With the input energy of 290 mJ, an output of 105 mJ was obtained at 1197 nm, corresponding to a conversion efficiency of 36%. Such efficiency is higher than current optical parametric oscillator technology by ~100 times at the specified wavelength. The Raman laser showed high stability over a time period of 1.5 hr as seen in Fig. 3(d). This stability is important to acquire high quality tomography images.
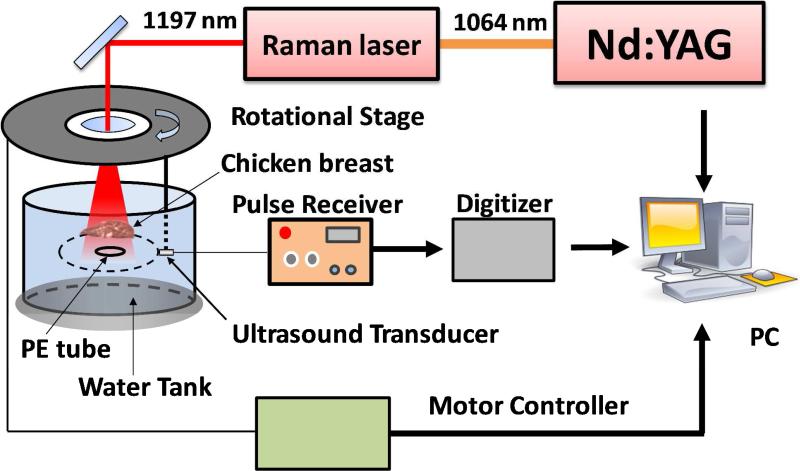
Schematic of our VPAT imaging system is given in Fig. 4. The 1197 nm laser output from the Raman laser delivering high energy pulses at 10 Hz was used to irradiate the sample. These laser pulses pass through the center hole of a computer controlled rotational stage before reaching the sample. An unfocused 10-MHz, 2-mm diameter ultrasonic transducer (XMS 310, Olympus NDT) attached to the rotational stage was used to receive the PA signal. The transducer and the sample were placed inside a water tank to provide acoustic coupling between them. The transducer output was connected to a 20 dB preamplifier followed by a pulser/receiver (5072PR, Panametrics NDT) with gain of 20 dB. Then it was sent into a data acquisition (DAQ) card, which was triggered by the Q-switch of the Nd:YAG laser. During imaging, the rotational stage was moved in steps around the sample in a circular path of radius 4.5 cm and the PA signal was acquired for each step until one complete revolution. A LabVIEW program was used to control the rotational stage and collect the data.
Figure 4.
Schematic of VPAT system. A single transducer rotating around the object was used to collect the PA signal. PE: polyethylene.
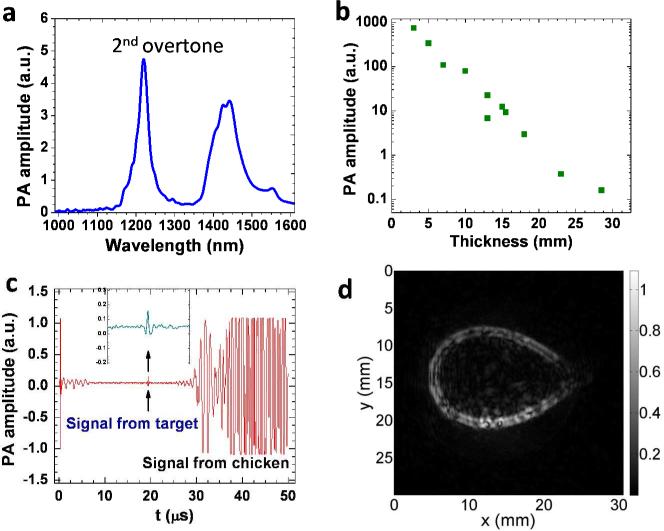
A phantom made of a polyethylene tube was used to demonstrate the proof-of-concept of VPAT. The tube has an outer diameter of 1.0 mm and an inner diameter of 0.6 mm. This material was selected because it is rich in C-H bonds, which is evident in the PA spectrum of polyethylene given in Fig. 5(a). In the spectral window shown here, there are two bands, one peaked at ~ 1200 nm and the other peaked at ~ 1440 nm. The first band centered at 1200 nm corresponds to the second overtone absorption of C-H bond stretching vibration. The wavelength of the Raman laser used in this study is within this absorption band. To explore the imaging depth limit, we performed one-dimensional PA measurements on a 3 mm long polyethylene tube sample. Fresh chicken breast tissue layer was placed above the sample to mimic the in vivo situation. Laser energy of 57 mJ/cm2 was sent to the sample through the chicken tissue layer. The layer thickness was varied and the corresponding PA signal from the sample was measured. Then, the peak to peak amplitude of the PA signal was estimated. The plot of which is given in Fig. 5(b). It shows a variation of more than three orders of magnitude in PA amplitude over 3 cm thickness range. The pattern of the plot follows a linear relationship in log scale which is reasonable based on the Beer's law. It should be noted that, even for a thickness of 3 cm, we could obtain signal from the target with a signal to noise ratio of 2.5 as shown Fig. 5(c). To obtain this data at 3 cm depth, we performed an average of 100 pulse excitations and a group of 20 data sets were taken and then averaged. For other depths, due to higher signal to noise ratio, averages of smaller number of pulses were carried out. Since part of the light was absorbed by the chicken tissue, there was also PA signal emanated from it, as marked in Fig. 5(c). The chicken tissue was placed at a distance from the polyethylene tube (Fig. 4), so that we could easily separate the two PA signals based on the time delay.
Figure 5.
VPAT imaging of a polyethylene tube placed under a chicken breast tissue. (a) PA spectrum of polyethylene; (b) PA signal amplitude versus chicken layer thickness; (c) PA signal with 3 cm thick chicken breast layer; (d) VPAT image of a polyethylene tube ring placed under a 5 mm chicken breast tissue.
Two dimensional VPAT imaging was performed with a phantom made out of the same polyethylene tube. Two ends of a piece of the tube were joined together by using an epoxy to form a ring shape. The ring was then placed approximately at the center of the circular path of the transducer by gluing it on a glass tube with epoxy. A 5 mm thick chicken breast layer was placed at a distance of 5 mm above the ring. Pulses from the Raman laser set at 80 mJ with a beam diameter of 1.0 cm irradiated the chicken tissue and illuminated the ring. The transducer was rotated in steps of 2° and the PA signal was collected for each step at a rate of 100 kHz, until a complete revolution. Ten pulses were averaged for each measurement. It took about 10 minutes for acquisition of a complete set of data. The image was then reconstructed using a modified back projection algorithm. 20 An image of the polyethylene ring obtained from the VPAT system is given in Fig. 5(d). The image showed a good contrast with undetectable background contributed by water at the wavelength of 1197 nm.
According to the ANSI safety standards, the maximum permissible exposure on skin in the near IR wavelength region is 100 mJ/cm2. 21 Although the laser wavelength used in this work is within that range, it is desirable to study whether it poses any serious harm to the cells in the tissues. Therefore, we performed a standard cell viability test using six well plates containing cultured human prostate cancer PC3 cells. Three of them were irradiated for 30 sec by 1197 nm laser pulses with 100 mJ/cm2 energy density. Immediately after irradiation, cells were stained by calcein and propidium iodide for 15 min and then imaged on a confocal microscope. Number of damaged cells and viable cells were counted, based on the staining by propidium iodide and calcein, respectively and we found no significant cell death. This result justifies the safety of such energy density for VPAT imaging.
In summary, we have demonstrated a vibrational photoacoustic tomography imaging system enabled by a high energy Raman laser at 1197 nm. Using this system, we have obtained vibrational photoacoustic signal from C-H rich polyethylene tube placed below 3 cm chicken breast tissue with input laser pulse energy well below the ANSI safety limit. VPAT image of polyethylene tube placed under 5 mm chicken tissue was achieved with excellent contrast. We note that the single element system in this study is slow in data acquisition as compared to linear array transducer being used for PAT or ultrasound imaging. Future work will focus on using linear arrays and commercially available ultrasound machine for in vivo imaging.
ACKNOWLEDGMENT
This work was supported by NIH R21 EB015901. The authors thank Junjie Li and Wei Wu for helping the cellular viability test.
REFERENCES
- 1.Kim C, Favazza C, Wang LHV. In Vivo Photoacoustic Tomography of Chemicals: High-Resolution Functional and Molecular Optical Imaging at New Depths. Chem. Rev. 2010;110:2756–2782. doi: 10.1021/cr900266s. [DOI] [PMC free article] [PubMed] [Google Scholar]
- 2.Gamelin J, Aguirre A, Maurudis A, Huang F, Castillo D, Wang LV, Zhu Q. Curved Array Photoacoustic Tomographic System for Small Animal Imaging. J. Biomed. Opt. 2008;13:024007. doi: 10.1117/1.2907157. [DOI] [PMC free article] [PubMed] [Google Scholar]
- 3.Kruger RA, Lam RB, Reinecke DR, Del Rio SP, Doyle RP. Photoacoustic Angiography of the Breast. Med. Phys. 2010;37:6096–6100. doi: 10.1118/1.3497677. [DOI] [PMC free article] [PubMed] [Google Scholar]
- 4.Piras D, Xia WF, Steenbergen W, van Leeuwen TG, Manohar S. Photoacoustic Imaging of the Breast Using the Twente Photoacoustic Mammoscope: Present Status and Future Perspectives. IEEE J. Sel. Top. Quant. 2010;16:730–739. [Google Scholar]
- 5.Laufer J, Delpy D, Elwell C, Beard P. Quantitative Spatially Resolved Measurement of Tissue Chromophore Concentrations Using Photoacoustic Spectroscopy: Application to the Measurement of Blood Oxygenation and Haemoglobin Concentration. Phys. in Med. and Biol. 2007;52:141–168. doi: 10.1088/0031-9155/52/1/010. [DOI] [PubMed] [Google Scholar]
- 6.Rajian JR, Girish G, Wang XD. Photoacoustic Tomography to Identify Inflammatory Arthritis. J. Biomed. Opt. 2012;17:096013. doi: 10.1117/1.JBO.17.9.096013. [DOI] [PMC free article] [PubMed] [Google Scholar]
- 7.Brecht HP, Su R, Fronheiser M, Ermilov SA, Conjusteau A, Oraevsky AA. Whole-Body Three-Dimensional Optoacoustic Tomography System for Small Animals. J. Biomed. Opt. 2009;14:064007. doi: 10.1117/1.3259361. [DOI] [PMC free article] [PubMed] [Google Scholar]
- 8.Kim JW, Galanzha EI, Shashkov EV, Moon HM, Zharov VP. Golden Carbon Nanotubes as Multimodal Photoacoustic and Photothermal High-Contrast Molecular Agents. Nat. Nanotechnol. 2009;4:688–694. doi: 10.1038/nnano.2009.231. [DOI] [PMC free article] [PubMed] [Google Scholar]
- 9.Zhang Q, Iwakuma N, Sharma P, Moudgil BM, Wu C, McNeill J, Jiang H, Grobmyer SR. Gold Nanoparticles as a Contrast Agent for in Vivo Tumor Imaging with Photoacoustic Tomography. Nanotechnology. 2009;20:395102. doi: 10.1088/0957-4484/20/39/395102. [DOI] [PubMed] [Google Scholar]
- 10.Taruttis A, Herzog E, Razansky D, Ntziachristos V. Real-Time Imaging of Cardiovascular Dynamics and Circulating Gold Nanorods with Multispectral Optoacoustic Tomography. Opt. Exp. 2010;18:19592–19602. doi: 10.1364/OE.18.019592. [DOI] [PubMed] [Google Scholar]
- 11.Akers WJ, Kim C, Berezin M, Guo K, Fuhrhop R, Lanza GM, Fischer GM, Daltrozzo E, Zumbusch A, Cai X, Wang LV, Achilefu S. Noninvasive Photoacoustic and Fluorescence Sentinel Lymph Node Identification Using Dye-Loaded Perfluorocarbon Nanoparticles. Acs Nano. 2011;5:173–182. doi: 10.1021/nn102274q. [DOI] [PMC free article] [PubMed] [Google Scholar]
- 12.Wang HW, Chai N, Wang P, Hu S, Dou W, Umulis D, Wang LHV, Sturek M, Lucht R, Cheng JX. Label-Free Bond-Selective Imaging by Listening to Vibrationally Excited Molecules. Phys. Rev. Lett. 2011;106:238106. doi: 10.1103/PhysRevLett.106.238106. [DOI] [PMC free article] [PubMed] [Google Scholar]
- 13.Jansen K, van der Steen AFW, van Beusekom HMM, Oosterhuis JW, van Soest G. Intravascular Photoacoustic Imaging of Human Coronary Atherosclerosis. Opt. Lett. 2011;36:597–599. doi: 10.1364/OL.36.000597. [DOI] [PubMed] [Google Scholar]
- 14.Allen TJ, Hall A, Dhillon AP, Owen JS, Beard PC. Spectroscopic Photoacoustic Imaging of Lipid-Rich Plaques in the Human Aorta in the 740 to 1400 nm Wavelength Range. J. Biomed. Opt. 2012;17:061209. doi: 10.1117/1.JBO.17.6.061209. [DOI] [PubMed] [Google Scholar]
- 15.Wang P, Rajian JR, Cheng J-X. Spectroscopic Imaging of Deep Tissue through Photoacoustic Detection of Molecular Vibration. J. Phys. Chem. Lett. 2013:2177–2185. doi: 10.1021/jz400559a. [DOI] [PMC free article] [PubMed] [Google Scholar]
- 16.Wang B, Karpiouk A, Yeager D, Amirian J, Litovsky S, Smalling R, Emelianov S. Intravascular Photoacoustic Imaging of Lipid in Atherosclerotic Plaques in the Presence of Luminal Blood. Opt. Lett. 2012;37:1244–1246. doi: 10.1364/OL.37.001244. [DOI] [PubMed] [Google Scholar]
- 17.Li R, Slipchenko MN, Wang P, Cheng J-X. Compact High Power Barium Nitrite Crystal-Based Raman Laser at 1197 Nm for Photoacoustic Imaging of Fat. J. Biomed. Opt. 2013;18:040502. doi: 10.1117/1.JBO.18.4.040502. [DOI] [PMC free article] [PubMed] [Google Scholar]
- 18.Wang LH, Jacques SL, Zheng LQ. Mcml - Monte-Carlo Modeling of Light Transport in Multilayered Tissues. Comp. Meth. Prog. Bio. 1995;47:131–146. doi: 10.1016/0169-2607(95)01640-f. [DOI] [PubMed] [Google Scholar]
- 19.Tuchin V. Tissue Optics: Light Scattering Methods and Instruments for Medical Diagnosis. SPIE Press; Bellingham, Washington, USA: p. 2007. [Google Scholar]
- 20.Wang XD, Xu Y, Xu MH, Yokoo S, Fry ES, Wang LHV. Photoacoustic Tomography of Biological Tissues with High Cross-Section Resolution: Reconstruction and Experiment. Med. Phys. 2002;29:2799–2805. doi: 10.1118/1.1521720. [DOI] [PubMed] [Google Scholar]
- 21.Laser Institute of America . American National Standard for Safe Use of Lasers Ansi Z136.1—2007. American National Standards Institute Orlando; FL: 2007. [Google Scholar]


