Abstract
A critical need has emerged for volumetric thermometry to visualize 3D temperature distributions in real time during deep hyperthermia treatments used as an adjuvant to radiation or chemotherapy for cancer. For the current effort, magnetic resonance thermal imaging (MRTI) is used to measure 2D temperature rise distributions in four cross sections of large extremity soft tissue sarcomas during hyperthermia treatments. Novel hardware and software techniques are described which improve the signal to noise ratio of MR images, minimize motion artifact from circulating coupling fluids, and provide accurate high resolution volumetric thermal dosimetry. For the first 10 extremity sarcoma patients, the mean difference between MRTI region of interest and adjacent interstitial point measurements during the period of steady state temperature was 0.85°C. With 1min temporal resolution of measurements in four image planes, this non-invasive MRTI approach has demonstrated its utility for accurate monitoring and realtime steering of heat into tumors at depth in the body.
Keywords: Non-Invasive Thermometry, Magnetic Resonance Temperature Imaging, Deep Hyperthermia, Radiofrequency Phased Array Heating
1. INTRODUCTION
The efficacy of hyperthermia for cancer therapy is dependent on delivery of well-controlled moderate heating (41-45°C) to entire tumor volumes without overheating surrounding critical normal tissues. As the complexity of heating technology has increased to provide more adjustable energy delivery, a critical need has emerged for volumetric thermometry to visualize the complete 3D temperature distribution. Our group is investigating the use of magnetic resonance thermal imaging (MRTI) for measuring 3D temperature distributions during hyperthermia treatment of extremity soft tissue sarcomas. Our current protocol uses a custom program that calculates temperature rise of tissue in multiple MR slices based on the proton resonance frequency shift (PRFS) technique. The extremity sarcomas are heated with a cylindrical 140MHz Mini Annular Phased Array (MAPA) applicator designed originally for heating leg tumors [1, 2]. Other applicators are under development for use in heating arm tumors, deep breast and chestwall tumors, and deep pelvic tumors.
This progress report starts with an overview of MR compatible applicators used to heat extremity soft tissue sarcomas at Duke University and the PRFS based magnetic resonance imaging procedure used to calculate temperature rise of multiple 2D cross sections through the heated region. Supplemental hardware and software techniques are described which improve the signal to noise ratio of MR images, minimize motion artifact from circulating coupling fluids, and provide volumetric thermal dosimetry. Finally, thermal dosimetry results are summarized for the first 10 patients of a clinical protocol to assess the feasibility of using MRTI for accurate monitoring and control of deep tissue Hyperthermia.
2. METHODS
2.1 RF Heating of Deep Tumors
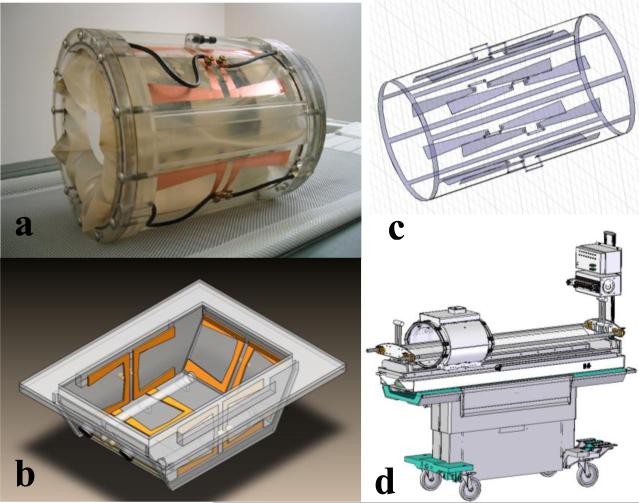
The primary applicator used for this study is a 23 cm inner diameter by 30 cm long cylindrical RF phased array applicator. It is intended for heating tumors located anywhere in an extremity that can be placed inside the cylinder. This mini-annular phased array (MAPA) applicator is shown in Fig. 1a. The four twin dipole antennas are driven with independent phase and amplitude signals at 140 MHz, allowing generation of a phase focus in the center of the array that can be shifted laterally by adjustment of relative phase of the four dipoles. For future expansion of treatment capabilities to other tumor sites, the twin dipole antennas of the MAPA applicator have also been implemented in the sides of a bowl shaped applicator suitable for treatment of tumors in intact breast. This applicator is shown diagrammatically in Fig. 1b. In recent work initiated at Duke University, the cylindrical phased array design was further modified to create a smaller diameter “arm applicator” that has 8 dipole antennas printed on the inside of a 16 cm diameter × 35 cm long plexiglass cylinder and a complete birdcage style MR coil printed on the outside of the shell. This integrated heating and MR imaging applicator design is shown in Fig. 1c and is intended for future clinical investigation at Duke University. The last RF device to be incorporated into the hyperthermia clinic at Duke is the SigmaEye MR applicator from BSD Corp (Salt Lake City UT), shown integrated into the GE MR patient bed in Fig. 1d. These applicators provide the ability to heat tumors at depth in arms, legs, breast, and deep pelvis. The current study presents early clinical results on clinical use of the 23 cm diameter MAPA applicator.
Figure 1.
Alternative MR compatible RF phased array applicators to be used at Duke University for heating deep tumors while monitoring temperature with MRTI.
a) 25 cm diameter waterbolus coupled four twin dipole mini-annular phased array applicator for extremity sarcomas, driven at 140 MHz
b) 5 antenna 140MHz phased array applicator for heating intact breast. Note silicone oil references inside the bolus for temperature insensitive MR signal to correct magnetic field drifts during the hour long treatments.
c) Hybrid arm applicator design with 8 dipole antennas at 140 MHz printed on the inside of a 18cm dia plexiglass cylinder and integrated birdcage coil printed on the outside of the plexiglass shell for simultaneous MR imaging
d) Sigma-Eye MR applicator design from BSD Corp. mounted on GE MR table with thermal mapping available to correlate with MRTI. Applicator has 3 rings of 4 twin dipoles driven at 100 MHz for axial and lateral adjustment of focal zone within the array.
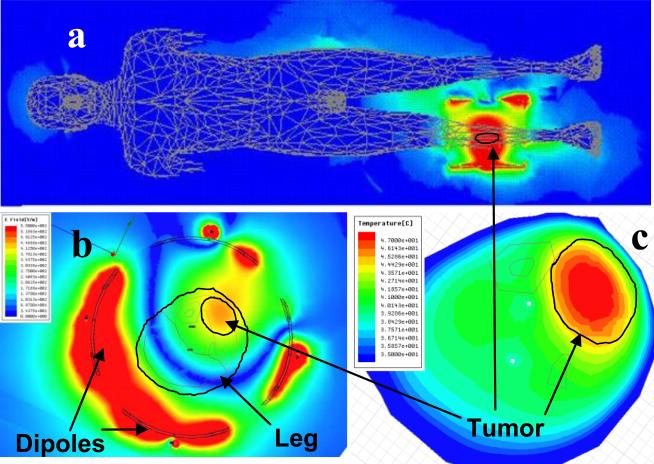
Previous use of the RF phased array applicator with only the invasive fiberoptic thermometry did not have a sufficient number of thermal monitoring points to allow proper steering of the heating focus into the tumor. This often left parts of the tumor unheated while generating too much heat in surrounding normal tissues. Thus, to create a starting point for phase and amplitude drive parameters of the dipole antennas, an electromagnetic simulation software approach was introduced for pretreatment planning of heating patterns within the phased arrays.. Electromagnetic simulation software (HFSS by Ansoft Corp, Pittsburg PA) was used to study electric field distributions within the array. Models of the tumor were constructed using tissue properties from the literature and anatomic regions identified from segmented images of specific patient disease. Procedures for segmenting and simulating the heating performance of annular phased arrays have been described previously [1, 3, 4]. Fig. 2 gives an example simulation of the electric field inside the whole body (a), and inside the MAPA applicator (b). The high field strength in the coupling water near the dipole antennas is seen to fall off rapidly prior to entering the lower dielectric constant and much higher conductivity leg. Fig 2c shows the simulated temperature rise pattern in the leg and tumor (upper right) as calculated using coupled thermal simulation software (E-Phyiscs, Ansoft Corp. Pittsburg PA).
Figure 2.
a) HFSS simulation of electric field in whole body model from 140 MHz MAPA applicator on lower right leg. Note the minimal fields coupled into other body tissues relative to high field focused in leg.
b) HFSS simulation of E-field everywhere inside the water filled MAPA. Note the high fields around each antenna in distilled water falling off before reaching the fat layer surrounding the leg.
c) E-Physics simulation of steady state temperature in leg showing focus in tumor for the optimized phase settings of four twin dipole antennas as simulated by HFSS. Note the excellent localization of heat in elliptical tumor region at upper right with appropriate phase and amplitude settings for the four antennas.
2.2 Magnetic Resonance Temperature Imaging
Several MR parameters are temperature sensitive: T1, T2, bulk magnetization, and the proton resonance frequency. The proton resonance frequency shift (PRFS) method has been shown to provide the best temperature sensitivity and is now the most commonly used approach for monitoring tissue temperature rise with MR. For this study, a custom image analysis platform was developed at Duke University that allows realtime acquisition of PRFS images in multiple MR slices with software capability to delineate user defined ROI's in which average tissue temperature rise above baseline is calculated. To use this software, ROI's are specified in each MR slice with a graphical user interface drawing tool (circle, square or manually traced outline). ROI's are generally placed inside the silicone oil references that do not change phase with temperature, and in other user determined regions of interest such as center and periphery of tumor, entire tumor, critical normal tissue regions in which to avoid heating, etc. For the analysis of the first 10 patients,, a region of interest was drawn on each slice in the close vicinity of the fiberoptic temperature sensor in that plane, for correlation of MR PRFS based temperature calculations with invasively measured temperatures. The graphical user interface provides realtime continuous display of temperature rise vs. treatment time for all selected ROI's overlaid on the data from the 4 Luxtron fiberoptic sensors. In this study, PRFS was used to calculate temperature rise of each voxel in four MR image planes, normally taken at 1.5 cm intervals through the tumor. Each voxel was the average of 9 pixels in the 128 × 128 resolution slices. Four 2D temperature rise images were reconstructed from this dataset once per minute, each referenced back to the initial baseline images taken prior to initiating heat treatment. Recent improvements will allow realtime analysis of a larger number of MR images to enable true 3D volumetric thermal dosimetry throughout the entire tumor volume.
Several problems were resolved during the course of the initial 10 patient MRTI feasibility trial. From the beginning, it was clear that temperatures calculated by the PRFS method are highly sensitive to drifts in the primary imaging magnetic field gradient. Long term drifting of the field gradient in our GE 1.5T magnet produced a slowly changing temperature reference which caused errors in the temperature calculations of 10°C or more, making uncorrected MRTI images unusable in the clinic. Other investigators have solved field gradient drift problems inserting temperature stable references in the image plane and correcting all pixels of the image to cancel any apparent temperature change in the references[5-7]. For the custom built MAPA applicator at Duke University, we added four silicone oil reference chambers inside and four outside the plexiglass shell, running the entire length the cylindrical applicator. Since the phase of silicone oil does not change with temperature, all changes in phase from ROI's in the oil references were assumed to be due to changes in the local magnetic field. The image analysis program provided a linearly interpolated software correction to all voxels between the peripherally located oil references, to obtain field independent temperature rise calculations that are valid over the entire Hyperthermia treatment interval which lasts an hour or more.
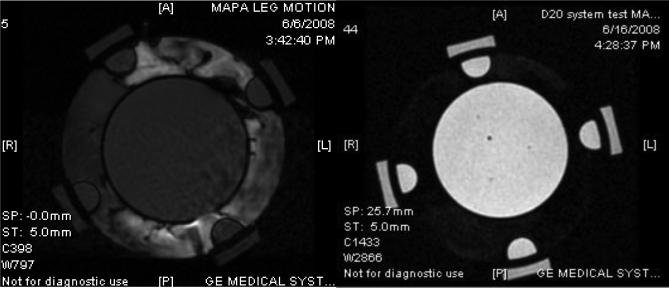
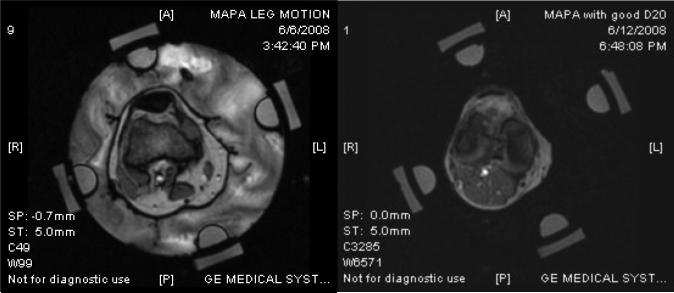
During the course of this study, it became obvious that accuracy of the temperature rise images is highly dependent on motion of the applicator and tissue volume relative to the baseline images taken at the beginning of the hour long treatment. Thus efforts were made to secure the cylindrical MAPA applicator to the MR table and support the extremity inside the applicator to minimize movement during treatment. Moreover, it is desirable to circulate a temperature-regulated high dielectric constant, low electrical conductivity fluid around the tissue volume inside the RF phased array applicator, both for coupling the radiofrequency energy into tissue and for cooling the antennas and skin surface. Deionized water is generally used as the coupling fluid but water has a strong MR signal which therefore produces strong variation in MR signal with motion. Thus to limit the motion artifacts which blurred and distorted the temperature images, initial patients were treated with stationary coupling water rather than circulating temperature controlled coolant. Even so, MR images exhibited random phase distortions due to slowly moving water from temperature gradient induced convection currents in the bolus as well as lingering reverberations within the bolus chamber from small muscular twitches of the arm or leg during treatment. It is well known that heavy water (D2O rather than H2O) has no MR signal in a 1.5T magnet and thus appears black regardless of motion or temperature change. While non-toxic and nearly identical in electrical properties to distilled water, D2O has generally not been used for this purpose due to reasons such as high cost and unstable storage considerations. If not carefully handled and isolated, the D2O will accumulate moisture from the air and deteriorate rapidly to produce a signal more consistent with water. Thus we constructed a sterile D20 water circulation system for our MR hyperthermia applicators that has an expandable nitrogen gas filled bladder over the D2O storage reservoir. Using a closed system with heat exchanger for temperature regulation and peristaltic pump for circulation, D2O is drawn from the nitrogen capped reservoir and pumped in and out of the MAPA applicator without ever coming in contact with air. The system has been used for the past 6 months with no apparent degradation, allowing circulation of cooling fluid through the applicator during treatment with no motion artifact. Fig. 3 shows MR images of a 12 cm diameter cylindrical gel phantom inside a 25 cm diameter MAPA applicator with deionized water circulating around the phantom (left image) and D2O circulating around the same phantom in the same applicator (right image). Note the phase distortion in the moving water region that bleeds over into the phantom in the image on the left of Fig. 3, and the clear undistorted image with enhanced contrast in the image on the right obtained when circulating D2O. The motion artifact from moving water causes errors in the calculated temperature rise images. Fig. 4 shows similar improvement in signal quality using circulating D2O around the leg inside the MAPA applicator.
Figure 3.
PRFS-based MRTI images of 12 cm diameter gel phantom inside MAPA applicator with four peripheral silicone oil references – using body coil of GE 1.5T Excite MR system:
a) With circulating distilled water. Note the phase distortion caused by motion artifacts of moving water that bleed over into distortion of the gel phantom temperature rise signal.
b) Same gel phantom and PRFS measurement using circulating D2O instead of water as the coupling fluid.
Figure 4.
MR images of leg inside MAPA applicator:
a) With distilled water about 10 sec after stopping the circulation. Note the phase distortion in image caused by slowly dissipating motion artifact of slowly moving water.
b) MR image of leg in same applicator with water replaced by D2O that has no MR signal. Note lack of motion artifacts in the image and better contrast even while circulating temperature controlled liquid for cooling the skin surface.
2.3 Clinical Protocol to Investigate Utility of MRTI
This effort reports the progress of a clinical protocol entitled “Magnetic Resonance Based Non-Invasive Thermometry for Hyperthermic Treatment of Extremity Soft Tissue Sarcomas: A Multimodal Phase I/II Study”. The primary goal of this clinical investigation is to determine the feasibility and accuracy of realtime non-invasive magnetic resonance image based thermometry in the monitoring and control of hyperthermia treatments of extremity soft tissue sarcomas. A secondary goal of the study (not reported at this time) is to determine if measurements of tumor physiology as defined by dynamic contrast enhanced DCE-MRI studies are predictive of clinical and/or pathologic response, and/or metastatic potential. Since early 2005, 15 patients with grade 2 or 3 soft tissue sarcomas were enrolled on the study, of which ten were heated. Reasons for taking a patient off protocol included: non-compliance, non-heatable, tumor too large for applicator, and pulmonary embolism. The heated tumors were located as follows: 2 thigh, 4 calf, 2 forearm, 1 wrist, and 1 upper arm. The protocol schema included a radiation dose of 180 cGy for 25 fractions to a total of 4500 cGy in 5 weeks, 1 hyperthermia treatment per week for 5 weeks, and surgical resection of the remaining mass 3-5 weeks post treatment. Miscellaneous ancillary studies were performed on heated patients, including MR perfusion imaging before the start of treatment (baseline) and after the first HT treatment (DCE-MRI).
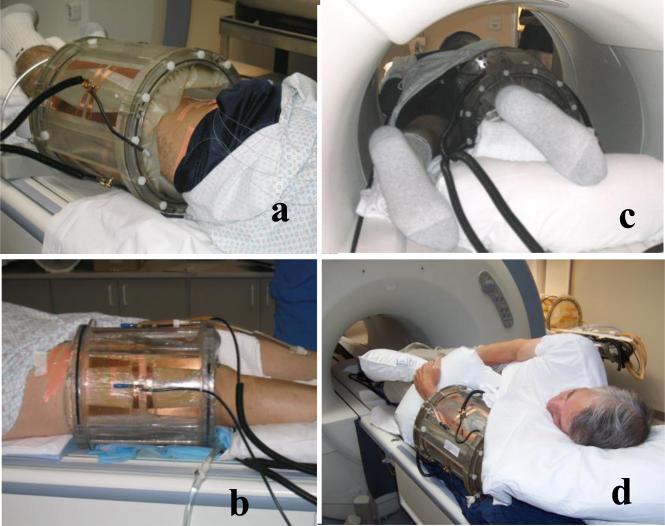
The protocol calls for placement of an interstitial catheter centrally across the tumor mass allowing insertion of four 0.56 mm diameter fiberoptic sensors (Model 3100 sensors, Luxtron Corp Santa Clara CA) staggered 1-2 cm apart in the catheter. An attempt was made to monitor at least 3 types of tissue: fat, viable tumor, and necrotic tumor (if any). A high resolution (1mm) DCE-MRI scan was taken to aid catheter placement and specific locations of four sensors identified on the followup verification scan after placement. Generally the catheter was oriented oblique to the scan planes such that the four fiberoptic sensors were located in four different image planes. Localization scans performed in the early patients had variable success in identifying exact locations of the catheter relative to tumor as the air filled catheter did not contrast well against many tissues. An adjustment to the scan procedure in later patients provided significantly improved visualization of the catheter by inserting a smaller diameter catheter filled with Gadolinium for the pre-localization scan. This facilitated precise localization of the catheter in the tumor and subsequent calculation of the position of the four staggered Luxtron sensing points. Following probe placement, the tumor bearing extremity was inserted into the cylindrical MAPA applicator and the tumor centered within the four twin-dipole antennas. For the first cohort of 10 patients which preceded use of D2O coupling fluid, the bolus was filled completely around the extremity with deionized water at 42°C. The patient was then moved into the MR magnet, RF power cables attached, and input impedance parameters measured for the four antennas. The setup for four patients is shown in Fig. 5.
Figure 5.
Photographs of four patients in Mini-Annular Phased Array (MAPA) applicator with 4 twin dipole antennas driven at 140 MHz.
a) Waterbolus fills extra volume inside the 24 cm diameter applicator, coupling dipole antennas to tissue.
b) Brown tape holds a single invasive #15g catheter in place which extends diagonally across the tumor volume and is filled with 4 stationary Luxtron 3100 fiberoptic sensors spaced 1.5 cm apart along the catheter.
c) Patient leg in applicator inside MR magnet during hyperthermia treatment.
d) MAPA on lower arm sarcoma prior to positioning patient in MR magnet.
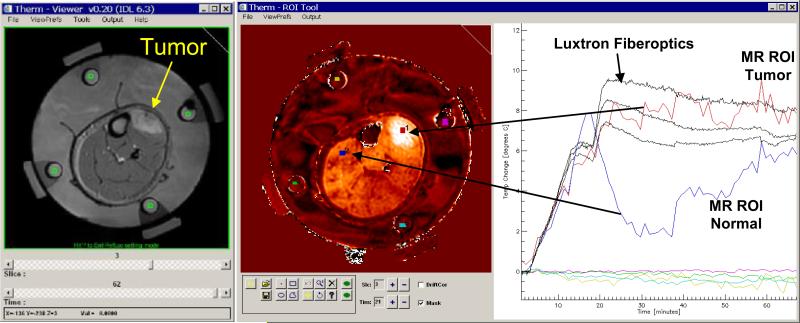
Prior to application of RF power, a set of four sequential MR slices was acquired at one minute intervals to clearly establish baseline temperature conditions. Each slice was acquired with 128 × 128 resolution 2D axial SPGR sequence with TR=38.5, Flip angle=30°, BW=15.6 kHz, FOV = 30 cm, 128×128, and NEX=4.0. All slices were acquired using the 60 cm diameter body coil of a GE 1.5T Excite system. At the end of this first cohort of patients, the system was improved such that the MAPA extremities applicator can fit snugly within a 30 cm diameter GE head imaging coil, which produces higher resolution images than those available for the current analysis. During accumulation of the baseline images, a small ROI was drawn manually in the center of each silicone oil reference region in each of the four slices. The “Therm” temperature analysis program was initiated with these reference values to correct for drifts in the magnetic field gradient magnets during the ensuing 1 hour heat treatment interval. This correction was linearly interpolated across the tissue region between oil references using the minimum curvature surface algorithm in IDL. Also during this initial baseline period and/or at any time during or after the treatment, a small region of interest was drawn adjacent to the fiberoptic sensor in the four respective MR cross sections, and the average temperature rise of pixels within those ROI's was displayed as a function of treatment time on the same graph as the four invasive Luxtron sensors. A view of the realtime display from the Therm program is given in Fig. 6. Along with standard adjustments for window level and image contrast, the display includes a standard high resolution MR image of the patient anatomy, a PRFS subtraction image showing temperature rise above baseline, and a temperature rise vs. time plot with superimposed data from invasive sensors and selected MR regions of interest. Additional ROI's were identified in tumor and normal tissue locations as desired to monitor temperature during the course of therapy. Additional ROI's could be added at any time during treatment, or in subsequent retrospective analysis of the treatment to investigate average temperatures of tissue regions of different size and location.
Fig. 6.
Realtime display during MR monitoring of heat treatment. Image at left is anatomical image of leg in MAPA applicator. Four green ROI's were drawn in the middle of the four cylindrical silicone oil reference chambers on the inside of MAPA applicator surrounded by coupling water in each of four MR slices, for use in correcting for magnetic field drifts of the GE 1.5T excite system gradient amplifiers. The central image shows a typical differential temperature image display at about 20 min into heat treatment, after the phase of the four 140 MHz twin dipole heating antennas had been adjusted to move the heat focus into the center of tumor at upper right of leg. The PRFS calculated temperature rise is displayed on the same plot as the invasive Luxtron 3100 fiberoptic sensors at right. The dramatic refocusing of power deposition at 18 min into the heat treatment is seen to shift heating away from normal tissues (such as the blue region of interest in upper left of image) and into the tumor at upper right (red ROI and temperature curve).
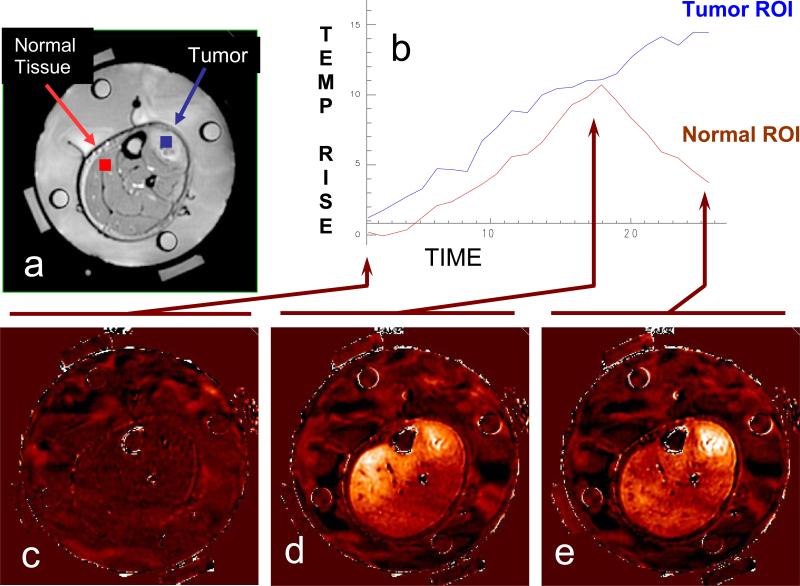
Following the initial baseline scans, approximately 20-50W of power at 140 MHz was applied to each of the four antennas, generally with 0 phase difference between antennas initially to produce a central zone of heating deep in the extremity. As the tissue heated, the MR imaging continued at one minute intervals and the window and threshold levels adjusted as necessary to optimize the thermal display to visualize the highest temperature rise in tissue as white (hot). In this manner, the focus of heating could be visualized in real time during treatment and the phase and amplitude parameters of the RF excitation varied as necessary to shift the heat focus towards the tumor center. This process is demonstrated in Fig. 7, which shows the initial baseline image at lower left followed by a diffuse heating pattern developing after 18 minutes of central focus with 0,0,0,0 phases (bottom center), and finally the effective shifting of heat focus into the tumor at upper right of leg by 25 min into treatment due to the change in relative antenna phases to 0,30,60,30 after 18 minutes.
Figure 7.
Dosimetry of a clinical hyperthermia treatment of advanced fibrous histiocytoma (soft-tissue sarcoma) in the lower leg. Tumor is clearly visible in the upper right of leg adjacent to the tibia. a) Anatomic MRI of a patient's lower leg inside MAPA applicator with 4 dipole antenna pairs and 4 silicon oil reference tubes. b) Temperature data as a function of time. c) Baseline temperature change map after 4 minutes of imaging without application of heat, temperatures in the leg are stable at about 36°C; d) Temperature rise image at approximately 18 minutes into treatment - heating of tumor is visible but is less than heating of normal tissue on the upper left side of leg; e) 25 minutes into treatment, after adjusting the antenna phases to focus heat primarily in the tumor region at upper right of leg.
A catheter was positioned through the tumor and four Luxtron fiberoptic sensors were located at various depths in the tumor. These temperatures were seen to increase during the course of treatment but with only one catheter there was no feedback information available from the invasive thermometry setup to help steer the phase focus into the tumor. While the Luxtron system showed heating in the tumor, there was no indication that a higher level of heating was occurring in normal muscle tissue on the other side of leg (red ROI on left side of leg in Fig. 7a). In contrast, the MRTI image clearly shows the evolution of heating from the phased array applicator and indicates that an adjustment of relative phase between antennas was necessary to shift heating from a central diffuse blush of heating across the entire leg to effective localization of heat in the tumor at upper right of leg (blue ROI in upper right of Fig 7a). Without the MRTI, this patient would have been treated with a lower level of heat in the tumor and a higher level of heat in the normal muscle.
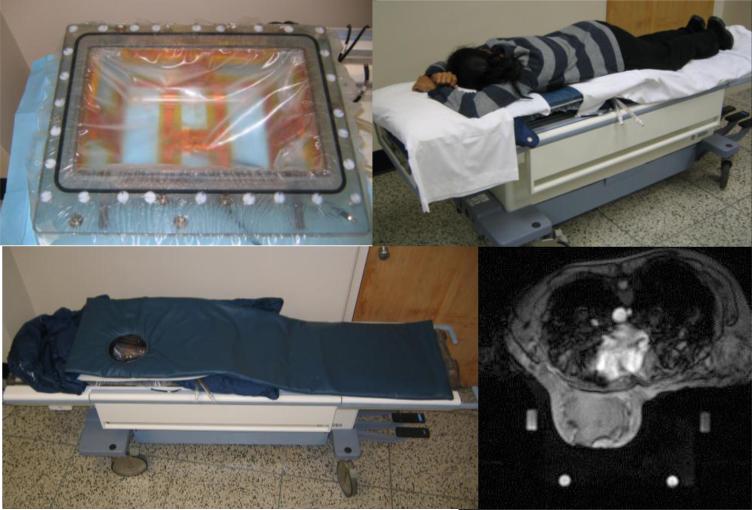
A similar setup is shown in Fig. 8 for treatment of breast tumors with the MR compatible 5 antenna 140 MHz RF phased array breast applicator. With this setup it is possible to penetrate heat to tumors located deep in intact breast, down to the chestwall. This applicator will be the subject of a future clinical trial to investigate the utility of MRTI for monitoring and control of heating locally advanced breast cancer.
Figure 8.
Five antenna 140 MHz phased array breast applicator mounted in GE MR patient table. Contoured breast support plate holds patient comfortably over the RF phased array applicator for the duration of treatment. MR scan of breast in applicator using D2O heavy water inside the applicator. D20 has no signal so appears black, increasing the signal to noise ratio and allowing circulation of temperature controlled coolant with no motion artifact that otherwise distorts the image. Note the four silicone oil references for correction of drifts in field gradient magnets.
3. RESULTS
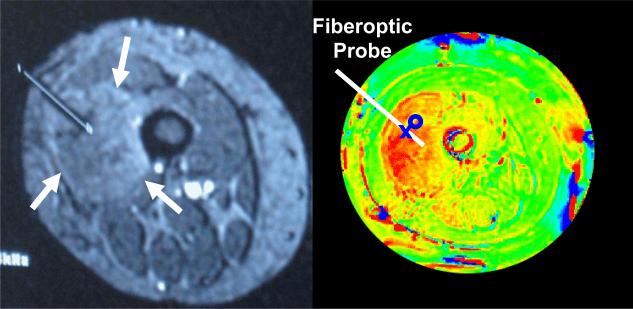
The anticipated benefit of MRTI is to provide visualization of complete volumetric temperature distributions and thereby assist realtime adjustment of heating parameters for improved localization of heat in tumors at depth. Although PRFS techniques provide only temperature rise calculations relative to initial baseline temperature, the hypothesis is that relative temperature distributions measured by MRTI can be used in combination with absolute temperatures measured at a small number of calibration points to help focus a therapeutic level of heat into tumors at depth. To determine if MRTI can be used in this way, we initiated a clinical protocol to study the accuracy of MR volumetric temperature calculations by comparing directly with invasive Luxtron fiberoptic sensors at four specific locations in tumor and overlying normal tissue. Fig. 9 shows an example of an MR localization scan with clearly visible implant catheter extending to center of tumor (arrows in left image), and subsequent PRFS calculated temperature rise image of the same plane during the course of a heat treatment (right). Higher temperatures progress from green to yellow to red. Four fiberoptic sensors were inserted in the #15g catheter at 1 – 2 cm spacing, depending on tumor size. Locations of the sensors were estimated within 2-3 mm by measuring distance back from the tip of catheter. In Fig 9, the second sensor was identified to be at the location of the X and a circular ROI drawn adjacent to the fiberoptic sensor for subsequent comparison of temperatures measured by Luxtron and MRTI.
Fig 9.
MR image of leg (right) with catheter placed to middle of tumor (left upper quadrant) for insertion of fiberoptic probe. PRFS based temperature rise image (left) during RF heat treatment shows higher temperature in red. The protocol specified placement of 4 fiberoptic sensors in the catheter with adjacent small ROI's identified in the MR display program. MR temperatures averaged within the ROIs were displayed together with invasive measurements at adjacent points.
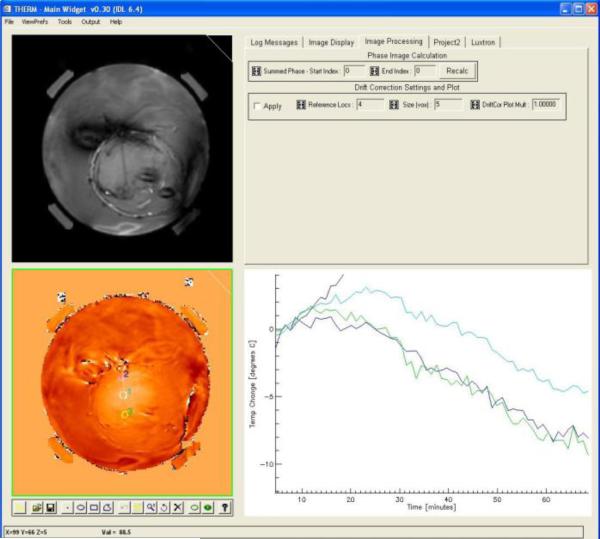
Not all treatments provided good data for correlation of temperatures between the invasive and non-invasive measurement approaches. Fig. 10 is an example of data that could not be included in the analysis to assess “accuracy” of the non-invasive PRFS calculated temperatures. In this treatment which occurred early in the trial before the use of silicone oil references to correct for drift in the field magnets, a slow but stead downward drift in calculated temperature rise obscures the real temperature increase that occurred in the tissue during the heat treatment.
Fig. 10.
Example of unevaluable data. PRFS based temperature rise shown as a function of time during heating, but exhibits a continuous negative drift due to uncorrected drift in the primary magnetic field gradient.
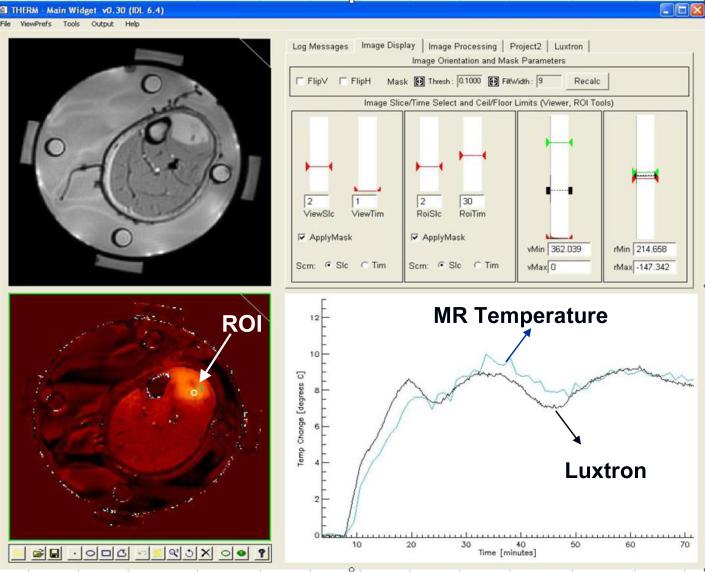
After correction of the field drift problem with proper use of silicone oil references, subsequent treatments provided a stable temperature rise signal from the PRFS images which were repeated once per minute over the course of treatment. Since temperature rise calculations are dependent on the tissue remaining stationary throughout the hour long treatment to remain appropriately referenced to the initial baseline images, some treatments provided good comparative data only for part of the treatment before a major movement by the patient caused a sudden and large error in temperature calculations for the remainder of treatment. Such errors motivated the design of improved applicator mounting configurations to stabilize the MAPA applicator and patient extremity inside the MR magnet. Fig. 11 shows an example of the post-treatment comparative dosimetry applied to a patient treatment with stable setup, as more typical of the last patients treated in the protocol. The small square ROI visible in the center of the tumor (arrow) was placed immediately adjacent to the location of one of the Luxtron fiberoptic sensors in the implant catheter which traversed the tumor oblique to this MR image plane. In this treatment, there was excellent agreement between the PRFS calculated temperature rise and that measured in the invasive sensor.
Fig. 11.
Therm program display during use for retrospective analysis of heat treatment data from MRTI in comparison to invasive fiberoptic sensor measurements. Anatomic image at upper left with PRFS calculated temperature difference from initial baseline in lower left. Graphical toolset at bottom of temperature image available to draw ROI's of any size and shape for spatial averaging of temperatures whereever desired. Slice selection and contrast/window adjustments for the displayed temperature image in upper right screen. Graph at lower right plots termperature rise as a function of time for all selected ROI's, along with the selected invasive fiberoptic sensors. Note the excellent correlation of temperatures obtained from the small ROI near the invasive sensor in the center of tumor (upper right of leg).
For the first 10 patients in this protocol, a match between invasive Luxtron sensor and MR ROI was possible in 7 patients. Data from three patients could not be used for this analysis due to: i) uncorrected field drift, ii) inability to locate or correlate Luxtron sensor positions on any MR image plane, or iii) significant patient position shift early in treatment that made initial baseline scan and subsequent differential temperature calculations incorrect. Twelve treatments had a match between Luxtron sensor position and ROI in one or more MR image planes as well as motion free stable PRFS temperature display for a long steady state evaluation period enabling direct correlation of invasive and non-invasive temperature measurements. In these evaluable treatments, the average difference between the invasive sensor measurement and the average temperature rise of an adjacent small ROI as calculated by PRFS method was 0.85°C over a steady state period of at least 10 min.
4. DISCUSSION
The key to improved thermal therapy of deep tumors is an ability to non-invasively and accurately characterize complete 3D intra-tumoral temperature distributions and to use that thermal dosimetry information in real-time to guide changes in power deposition patterns that will achieve better localization of heat in the tumor. MR imaging time is currently expensive and not available to all institutions that would like to perform deep tissue Hyperthermia. Thus, some institutions will be able to take advantage of this non-invasive 3D thermal vision for realtime monitoring and control of heat treatments while other institutions must rely on pretreatment planning and a relatively small number of implanted temperature sensors for delivery of heat. This is an initial report of a clinical study to determine the feasibility of using MRTI to monitor and control deep tissue Hyperthermia induced with a mini-annular phased array applicator designed to treat extremity sarcomas[8]. The protocol was designed to look at the difference between temperatures monitored by a small number of invasive intra-tumoral temperature sensors and the calculated temperatures from small regions of interest in four MR image planes through the tumor, with the ROI's selected to be as close to the invasive sensors as possible. Clearly the temperature of the single point monitored by the invasive sensor can not be expected to be exactly the same as a spatially averaged tissue temperature of a small region of interest near that invasive sensor, but if ROI's are carefully selected on average a good agreement between the ROI and individual point temperatures is a probability. Thus the protocol proceeded to study the agreement between invasive temperature measurements at four discreet points in tumor with an equal number of ROI's selected from complete 2D temperature rise distributions in four MR slices.
MRTI thermometry has been used for measuring power deposition distributions in phantoms with resolution of 0.3-0.5°C. Clinical studies have also reported resolution of 0.5-1°C [6]. As MRTI technology continues to mature, it offers opportunities for more than just temperature measurement. It can provide anatomical, physiological and thermal data for treatment planning. By monitoring realtime changes in temperature during heating, MRTI can provide critical feedback for dynamic control of treatment delivery. Finally, MRTI can provide post-treatment assessment of tissue damage, especially useful in combination with thermal ablation treatments where tissue damage occurs concurrently with treatment.
Although the use of MRTI gives substantially more thermal feedback information during treatment than is possible with invasive temperature sensors, the eventual goal is to use MRTI more sparingly to characterize 3D heating patterns of available heat applicators in typical tumor locations and to verify accuracy of electromagnetic and thermal modeling approaches. In the future, it may be possible to benefit from MRTI while requiring magnet time only for feedback based optimization of the pre-treatment plan, perhaps only for the first heat treatment of a new site. Once the heating characteristics of a tumor have been established in the first treatment, it may be possible to reuse the MR optimized power control parameters in subsequent treatments delivered outside the magnet, relying on a much smaller number of sensors to maintain appropriate overall power level. The validity of using MRTI to establish (or correct) the accuracy of pre-treatment plans during a first treatment must be established in future clinical trials investigating the accuracy of treatment planning and the repeatability of tumor heating for given power parameters.
5. SUMMARY
We have designed, built and installed a fully integrated MRI monitored RF hyperthermia treatment system centered on a modern commercial GE 1.5T Signa Excite MRI system. This facility includes novel MRI-compatible hyperthermia applicators and supporting equipment (140 MHz power amplifiers, RF filters, and Labview based data acquisition and power control systems) that were specifically designed to treat tumors of the extremities first, with extension to tumors in the breast, and finally to tumors of the pelvis/abdomen expected in the next year. Starting with extremity sarcomas, we investigated the feasibility of using MRTI for realtime monitoring of deep tissue hyperthermia by directly comparing temperatures calculated from PRFS magnetic resonance images to intratumoral temperatures measured with invasive fiberoptic sensors. The data shows that for evaluable treatments in the first 10 patients, we achieved excellent correlation of tissue temperature rise (ΔT<1°C) as calculated from PRFS-based MRTI regions of interest and compared to nearby invasive probe measurements. Even so, accurate 3D localization of invasive sensors and MR imaging artifacts from motion of the coupling fluid and/or tissue during treatment were serious challenges that limited the number of successful comparisons in the initial cohort of 10 patients. Subsequent developments are already proving useful to enhance the reliability of this non-invasive volumetric thermometry approach, including use of Gadolinium filled catheter inserts during initial localization scans for more precise probe localization, D2O as a zero signal coupling fluid, and applicator stabilization mounts to restrict patient movement.
ACKNOWLEDGMENTS
This effort was supported by NIH Grant PO1-CA42745. The authors are grateful for the generous support from Ansoft Corporation in making their electromagnetic simulation package available for this project and assisting in implementing its powerful features for this application. Similarly, the authors would like to acknowledge the educational product considerations from National Instruments Corp for use of their Labview program in these development projects.
REFERENCES
- 1.Li Z, et al. Towards the Validation of a Commercial Hyperthermia Treatment Planning System. Microwave Journal. 2008 Dec. [PMC free article] [PubMed] [Google Scholar]
- 2.Zhang Y, et al. Theoretical and measured electric field distributions within an annular phased array: consideration of source antennas. IEEE Transactions on Biomedical Engineering. 1993;40(8):780–7. doi: 10.1109/10.238462. [DOI] [PubMed] [Google Scholar]
- 3.Stakhursky V, et al. Real-time MRI guided hyperthermia treatment using a fast adaptive algorithm. Phys. Med. Biol. doi: 10.1088/0031-9155/54/7/019. Submitted. [DOI] [PMC free article] [PubMed] [Google Scholar]
- 4.Li Z, et al. Determining SAR/Temperature Distribution within an Annular Phased Array Using Proton Resonance Frequency Shift Imaging with Magnetic Resonance Imaging. Int. J. Hyperthermia. Submitted. [Google Scholar]
- 5.Gellermann J, et al. A practical approach to thermography in a hyperthermia/magnetic resonance hybrid system: validation in a heterogeneous phantom. International Journal of Radiation Oncology, Biology, Physics. 2005;61(1):267–77. doi: 10.1016/j.ijrobp.2004.05.009. [DOI] [PubMed] [Google Scholar]
- 6.Gellermann J, et al. Noninvasive magnetic resonance thermography of soft tissue sarcomas during regional hyperthermia: correlation with response and direct thermometry. Cancer. 2006;107(6):1373–82. doi: 10.1002/cncr.22114. [DOI] [PubMed] [Google Scholar]
- 7.Wust P, et al. Thermal monitoring: invasive, minimal-invasive and non-invasive approaches. International Journal of Hyperthermia. 2006;22(3):255–62. doi: 10.1080/02656730600661149. [DOI] [PubMed] [Google Scholar]
- 8.Craciunescu O, et al. International Congress of Hyperthermic Oncology. Munich Germany: 2008. Towards Achieving Accurate Real Time Noninvasive Volumetric Temperature Measurements Using Magnetic Resonance Thermal Imaging (MRTI). [Google Scholar]


