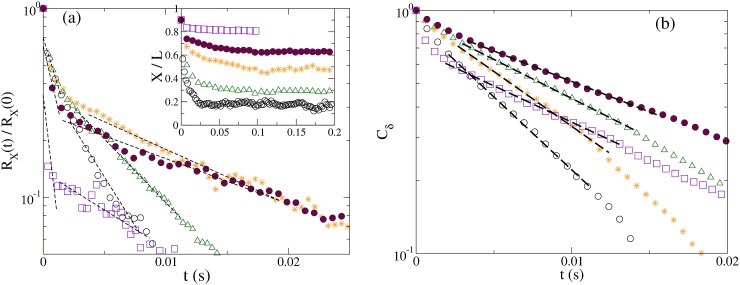
Figure 3.
(a) The stretch relaxation function RX(t) for N = 1000, P/σm = 25, for H/P = 9.9 (circle), 1.9 (triangle). 1 (star), 0.9 (filled circle), 0.6 (square). The dashed lines indicate the exponential fits to extract the relaxation time. Inset: The relative chain stretch X(t)/L. (b)The fluctuation correlation function Cδ(t) for the same H/P as in (a).

