

Abstract
T lymphocytes can mediate the destruction of cancer cells by virtue of their ability to recognize tumor-derived antigenic peptides that are presented on the cell surface in complex with HLA molecules and expand. Thus, the presence of clonally expanded T cells within neoplastic lesions is an indication of ongoing HLA-restricted T cell-mediated immune responses. Multiple tumors, including renal cell carcinomas (RCCs), are often infiltrated by significant amounts of T cells, the so-called tumor-infiltrating lymphocytes (TILs). In the present study, we analyzed RCC lesions (n = 13) for the presence of expanded T-cell clonotypes using T-cell receptor clonotype mapping. Surprisingly, we found that RCCs comprise relatively low numbers of distinct expanded T-cell clonotypes as compared with melanoma lesions. The numbers of different T-cell clonotypes detected among RCC-infiltrating lymphocytes were in the range of 1–17 (median = 5), and in several patients, the number of clonotypes expanded within tumor lesions resembled that observed among autologous peripheral blood mononuclear cells. Moreover, several of these clonotypes were identical in TILs and PBMCs. Flow cytometry data demonstrated that the general differentiation status of CD8+ TILs differed from that of circulating CD8+ T cells. Furthermore, PD-1 and LAG-3 were expressed by a significantly higher percentage of CD8+ RCC-infiltrating lymphocytes as compared with PBMCs obtained from RCC patients or healthy individuals. Thus, CD8+ TILs display a differentiated phenotype and express activation markers as well as surface molecules associated with the inhibition of T-cell functions. However, TILs are characterized by a low amount of expanded T-cell clonotypes.
Keywords: T-cell phenotypes, T-cell receptor clonotype mapping, clonally expanded T cells, renal cell carcinoma, tumor-infiltrating lymphocytes
Introduction
The clinical management of metastatic renal cell carcinoma (RCC) patients has dramatically improved over the past few years primarily due to the development of novel targeted therapies, resulting in a significant improvement of overall survival.1 However, despite the survival benefits of these new therapeutic strategies, the only potentially curative intervention for metastatic RCC remains the administration of interleukin-2 (IL-2) and interferon α (IFNα), strongly suggesting that the solicitation of host immune responses is key to therapeutic successes, at least in this setting.2 The monoclonal antibody Yervoy® (ipilimumab) has been shown to induce favorable clinical responses (some of which are durable) among patients affected by melanoma, another cytokine-responsive malignancy.3 Yervoy® blocks the immunosuppressive molecule cytotoxic T lymphocyte-associated protein 4 (CTLA4) expressed on T cells. Although the precise mechanisms remain to be elucidated, current data strongly suggest that both CD4+ and CD8+ T cells play an important role in mediating this clinical benefit.4 Thus, Yervoy®-based immunotherapy is hypothesized to unleash spontaneous anticancer T-cell immune responses, thereby leading to tumor regression in a fraction of patients.5 Beyond the targeting of CTLA-4, several other antibodies blocking various regulatory molecules on the surface of T cells are in clinical development. These include antibodies targeting programmed cell death 1 (PDCD1, best known as PD-1) and its major ligand PD-L1, which have been shown to induce impressive clinical responses in a proportion of cancer (including RCC) patients in Phase I clinical trials.6-8 Given the overlapping expression profile and immunoregulatory functions of CTLA4 and PD-1, both PD-1- and PD-L1-blocking antibodies may possess a similar mechanism of action Yervoy®.6-8
The positive therapeutic outcome of soliciting immune responses against RCC—either by “pushing” the immune system with activating cytokines or by unleashing spontaneous immune responses upon the blockade of immunological checkpoints—parallels the fact that RCC lesions are often infiltrated by T cells.9 It is also well known that RCC cells express tumor-associated antigens (TAAs) that are recognized by T cells.10-12 Furthermore, peripheral blood lymphocytes from RCC patients have been shown to contain tumor-specific CD8+ T cells.11,13,14 These findings, taken together with considerable improvements in our understanding of the interplay between cells of the immune system and malignant cells (including RCC cells) have opened avenues to develop therapeutic anticancer vaccinations. Although the results of Phase III clinical trials testing such approaches in RCC patients are not yet available, early clinical data are encouraging.15-17
An epitope specific T-cell response lead to clonal T-cell expansion. Thus, the detection of expanded T-cell clonotypes is strongly indicative of an ongoing HLA-restricted immune response. In this context, we have demonstrated that expanded T-cell clonotypes comprise a significant percentage of the lymphocytes that infiltrate melanoma lesions.18,19 These findings have been corroborated by others. Moreover, this phenomenon has also been documented in other malignancies, such as seminoma,20 as well as breast carcinoma and glioma (unpublished data). However, to date, very little is known about the clonality of tumor-infiltrating lymphocytes (TILs) in RCC patients.
We have recently investigated the phenotype and functionality of TILs in RCC patients, finding that RCC-associated TILs are composed of both CD4+ helper T cells and activated CD8+ effector memory T (TEM) cells.21 Thus, RCC-associated TILs may be phenotypically very similar to those found within melanoma lesions.22,23 In the present study, we set out to characterize the clonality of the T cells infiltrating RCCs using T-cell receptor (TCR) clonotype mapping.24 Surprisingly, we found that—in contrast to melanoma and some other cancers—RCCs generally contained relatively limited amounts of clonally expanded T cells. Since the relative quantity of clonally expanded T cells localized to the tumor was, in fact, quite similar to the frequency observed among peripheral blood mononuclear cells (PBMCs), we sought to discern unique features of tumor-infiltrating T-cell subsets by investigating the expression of T-cell differentiation markers and inhibitory molecules. Despite the relative infrequency of expanded T-cell clones among RCC-associated TILs, cytofluorometric analyses demonstrate that these T lymphocytes are antigen experienced and express the inhibitory molecules PD-1 and lymphocyte-activation gene 3 (LAG3).
Results
RCC patients harbor circulating and tumor-infiltrating clonally-expanded T cells
To determine the nature of T cells present in RCC patients, leukocytes localized within the tumor (RCC-TILs; n = 13), and present in the peripheral blood (RCC-PBMC; n = 13) were analyzed for the presence of expanded T-cell clonotypes by RT-PCR and denaturing gradient gel electrophoresis (DGGE). TCR clonotype mapping was performed via RT-PCR to amplify the hypervariable CDR3 region that spans the V-D-J junctions of the TCR β chain utilizing a panel of primers targeting 24 β variable (BV) region families. Due to the diversity between V-D and D-J junctions, each T-cell clonotype has a unique CDR3 region within the β chain, and such sequence variability results in the denaturation of the corresponding PCR product at a specific position in a denaturing gradient gel.18,24,25 When analyzing mixed populations of T cells, an expanded T-cell clonotype is detected as a distinctive band over a background DNA smear resulting from the linear amplification of polyclonal TCR transcripts. This semiquantitive method offers an overview of the full TCR repertoire and the number of clonally expanded T-cell clonotypes. On the basis of this assay, we determined that the frequency of expanded T-cell clonotypes (corresponding to the number of predominant TCR bands in the DGGE) detected in RCC lesions ranged from 1 to 17, with a median number of 5 (Fig. 1A and B, and Table 1). Thus, although there were exceptions, most RCC patients harbored relatively few expanded T-cell clonotypes among their RCC-TILs, contrasting with previous observations of high TCR clonality in melanoma patients. Similar results were observed when the corresponding PBMC preparations were analyzed. Therein, the numbers of presumed T-cell clonotypes ranged from 0 to 15, with a median of 4 (Fig. 1C and Table 1). Nevertheless, as compared with the results obtained in previous analyses of PBMCs from healthy individuals (which typically exhibit 0–5 clones, often associated with quite faint bands), the PBMC repertoire of some patients clearly contained an increased amount of expanded T-cell clonotypes. Thus, RCCs seem to have harbor a relatively low amount of expanded T-cell clonotypes, particularly in comparison to melanoma. However, our data indicate that the PBMCs of RCC patients contained more expanded T-cell clonotypes than those of control subjects.
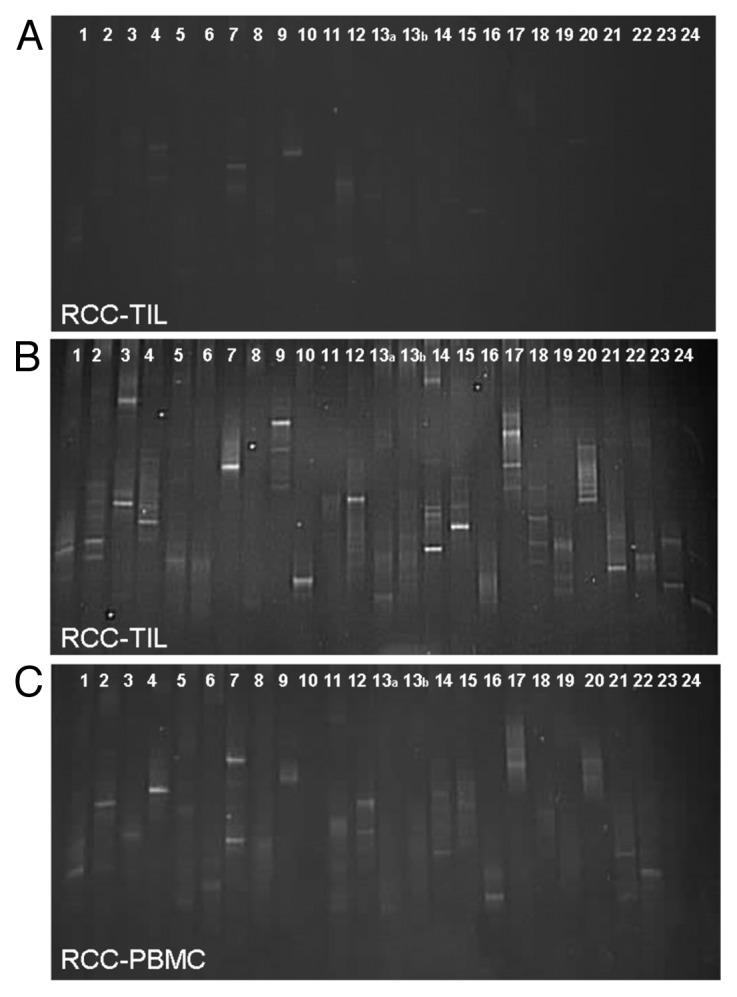
Figure 1. TCR clonotype mapping of circulating and tumor-infiltrating T cells in renal cell carcinoma patients. (A-C) RNA was extracted from tumor-infiltrating lymphocytes (TILs) and peripheral blood mononuclear cells (PBMCs) from renal cell carcinoma (RCC) patients (n = 13). RT-PCR was then performed to detect specific TCR clonotypes with primers pairs 1–24 designed to span 24 β variable (BV) region families of the TCR and generate unique PCR products. PCR products were separated by denaturing gradient gel electrophoresis (DGGE). DNA was stained with SYBR green and photographed under UV light; each band represents a clonally expanded T cell. 3 representative images are shown, including 2 DGGE images of the T-cell clonotype of RCC-associated TILs (A and B) and 1 DGGE image of the T-cell clonotype of RCC-associated PBMCs (C).
Table 1. Summary of renal cell carcinoma (RCC) patient disease history, histological subtypes and TCR clonotype data from tumor-infiltrating lymphocytes (TIL) and peripheral blood mononuclear cells (PBMC).
| Type | Stage | Gender | Age | TILd | PBMCe | |
|---|---|---|---|---|---|---|
| RCC365 |
pappRCCa |
pT3a N1 M1c |
M |
55 |
ND |
4 |
| RCC370 |
ccRCCb |
pT3b N0 M0 |
M |
65 |
9 |
ND |
| RCC374 |
pappRCC |
pT1a N0 M0 |
M |
61 |
4 |
12 |
| RCC381 |
ccRCC |
pT3a N0 M0 |
M |
67 |
3 |
ND |
| RCC396 |
ccRCC |
pT3b N0 M1 |
M |
66 |
2 |
2 |
| RCC399 |
ccRCC |
pT3b N2 M1 |
M |
55 |
3 |
3 |
| RCC428 |
pappRCC |
pT1a N0 M0 |
M |
68 |
ND |
6 |
| RCC432 |
ccRCC |
pT1a N0 M0 |
M |
70 |
ND |
4 |
| RCC433 |
ccRCC |
pT1b N0 M0 |
M |
77 |
5 |
3 |
| RCC445 |
ccRCC |
pT1b N2 M1 |
F |
61 |
5 |
ND |
| RCC464 |
ccRCC |
pT1b N0 M0 |
F |
62 |
4 |
3 |
| RCC467 |
ccRCC |
pT3b N1 M0 |
M |
79 |
15 |
ND |
| RCC478 |
pappRCC |
pT1a N0 M0 |
M |
49 |
5 |
5 |
| RCC479 |
ccRCC |
pT1b Nx Mx |
M |
78 |
1 |
6 |
| RCC486 |
ccRCC |
pT3a N0 M0 |
M |
66 |
17 |
15 |
| RCC622 |
ccRCC |
pT3a N0 M0 |
M |
66 |
ND |
0 |
| RCC626 | ccRCC | pT1a N0 M0 | F | 71 | 5 | 7 |
Histological subtypes, including apapillary renal cell carcinoma, and bclear cell renal cell carcinoma, as well as cTNM staging, patient characteristics and number of TCR clonotypes found among either dTIL or ePBMC. ND, not determined
Specific tumor-infiltrating T-cell clonotypes are detected in the circulation of RCC patients
To determine the degree to which T-cell clones expanded in the tumor microenvironment can disseminate systemically, we performed comparative clonotype mapping of RCC-PBMCs and RCC-TILs from the same patients (RCC399, RCC478 and RCC464). In particular, the TCR clonotyping PCR products of the same BV region from both RCC-PBMCs and RCC-TILs were run in adjacent lanes of a denaturing gradient gel, in order to determine the presence of identical bands in samples corresponding to these 2 distinct immune compartments (Fig. 2). Although some T-cell clonotypes were only detected among TILs (Fig. 2), a number of clonally identical T cells were detected both within malignant lesions (i.e., among TILs) and in the peripheral blood (i.e., among PBMCs). Sequence conservation was verified by DNA sequencing (data not shown). These results are at odds with previous findings obtained with melanoma- and seminoma-associated samples, in which either none or only 1 single identical T-cell clonotype was found in tumor-infiltrating and circulating T cells.18,27
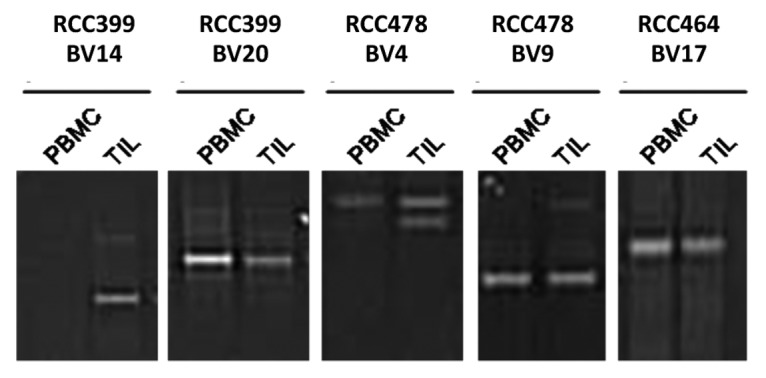
Figure 2. Comparative TCR clonotype mapping reveals common T-cell clones in the peripheral blood and neoplastic lesions of 3 renal cell carcinoma patients. PCR products of the same β variable region amplified from the peripheral blood mononuclear cells (PBMCs) or tumor-infiltrating leukocytes (TILs) of renal cell carcinoma (RCC) patients were run in adjacent lanes of a denaturing gradient gel as described in the Legend to Figure 1. The comparison of samples from RCC patients 399, 478 and 464 is shown. Clonotype sequence identities for BV20, BV4 (upper band), BV9, and BV17 were verified by DNA sequencing (not shown).
Circulating and tumor-infiltrating clonally expanded CD8+ T cells express different T-cell markers
A limited number of RCC patient samples were available for ex vivo phenotypic analyses. First, we analyzed the differentiation status of CD8+ TILs and CD8+ PBMC from RCC patients using the surface markers CD28 and CD45RA.28 Figure 3 shows the percentage of naïve (Tnaïve; CD28+CD45RA+), central memory (TCM; CD28+CD45RA-), effector memory (TEM; CD28-CD45RA-), and terminally differentiated, CD45RA+ effector memory (TEMRA; CD28-CD45RA+) T cells. RCC-TILs contained a significantly (P <0.001) higher percentage of memory CD8+ T lymphocytes (TCM and TEM cells, mean 85%, n = 4) and a markedly (but not statistically significant) lower level of naïve (Tnaive, mean 4%, n = 4) and terminally differentiated (TEMRA, mean 11%, n = 4) T cells than RCC-PBMCs (mean TCM + TEM 28%, Tnaive 27%, TEMRA 45%, n = 5) (Fig. 3). Thus, most CD8+ TILs were activated memory T cells, although late-stage differentiated T cells TEMRA appeared to be quite infrequent. These findings are in sharp contrast to the percentages of various circulating CD8+ T-cell subsets, which did not differ significantly between patients and healthy individuals (Fig. 3).
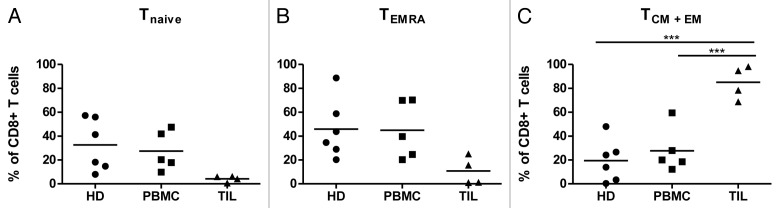
Figure 3. Cytofluorometric analyses of tumor-infiltrating and circulating CD8+ lymphocytes in renal cell carcinoma patients. The relative abundance of naïve (Tnaive), central memory (TCM), effector memory (TEM), as well as terminally differentiated, CD45RA+ effector memory (TEMRA) CD8+ T cells was determined among tumor-infiltrating lymphocytes (TILs; n = 4) and peripheral blood mononuclear cells (PBMCs; n = 5) from renal cell carcinoma (RCC) patients, as well as among PBMCs from healthy donors (HDs; n = 6) by flow cytometry. The following phenotypes were employed: Tnaive cells = CD28+CD45RA+; TCM cells = CD28+CD45RA-, TEM cells = CD28-CD45RA-; and TEMRA cells = CD28-CD45RA+. Mean values and significant differences between groups are shown (***P < 0.001).
To address the potential immunological competence of tumor-infiltrating vs. circulating CD8+ T lymphocytes, we next analyzed the frequency of cells expressing activation markers and/or the inhibitory molecules PD-1 and LAG3 among RCC-TILs and RCC-PBMCs (Fig. 4). PD-1 was detected on a significantly greater proportion of CD8+ RCC-TILs (range 28–86%, mean 63%, n = 10) than of RCC-PBMCs (range 14–65%, mean 35%, n = 11) and control PBMCs (range 19–54%, mean 39%, n = 10) (Fig. 4A). Similarly, the frequency of LAG3-expressing CD8+ T cells was significantly higher among RCC-TILs (range 6.3–12%, mean 8.3%, n = 5) than among RCC-PBMCs (range 0.7–1.7%, mean 1.3%, n = 4) and PBMC from healthy individuals (range 0.5–4.8%, mean 2.1%, n = 6), although the overall percentages of LAG3+ cells were much lower than those of PD-1+ cells (Fig. 4B). The expression of other regulatory molecules such as B and T lymphocyte associated (BTLA) and killer cell lectin-like receptor subfamily K, member 1 (KLRK1, best known as NKG2D) on the surface of CD8+ RCC-TILs and CD8+ RCC-PBMCs did not differ significantly from that of control PBMCs (data not shown). Of note, in 3 RCC patients the frequency of PD-1-expressing CD8+ TILs was comparable to that of PD-1-expressing CD8+ PBMCs from healthy donors. One of these actually exhibited the lowest frequency of PD-1-expressing CD8+ T cells among PBMCs.
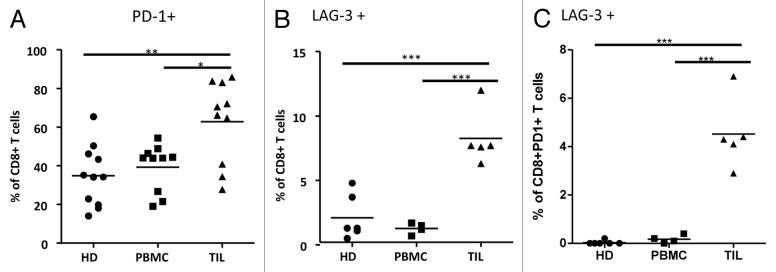
Figure 4. Cytofluorometric analyses of tumor-infiltrating and circulating PD-1- and LAG-3-expressing CD8+ T cells in renal cell carcinoma patients. (A-C) Expression analysis of T-cell regulatory molecules in CD8+ T cells from renal cell carcinoma (RCC) patients relative to healthy donors via cytofluorometric analysis and flow cytometry. Fluorescent antibodies specific for PD-1 and LAG3 were used to stain CD8+ peripheral blood mononuclear cells (PBMC) or tumor-infiltrating lymphocytes (TILs) from renal cell carcinoma (RCC) patients or healthy donors (HD). Expression analysis of: PD-1 (A) LAG3 (B) and both PD-1 and LAG3 (C) in CD8+ TILs from RCC patients as compared with CD8+ PBMCs from RCC patients or HDs. Mean values and significant differences between groups are shown (*P < 0.05, **P < 0.01, ***P < 0.001).
It has previously been shown that LAG3 and PD-1 can function synergistically to inhibit T-cell activation in mice.29 Therefore, we characterized the frequency of LAG3-expressing CD8+PD-1+ cells in our samples. The frequency of LAG3+ cells in the CD8+ PD-1+ cell subset was significantly higher among RCC-TILs (range 2.9–6.9%, mean 4.5%, n = 5) than among PBMCs from either RCC patients (range 0–0.4%, mean 0.18%, n = 4) or healthy individuals (range 0–0.2%, mean 0.03%, n = 6) (Fig. 4C). Of note, approximately 55–60% of LAG3+CD8+ TILs were also PD-1+ (data not shown). In sum, most CD8+ T cells infiltrating RCCs appear to be activated, most probably upon the local presentation of TAAs, and to have begun their differentiation into TEM and TCM cells. Moreover, the expression of PD-1 and LAG3 is more common among RCC-infiltrating CD8+ T cells than among CD8+ PBMCs, be them from RCC patient or healthy subjects.
Expression of PD-1 by clonally expanded RCC-associated TILs
As reported above, a significant proportion RCC-TILs was found to express T-cell inhibitory molecule PD-1. Since PD-1 is also a marker of previous T-cell activation, we aimed at discerning whether RCC-associated PD-1+ T cells were clonally expanded. To this end, CD8+ TILs from 2 patients were sorted into PD-1- (non-expressing) and PD-1+ (expressing) cell populations (Fig. 5A). Sorted cells were subsequently analyzed by TCR clonotype mapping, and comparative denaturing gradient gels were run along with samples from non-fractionated (bulk) TILs and autologous PBMCs. TCR clonotyping of patient RCC399 revealed 2 clonotypes (BV2 and BV20) that could be detected in PBMCs as well as in both the bulk TIL population and among PD-1-CD8+ TILs (Fig. 5B). Similarly, the TCR clonotyping of patient RCC396 revealed 2 clonotypes (BV4 and BV14) that were detected in bulk TILs as well as among the PD-1+ TIL subset (Fig. 5B). In addition, the BV4 clonotype could also detected among PD-1- TILs. Identical clonotypes were verified by DNA sequencing (data not shown). Therefore, clonally-expanded T cells may express or not PD-1, suggesting that some T cells may undergo clonal expansion irrespective of PD-1 expression.

Figure 5. TCR clonotype analyses of PD-1+ and PD-1- CD8+ tumor-infiltrating lymphocytes from renal cell carcinoma patients. (A and B) PD-1+ and PD-1- CD8+ tumor-infiltrating lymphocytes (TILs) were sorted from patients RCC399 and RCC396 and analyzed for T-cell clonotypes (as described in the Legend to Figure 1). (A) Dot plot of sorting parameters upon staining with fluorophore-conjugated antibodies specific for CD8 (CD8-APC-Cy7) and PD-1 (PD-1-FITC). (B) Comparative TCR clonotype mapping. Sequence identity was verified by sequencing (data not shown).
Discussion
Identification of skewed variable region usage by T cells in tissues under various pathological conditions has been judged as an indication of an ongoing HLA-restricted T-cell response, and has been used as a monitoring tool particularly in the context of autoimmune diseases and cancer. For example, early studies of T-cell infiltrates into brain lesions of multiple sclerosis patients evinced that such disease-associated T cells were biased in the usage of the TCR α chain variable region. More recently, methods have been developed for the detection of expanded T-cell clonotypes in heterogeneous populations of cells such as in TIL preparations. We have used the TCR clonotype mapping technique to study T-cell infiltrates in melanoma,18 seminoma,27 breast carcinoma (unpublished), and glioma (unpublished) lesions.
In particular, melanoma-infiltrating lymphocytes have been intensively studied by many groups over recent years.20 This interest in melanoma immunology stems from early data suggesting that a brisk infiltration of TILs in primary lesions is a prognostic indicator of favorable clinical outcome. Furthermore, the first description of TAA epitopes and the therapeutic targeting of characterized peptide tumor antigens were conducted in this setting. More recently, the adoptive transfer of TILs expanded ex vivo has been associated with impressive response rates in melanoma patients. Similarly to melanoma, RCCs are often infiltrated by T cells, and peripheral blood samples from RCC patients harbor tumor-specific T cells.30 Furthermore, RCC patients respond to IL-2, Yervoy® (an anti-CTLA4 antibody) and anti-PD-1 antibodies, as do melanoma patients.31 These similarities suggest that both these cancers are susceptible to the antineoplastic activity of the immune system, at least under selected circumstances, that, just as for melanoma, the adoptive transfer of TILs expanded ex vivo could be an efficient therapeutic option for RCC. Thus, we set out to scrutinize T-cell clonality and T-cell phenotypes among lymphocytes infiltrating RCCs.
The number of T-cell clones per RCC varied widely between patients. However, the number of expanded clones was strikingly low as compared with our previous data on melanoma-associated TILs. A few tumors did contain numerous clonotypes but in general quite few expanded clonotypes were detected. In fact, several RCC lesions contained T-cell profiles resembling those of PBMCs from healthy donors, with either none or very few detectable T-cell clonotypes. Thus, despite the similarities in responses to immunotherapy mentioned above, RCC-associated TILs are quite different from their melanoma-associated counterparts in terms of T-cell clonality. Ample evidence indicate that T cells comprised among melanoma-associated TILs can recognize TAAs. However, we recently scanned melanoma-associated TILs for their reactivity against a panel of all previously characterized antigens and found that only a fraction of TILs apparently recognize known tumor-associated epitopes.32 Undoubtedly, all tumor antigens are yet to be characterized, but even in studies based on autologous cancer cell lines it seem that the T lymphocytes that are capable of specifically recognizing melanoma cells constitute a minority of TILs.32 Thus, it is conceptually possible that a substantial fraction of T cells infiltrating melanoma lesions do not recognize TAAs, or recognize antigens expressed by non-malignant components of the tumor mass (e.g., fibroblasts and keratinocytes).33
Nonetheless, assuming that the T-cell clonality can be used as a surrogate marker for the activation and expansion of peptide-specific T cells, the frequency of tumor-specific TILs is even lower in RCC than in melanoma patients. In line with this notion, Markel et al. expanded RCC-TILs ex vivo, and only 20% of their cultures turned out to recognize autologous RCC cell lines.30 Moreover, accumulating evidence points to tumor infiltration by T cells as a favorable prognostic marker in most types of cancer.34 As for RCCs, high amounts of intratumoral neutrophils as well as low numbers of natural killer (NK) cells have been proposed as poor prognostic factors.35 Some studies of T-cell infiltration into RCC lesions have shown a positive prognostic value for proliferating CD8+ T cells or TH1 responses,36,37 whereas other have evinced mononuclear cell infiltration to be an unfavorable prognostic marker.9 More recently, the immune infiltrate of primary and metastatic RCC and colorectal cancer (CRC) lesions has been shown to correlate with patient survival.38 Strikingly, the density of CD8+ and lysosomal-associated membrane protein 3 (LAMP3)+ cells has been associated with good prognosis in CRC patients but bad clinical outcome among subjects affected by RCC. Moreover, it has previously been observed that the immune microenvironment of CRC lesions is generally biased toward a TH1 profile as compared with the heterogeneous pattern associated with RCC.38
In the present study, we also scrutinized the T-cell clonality of RCC-associated PBMCs. On average, PBMC samples from healthy, young to middle aged individuals exhibit 0–5 T-cell clonotypes.18 Elderly individuals may show higher numbers of expanded clonotypes,26 and some of the patients included in this study are indeed old (Table 1), but quite a number of the blood samples harbored a strikingly high number of expanded TCR clonotypes irrespective of age (Table 1 and Fig. 1C).
Given the relatively low numbers of expanded T-cell clonotypes infiltrating RCC lesions and the tendency to an increased number of expanded T-cell clonotypes in peripheral blood samples, we compared the nature of expanded T-cell clonotypes between these 2 immune compartments in 3 patients (Fig. 2). These comparative analyses revealed that a number of clones found among RCC-TIL can be tracked back to the periphery. Previous studies of melanoma and seminoma samples failed to detect identical T-cell clones among TILs and PBMCs.19,27 Rather, the PBMCs of the patients included in these studies resembled those of healthy individuals, with no (or very few) clonal expansions. We have previously tracked T-cell clonotypes detected among TILs to tumor-draining lymph nodes (LNs). However, we only cold find T-cell clonotype identity when LNs were also infiltrated by tumor cells.39 Thus, in RCC there seems to be a more pronounced link between clonally expanded T cells found among TILs and among PBMCs. RCCs are more vascularized than several other tumors,40 offering a plausible explanation for this phenomenon and, at least in part, for the limited clonality of TILs. Certainly, if circulating T cells frequently home to the tumor or pass through in significant numbers they may dilute out any clonally expanded resident T cell.
We and others have shown that RCC-TILs primarily display a memory phenotype.21,41 As discussed below, the comparison of T-cell phenotypes revealed distinctions between CD8+ TIL and CD8+ PBMCs in our patient samples. Wang et al. demonstrated the presence of antigen-experienced T cells in melanoma-associated TIL subsets as well. However, in this case, melanoma TIL comprised a higher proportion of TCM cells than that routinely detected in RCC-TILs samples.41 In the study of Wang et al. this observation is proposed to relate to expression of CD70 by RCC cells, which could sustain (at least theoretically) T-cell differentiation, but only in the context of concomitant TCR signaling. Thus, the expression of CD70 is a plausible explanation for the TEM phenotype but fails to account for the limited numbers of T-cell clonotypes detected among RCC-TILs. As the activation and differentiation of T cells is highly dependent on environmental parameters, we speculate that the extensive activation of CD27 through persistent CD70 expression by tumor cells could be sufficient to induce a partial, albeit aberrant, differentiation program, even in the absence of TCR signaling. In accordance with this hypothesis, CD70-CD27 interactions have been observed to lead to dysfunctional T cells and promote tumor growth in several murine models of solid neoplasms.42
Supporting the premise that RCC-TILs preferentially exhibit a differentiated phenotype, we demonstrated that PD-1 is expressed by a higher proportion of CD8+ TILs than of CD8+ PBMCs. All RCC-TIL samples that we analyzed expressed PD-1, with a mean value of 76% of CD8+ TILs expressing this key T-cell regulatory molecule. PD-1 has been shown to inhibit T-cell function at the effector site upon interaction with PD-L1.31 Blocking PD-1 signaling using human antibodies has proven to have broad effects on T-cell proliferation and activation, as well as on regulatory T cell function. Anti-PD-1 and anti-PD-L1 antibodies show indeed great promise for the treatment of various solid cancers including RCC.6,7,43
Also LAG3 was expressed on a significantly higher amount of CD8+ TILs (mean 8.3%) than of PBMCs, be them from RCC patients (mean 1.3%) or healthy donors (mean 2.1%) (Fig. 4B), although—as compared that of PD-1—the expression of LAG3 was less common. Also, the frequency of LAG3+ cells among CD8+PD-1+ (double positive) cells was significantly higher among RCC-TILs (mean 4.5%) than among PBMCs from RCC patients (mean 0.18%) or healthy controls (mean 0.03%). Preclinical studies in mice suggest that LAG3 and PD-1 synergistically inhibit CD8+ T cells.44 LAG3 could inhibit T-cell function upon engagement of its ligand (MHC class II molecules), which is thought to be expressed on the surface of malignant cells in about 50% of RCC patients.45-47 Therefore, blocking LAG3 together with PD-1 could improve clinical responses in comparison monotherapeutic approached based on the blockade of PD-1 alone.
Since PD-1 is a T-cell activation marker as well as a dampener of T-cell responses we hypothesized that PD-1+ T cells would be preferentially found among clonally-expanded T cells. To get some insights into this issue, we isolated PD-1+ and PD-1- CD8+ T cells from RCC-TILs and RCC-PBMCs and subjected these cells to comparative clonotype mapping, thus tracking the nature of T-cell clonotypes in these 2 distinct immune compartments. Our data show that expanded T-cell clonotypes may be PD-1- or PD-1+ and can be tracked to either PBMCs, TILs, or both compartments. Obviously, the absence of clonal expansion does not exclude antigen specificity and whether these CD8+PD-1+ T cells are truly tumor-specific remains to be determined. It has been previously shown that the CD8+PD-1+ cell population infiltrating melanoma lesions is enriched for tumor-reactive T cells.48 Interestingly, these cells lose PD-1 expression and can lyse cultured cancer cells in the presence of IL-2, implying that the anergic state of T cells may be reversible in situ. The (re)activation of CD8+ T cells upon blockade of the PD-1 receptor has also been shown to be of therapeutic relevance for the treatment of RCC patients. Specifically, the immunohistochemical detection of PD-1 on RCC-TILs has been correlated with poor disease outcome49 and, as previously mentioned, antibodies blocking PD-1 or its ligand have shown clinical efficacy in a Phase I/II trial.50 Thus, PD-1-blocking antibodies may represent a promising therapeutic approach to treat RCC patients.
In summary, the clonotypic composition of RCC-associated TILs is very distinct from that of their melanoma-associated counterparts, in that few clonally-expanded T cells infiltrate RCCs, despite the fact that a large fraction of such T cells present an antigen-experienced phenotype.
Materials and Methods
Patients and samples
Blood from healthy individuals was provided by the local blood bank in the form of buffy coats (Rigshospitalet, Copenhagen). Patients were included upon written informed consent and their clinical characteristics are provided in Table 1. PBMCs were isolated using Lymphocyte separation medium (Medinor or PAA Laboratories). The processing of tumor tissues has been previously described.21 In brief, tumor pieces were collected in Iscove's modified Dulbecco's medium supplemented with 100 units/mL penicillin/streptomycin, 10% heat-inactivated fetal calf serum (FCS), and 50 μg/mL gentamicin, minced into small pieces, then mechanically disaggregated using a Medimachine (DAKO) and 50-μm Medicon grids (Becton Dickinson). The resultant cell suspension, including TILs, was subsequently filtered through a 70-μm nylon mesh, followed by density gradient separation to isolate lymphocytes. Patient-derived PBMCs and TILs were cryopreserved in 9:1 FCS:DMSO and stored in liquid nitrogen.
TCR clonotype mapping by DGGE
RNA was extracted using the NucleoSPin RNA II Kit (Macherey-Nagel). cDNA synthesis was performed using SuperScript III reverse transcriptase (Invitrogen) in a total volume of 10 μL. cDNA synthesis was performed according to the following thermal protocol: 70 °C for 10 min, 55 °C for 60 min, and 72 °C for 2 min. 4 μL cDNA were then amplified by RT-PCR using a panel of primers amplifying 24 BV region families (designated BV1–24) of the TCR in DNA fragments suitable for TCR clonotype mapping by DGGE, as previously described.24,51,52 Amplifications were conducted in a total volume of 30 μL containing PCR buffer [50 mM potassium chloride, 20 mM Tris (hydroxymethyl)aminomethane (pH 8.4), 2.0 mM magnesium chloride, 0.2 mM cresol red, 12% sucrose, and 0.005% (w:v) bovine serum albumin (Boehringer)] 0.33 pmol of each primer, 40 mM dNTP (Pharmacia LKB), and 1.25 U AmpliTaq polymerase (Roche, Applied Bioscience). The thermal protocol used for amplification was: 94 °C for 60 s, 60 °C for 60 s, and 72 °C for 60 s for 40 cycles. The Taq polymerase and dNTPs were added to the reaction tube at an 80 °C step between the denaturation and annealing steps of the first cycle (hot start). For DGGE analysis, 10 μL of the PCR product were loaded onto a denaturing gradient gel containing 6% polyacrylamide and a gradient of urea and formamide from 20% to 80%. Gels were run at 160–175 V for 4.5 h in TAE buffer [0.04 M Tris-acetate, 0.001 M EDTA (EDTA)] at a constant temperature of 56 °C. After electrophoresis, the gel was stained with SYBR Green (Biorad) and photographed under UV light. For the direct comparison of TCR clonotypes by DGGE, samples were run in adjacent lanes of the gel, since identical DNA molecules resolve at identical positions.
DNA sequencing
DNA bands that resolved at identical positions in the gel were subjected to direct sequence analysis using the BigDye Terminator v 3.1 cycle sequencing kit (Applied Biosystems), according to manufacturer specifications. In brief, bands were excised from the denaturing gradient gel, and DNA was eluted in 100 μL of water and 1 μL was re-amplified for 32 cycles. A 1 µL aliquot of the PCR product was subsequently sequenced using a 3500 Genetic Analyzer (Applied Biosystems, Hitachi).
Cytofluorometric analyses and cell sorting
Cryo-preserved PBMCs and TILs were thawed and washed in preheated PBS (Hospital pharmacy, Herlev Hospital) supplemented with 2% FCS. Cells were then stained with the following pre-tested fluorochrome-labeled mouse anti-human monoclonal antibodies: anti-PD-1-FITC (eBioscience), anti-LAG3-FITC (Lifespan Biosciences), anti-NKG2D-PE (BD PharMingen), anti-CD45RA-PE-Cy7 (BD PharMingen), anti-BTLA-APC (BioLegend), and anti-CD28-PB (BioLegend). Prior to staining, cells were incubated with 2 µL mouse serum for 10 min to block unspecific binding sites. Afterwards, cells were incubated with the above mentioned antibodies in 100 uL PBS supplemented with 2% FCS at 4 °C for 20 min in the dark, washed and resuspended for analysis. Dead cells were gated out using either the LIVE/DEAD cell death marker (Invitrogen) or, when appropriate, 7AAD-PE-Cy7 (BD PharMingen). Cells were analyzed by flow cytometry on a BD FACS Canto II or BD FACS Aria (BD Bioscience) cytometer equipped with Diva software (Becton Dickinson). Antibody-stained lymphocyte sorting was performed using the BD FACS Aria.
Statistical analyses
Cytofluorometric data were analyzed for statistical significance by 1-way ANOVA and, when appropriate, post-hoc Mann-Whitney U test, a non-parametric test that does not assume normal distribution of values. Control PBMCs, RCC patient-derived PBMCs and RCC-associated TILs were compared pairwise. Differences were considered statistically significant when P < 0.05.
Disclosure of Potential Conflicts of Interest
No potential conflicts of interest were disclosed.
Glossary
Abbreviations:
- BV
β variable
- CTLA-4
cytotoxic T-lymphocyte associated protein 4
- DGGE
denaturing gradient gel electrophoresis
- IL-2
interleukin-2
- LAG3
lymphocyte-activation gene 3
- PD-1
programmed cell death 1
- PBMC
peripheral blood mononuclear cell
- RCC
renal cell carcinoma
- TAA
tumor-associated antigen
- TCR
T-cell receptor
- TCM
central memory T
- TEM
effector memory T
- TEMRA
CD45RA+ effector memory T
- TIL
tumor-infiltrating lymphocyte
Citation: Sittig S, Køllgård T, Gronbaek K, Idorn M, Hennenlotter J, Stenzl A, Gouttefangeas C, thor Straten P. Clonal expansion of renal cell carcinoma-infiltrating T lymphocytes. OncoImmunology 2013; 2:e26014; 10.4161/onci.26014
Footnotes
Previously published online: www.landesbioscience.com/journals/oncoimmunology/article/26014
References
- 1.Powles T, Chowdhury S, Jones R, Mantle M, Nathan P, Bex A, Lim L, Hutson T. Sunitinib and other targeted therapies for renal cell carcinoma. Br J Cancer. 2011;104:741–5. doi: 10.1038/sj.bjc.6606061. [DOI] [PMC free article] [PubMed] [Google Scholar]
- 2.George S, Pili R, Carducci MA, Kim JJ. Role of immunotherapy for renal cell cancer in 2011. J Natl Compr Canc Netw. 2011;9:1011–8. doi: 10.6004/jnccn.2011.0085. [DOI] [PMC free article] [PubMed] [Google Scholar]
- 3.Hodi FS, O’Day SJ, McDermott DF, Weber RW, Sosman JA, Haanen JB, Gonzalez R, Robert C, Schadendorf D, Hassel JC, et al. Improved survival with ipilimumab in patients with metastatic melanoma. N Engl J Med. 2010;363:711–23. doi: 10.1056/NEJMoa1003466. [DOI] [PMC free article] [PubMed] [Google Scholar]
- 4.Peggs KS, Quezada SA, Chambers CA, Korman AJ, Allison JP. Blockade of CTLA-4 on both effector and regulatory T cell compartments contributes to the antitumor activity of anti-CTLA-4 antibodies. J Exp Med. 2009;206:1717–25. doi: 10.1084/jem.20082492. [DOI] [PMC free article] [PubMed] [Google Scholar]
- 5.Peggs KS, Quezada SA, Allison JP. Cancer immunotherapy: co-stimulatory agonists and co-inhibitory antagonists. Clin Exp Immunol. 2009;157:9–19. doi: 10.1111/j.1365-2249.2009.03912.x. [DOI] [PMC free article] [PubMed] [Google Scholar]
- 6.Brahmer JR, Tykodi SS, Chow LQ, Hwu WJ, Topalian SL, Hwu P, Drake CG, Camacho LH, Kauh J, Odunsi K, et al. Safety and activity of anti-PD-L1 antibody in patients with advanced cancer. N Engl J Med. 2012;366:2455–65. doi: 10.1056/NEJMoa1200694. [DOI] [PMC free article] [PubMed] [Google Scholar]
- 7.Topalian SL, Hodi FS, Brahmer JR, Gettinger SN, Smith DC, McDermott DF, Powderly JD, Carvajal RD, Sosman JA, Atkins MB, et al. Safety, activity, and immune correlates of anti-PD-1 antibody in cancer. N Engl J Med. 2012;366:2443–54. doi: 10.1056/NEJMoa1200690. [DOI] [PMC free article] [PubMed] [Google Scholar]
- 8.Hamid O, Robert C, Daud A, Hodi FS, Hwu WJ, Kefford R, Wolchok JD, Hersey P, Joseph RW, Weber JS, et al. Safety and tumor responses with lambrolizumab (anti-PD-1) in melanoma. N Engl J Med. 2013;369:134–44. doi: 10.1056/NEJMoa1305133. [DOI] [PMC free article] [PubMed] [Google Scholar]
- 9.Webster WS, Lohse CM, Thompson RH, Dong H, Frigola X, Dicks DL, Sengupta S, Frank I, Leibovich BC, Blute ML, et al. Mononuclear cell infiltration in clear-cell renal cell carcinoma independently predicts patient survival. Cancer. 2006;107:46–53. doi: 10.1002/cncr.21951. [DOI] [PubMed] [Google Scholar]
- 10.Stickel JS, Weinzierl AO, Hillen N, Drews O, Schuler MM, Hennenlotter J, Wernet D, Müller CA, Stenzl A, Rammensee HG, et al. HLA ligand profiles of primary renal cell carcinoma maintained in metastases. Cancer Immunol Immunother. 2009;58:1407–17. doi: 10.1007/s00262-008-0655-6. [DOI] [PMC free article] [PubMed] [Google Scholar]
- 11.Andersen MH, Becker JC, Straten Pt. Regulators of apoptosis: suitable targets for immune therapy of cancer. Nat Rev Drug Discov. 2005;4:399–409. doi: 10.1038/nrd1717. [DOI] [PubMed] [Google Scholar]
- 12.Dengjel J, Nastke MD, Gouttefangeas C, Gitsioudis G, Schoor O, Altenberend F, Müller M, Krämer B, Missiou A, Sauter M, et al. Unexpected abundance of HLA class II presented peptides in primary renal cell carcinomas. Clin Cancer Res. 2006;12:4163–70. doi: 10.1158/1078-0432.CCR-05-2470. [DOI] [PubMed] [Google Scholar]
- 13.Sato E, Torigoe T, Hirohashi Y, Kitamura H, Tanaka T, Honma I, Asanuma H, Harada K, Takasu H, Masumori N, et al. Identification of an immunogenic CTL epitope of HIFPH3 for immunotherapy of renal cell carcinoma. Clin Cancer Res. 2008;14:6916–23. doi: 10.1158/1078-0432.CCR-08-0466. [DOI] [PubMed] [Google Scholar]
- 14.Bernhard H, Maeurer MJ, Jäger E, Wölfel T, Schneider J, Karbach J, Seliger B, Huber C, Storkus WS, Lotze MT, et al. Recognition of human renal cell carcinoma and melanoma by HLA-A2-restricted cytotoxic T lymphocytes is mediated by shared peptide epitopes and up-regulated by interferon-gamma. Scand J Immunol. 1996;44:285–92. doi: 10.1046/j.1365-3083.1996.d01-304.x. [DOI] [PubMed] [Google Scholar]
- 15.Rittig SM, Haentschel M, Weimer KJ, Heine A, Muller MR, Brugger W, Horger MS, Maksimovic O, Stenzl A, Hoerr I, et al. Intradermal vaccinations with RNA coding for TAA generate CD8+ and CD4+ immune responses and induce clinical benefit in vaccinated patients. Mol Ther. 2011;19:990–9. doi: 10.1038/mt.2010.289. [DOI] [PMC free article] [PubMed] [Google Scholar]
- 16.Gouttefangeas C, Stenzl A, Stevanović S, Rammensee HG. Immunotherapy of renal cell carcinoma. Cancer Immunol Immunother. 2007;56:117–28. doi: 10.1007/s00262-006-0172-4. [DOI] [PMC free article] [PubMed] [Google Scholar]
- 17.Walter S, Weinschenk T, Stenzl A, Zdrojowy R, Pluzanska A, Szczylik C, Staehler M, Brugger W, Dietrich PY, Mendrzyk R, et al. Multipeptide immune response to cancer vaccine IMA901 after single-dose cyclophosphamide associates with longer patient survival. Nat Med. 2012;18 doi: 10.1038/nm.2883. [epub ahead of print] [DOI] [PubMed] [Google Scholar]
- 18.Thor Straten P, Guldberg P, Grønbaek K, Hansen MR, Kirkin AF, Seremet T, Zeuthen J, Becker JC. In situ T cell responses against melanoma comprise high numbers of locally expanded T cell clonotypes. J Immunol. 1999;163:443–7. [PubMed] [Google Scholar]
- 19.thor Straten P, Becker JC, Guldberg P, Zeuthen J. In situ T cells in melanoma. Cancer Immunol Immunother. 1999;48:386–95. doi: 10.1007/s002620050591. [DOI] [PMC free article] [PubMed] [Google Scholar]
- 20.thor Straten P, Schrama D, Andersen MH, Becker JC. T cell clonotypes in cancer. J Transl Med. 2004;2:11. doi: 10.1186/1479-5876-2-11. [DOI] [PMC free article] [PubMed] [Google Scholar]
- 21.Attig S, Hennenlotter J, Pawelec G, Klein G, Koch SD, Pircher H, Feyerabend S, Wernet D, Stenzl A, Rammensee HG, et al. Simultaneous infiltration of polyfunctional effector and suppressor T cells into renal cell carcinomas. Cancer Res. 2009;69:8412–9. doi: 10.1158/0008-5472.CAN-09-0852. [DOI] [PubMed] [Google Scholar]
- 22.Nagorsen D, Scheibenbogen C, Marincola FM, Letsch A, Keilholz U. Natural T cell immunity against cancer. Clin Cancer Res. 2003;9:4296–303. [PubMed] [Google Scholar]
- 23.Derré L, Bruyninx M, Baumgaertner P, Devevre E, Corthesy P, Touvrey C, Mahnke YD, Pircher H, Voelter V, Romero P, et al. In Vivo Persistence of Codominant Human CD8+ T Cell Clonotypes Is Not Limited by Replicative Senescence or Functional Alteration. J Immunol. 2007;179:2368–79. doi: 10.4049/jimmunol.179.4.2368. [DOI] [PubMed] [Google Scholar]
- 24.Thor Straten P, Barfoed A, Seremet T, Saeterdal I, Zeuthen J, Guldberg P. Detection and characterization of alpha-beta-T-cell clonality by denaturing gradient gel electrophoresis (DGGE) Biotechniques. 1998;25:244–50. doi: 10.2144/98252st05. [DOI] [PubMed] [Google Scholar]
- 25.Miller KM, Ming TJ, Schulze AD, Withler RE. Denaturing gradient gel electrophoresis (DGGE): a rapid and sensitive technique to screen nucleotide sequence variation in populations. Biotechniques. 1999;27:1016–8, 1020-2, 1024 passim. doi: 10.2144/99275rr02. [DOI] [PubMed] [Google Scholar]
- 26.Hadrup SR, Strindhall J, Køllgaard T, Seremet T, Johansson B, Pawelec G, thor Straten P, Wikby A. Longitudinal studies of clonally expanded CD8 T cells reveal a repertoire shrinkage predicting mortality and an increased number of dysfunctional cytomegalovirus-specific T cells in the very elderly. J Immunol. 2006;176:2645–53. doi: 10.4049/jimmunol.176.4.2645. [DOI] [PubMed] [Google Scholar]
- 27.Hadrup SR, Braendstrup O, Jacobsen GK, Mortensen S, Pedersen LO, Seremet T, Andersen MH, Becker JC, Straten PT. Tumor infiltrating lymphocytes in seminoma lesions comprise clonally expanded cytotoxic T cells. Int J Cancer. 2006;119:831–8. doi: 10.1002/ijc.21894. [DOI] [PubMed] [Google Scholar]
- 28.Appay V, van Lier RA, Sallusto F, Roederer M. Phenotype and function of human T lymphocyte subsets: consensus and issues. Cytometry A. 2008;73A:975–83. doi: 10.1002/cyto.a.20643. [DOI] [PubMed] [Google Scholar]
- 29.Okazaki T, Okazaki IM, Wang J, Sugiura D, Nakaki F, Yoshida T, Kato Y, Fagarasan S, Muramatsu M, Eto T, et al. PD-1 and LAG-3 inhibitory co-receptors act synergistically to prevent autoimmunity in mice. J Exp Med. 2011;208:395–407. doi: 10.1084/jem.20100466. [DOI] [PMC free article] [PubMed] [Google Scholar]
- 30.Markel G, Cohen-Sinai T, Besser MJ, Oved K, Itzhaki O, Seidman R, Fridman E, Treves AJ, Keisari Y, Dotan Z, et al. Preclinical evaluation of adoptive cell therapy for patients with metastatic renal cell carcinoma. Anticancer Res. 2009;29:145–54. [PubMed] [Google Scholar]
- 31.Pardoll DM. The blockade of immune checkpoints in cancer immunotherapy. Nat Rev Cancer. 2012;12:252–64. doi: 10.1038/nrc3239. [DOI] [PMC free article] [PubMed] [Google Scholar]
- 32.Andersen RS, Thrue CA, Junker N, Lyngaa R, Donia M, Ellebæk E, Svane IM, Schumacher TN, Thor Straten P, Hadrup SR. Dissection of T-cell antigen specificity in human melanoma. Cancer Res. 2012;72:1642–50. doi: 10.1158/0008-5472.CAN-11-2614. [DOI] [PubMed] [Google Scholar]
- 33.Beckhove P, Warta R, Lemke B, Stoycheva D, Momburg F, Schnölzer M, Warnken U, Schmitz-Winnenthal H, Ahmadi R, Dyckhoff G, et al. Rapid T cell-based identification of human tumor tissue antigens by automated two-dimensional protein fractionation. J Clin Invest. 2010;120:2230–42. doi: 10.1172/JCI37646. [DOI] [PMC free article] [PubMed] [Google Scholar]
- 34.Fridman WH, Pagès F, Sautès-Fridman C, Galon J. The immune contexture in human tumours: impact on clinical outcome. Nat Rev Cancer. 2012;12:298–306. doi: 10.1038/nrc3245. [DOI] [PubMed] [Google Scholar]
- 35.Donskov F, von der Maase H. Impact of immune parameters on long-term survival in metastatic renal cell carcinoma. J Clin Oncol. 2006;24:1997–2005. doi: 10.1200/JCO.2005.03.9594. [DOI] [PubMed] [Google Scholar]
- 36.Nakano O, Sato M, Naito Y, Suzuki K, Orikasa S, Aizawa M, Suzuki Y, Shintaku I, Nagura H, Ohtani H. Proliferative activity of intratumoral CD8(+) T-lymphocytes as a prognostic factor in human renal cell carcinoma: clinicopathologic demonstration of antitumor immunity. Cancer Res. 2001;61:5132–6. [PubMed] [Google Scholar]
- 37.Kondo T, Nakazawa H, Ito F, Hashimoto Y, Osaka Y, Futatsuyama K, Toma H, Tanabe K. Favorable prognosis of renal cell carcinoma with increased expression of chemokines associated with a Th1-type immune response. Cancer Sci. 2006;97:780–6. doi: 10.1111/j.1349-7006.2006.00231.x. [DOI] [PMC free article] [PubMed] [Google Scholar]
- 38.Remark R, Alifano M, Cremer I, Lupo A, Dieu-Nosjean MC, Riquet M, Crozet L, Ouakrim H, Goc J, Cazes A, et al. Characteristics and Clinical Impacts of the Immune Environments in Colorectal and Renal Cell Carcinoma Lung Metastases: Influence of Tumor Origin. Clin Cancer Res. 2013;19:4079–91. doi: 10.1158/1078-0432.CCR-12-3847. [DOI] [PubMed] [Google Scholar]
- 39.thor Straten P, Guldberg P, Andersen MH, Moerch U, Seremet T, Siedel C, et al. In situ cytokine therapy: Redistribution of clonally expanded therapeutic T-cell clones. Eur J Immunol. 2001;31:250–8. doi: 10.1002/1521-4141(200101)31:1<250::AID-IMMU250>3.0.CO;2-8. [DOI] [PubMed] [Google Scholar]
- 40.Escudier B. Emerging immunotherapies for renal cell carcinoma. Ann Oncol. 2012;23(Suppl 8):viii35-–40. doi: 10.1093/annonc/mds261. [DOI] [PubMed] [Google Scholar]
- 41.Wang QJ, Hanada KI, Robbins PF, Li YF, Yang JC. Distinctive features of the differentiated phenotype and infiltration of tumor-reactive lymphocytes in clear cell renal cell carcinoma. Cancer Res. 2012;72:6119–29. doi: 10.1158/0008-5472.CAN-12-0588. [DOI] [PMC free article] [PubMed] [Google Scholar]
- 42.Claus C, Riether C, Schürch C, Matter MS, Hilmenyuk T, Ochsenbein AF. CD27 signaling increases the frequency of regulatory T cells and promotes tumor growth. Cancer Res. 2012;72:3664–76. doi: 10.1158/0008-5472.CAN-11-2791. [DOI] [PubMed] [Google Scholar]
- 43.Blank C, Kuball J, Voelkl S, Wiendl H, Becker B, Walter B, Majdic O, Gajewski TF, Theobald M, Andreesen R, et al. Blockade of PD-L1 (B7-H1) augments human tumor-specific T cell responses in vitro. Int J Cancer. 2006;119:317–27. doi: 10.1002/ijc.21775. [DOI] [PubMed] [Google Scholar]
- 44.Okazaki T, Okazaki IM, Wang J, Sugiura D, Nakaki F, Yoshida T, Kato Y, Fagarasan S, Muramatsu M, Eto T, et al. PD-1 and LAG-3 inhibitory co-receptors act synergistically to prevent autoimmunity in mice. J Exp Med. 2011;208:395–407. doi: 10.1084/jem.20100466. [DOI] [PMC free article] [PubMed] [Google Scholar]
- 45.Angevin E, Farace F, Genevée C, Henry-Amar M, Caignard A, Dietrich PY, Escudier B, Hercend T, Triebel F. Analysis of T-cell-receptor variable gene segment usage in peripheral-blood lymphocytes of advanced cancer patients. Int J Cancer. 1993;54:60–7. doi: 10.1002/ijc.2910540111. [DOI] [PubMed] [Google Scholar]
- 46.Angevin E, Kremer F, Gaudin C, Hercend T, Triebel F. Analysis of T-cell immune response in renal cell carcinoma: polarization to type 1-like differentiation pattern, clonal T-cell expansion and tumor-specific cytotoxicity. Int J Cancer. 1997;72:431–40. doi: 10.1002/(SICI)1097-0215(19970729)72:3<431::AID-IJC10>3.0.CO;2-F. [DOI] [PubMed] [Google Scholar]
- 47.Gastl G, Ebert T, Finstad CL, Sheinfeld J, Gomahr A, Aulitzky W, Bander NH. Major histocompatibility complex class I and class II expression in renal cell carcinoma and modulation by interferon gamma. J Urol. 1996;155:361–7. doi: 10.1016/S0022-5347(01)66661-8. [DOI] [PubMed] [Google Scholar]
- 48.Inozume T, Hanada K, Wang QJ, Ahmadzadeh M, Wunderlich JR, Rosenberg SA, Yang JC. Selection of CD8+PD-1+ lymphocytes in fresh human melanomas enriches for tumor-reactive T cells. J Immunother. 2010;33:956–64. doi: 10.1097/CJI.0b013e3181fad2b0. [DOI] [PMC free article] [PubMed] [Google Scholar]
- 49.Thompson RH, Kwon ED, Allison JP. Inhibitors of B7-CD28 costimulation in urologic malignancies. Immunotherapy. 2009;1:129–39. doi: 10.2217/1750743X.1.1.129. [DOI] [PMC free article] [PubMed] [Google Scholar]
- 50.Brahmer JR, Drake CG, Wollner I, Powderly JD, Picus J, Sharfman WH, Stankevich E, Pons A, Salay TM, McMiller TL, et al. Phase I study of single-agent anti-programmed death-1 (MDX-1106) in refractory solid tumors: safety, clinical activity, pharmacodynamics, and immunologic correlates. J Clin Oncol. 2010;28:3167–75. doi: 10.1200/JCO.2009.26.7609. [DOI] [PMC free article] [PubMed] [Google Scholar]
- 51.Kollgaard T, Petersen SL, Hadrup SR, Masmas TN, Seremet T, Andersen MH, Madsen HO, Vindeløv L, Thor Straten P. Evidence for involvement of clonally expanded CD8+ T cells in anticancer immune responses in CLL patients following nonmyeloablative conditioning and hematopoietic cell transplantation. Leukemia. 2005;19:2273–80. doi: 10.1038/sj.leu.2403972. [DOI] [PubMed] [Google Scholar]
- 52.thor Straten P, Kirkin AF, Siim E, Dahlström K, Drzewiecki KT, Seremet T, Zeuthen J, Becker JC, Guldberg P. Tumor infiltrating lymphocytes in melanoma comprise high numbers of T-cell clonotypes that are lost during in vitro culture. Clin Immunol. 2000;96:94–9. doi: 10.1006/clim.2000.4890. [DOI] [PubMed] [Google Scholar]