

Background: LMBD1 is a transmembrane protein encoded by the lmbrd1 gene. Its biological function remains unclear.
Results: lmbrd1 knockdown hinders the internalization of the insulin receptor, allowing it and its downstream signaling molecules to remain activated.
Conclusion: LMBD1 functions as an insulin receptor-specific adaptor for endocytosis.
Significance: LMBD1 is the first identified protein that participates in the regulation of insulin receptor endocytosis.
Keywords: Akt, Antisense RNA, Cell Signaling, Cell Surface Receptor, Confocal Microscopy, Endocytosis, Flow Cytometry, Glucose Metabolism, In Vivo Imaging, Insulin
Abstract
Energy homeostasis is crucial for maintaining normally functioning cells; disturbances in this balance often cause various diseases. The limb region 1 (LMBR1) domain containing 1 gene (lmbrd1) encodes the LMBD1 protein that possesses 9 putative transmembrane domains. LMBD1 has been suggested to be involved in the lysosome in aiding the export of cobalamin. In this study, we determined that LMBD1 plays a regulatory role in the plasma membrane. A micro-positron emission tomography analysis showed that a single-allele knock-out of lmbrd1 increased the 18F-fluorodeoxyglucose uptake in murine hearts. In addition, the knockdown of lmbrd1 resulted in an up-regulated signaling of the insulin receptor (IR) and its downstream signaling molecule, Akt. Confocal and live total internal reflection fluorescence microscopy showed that LMBD1 co-localized and co-internalized with clathrin and the IR, but not with the transferrin receptor. The results of the mutation analysis and phenotypic rescue experiments indicate that LMBD1 interacts with adaptor protein-2 and is involved in the unique clathrin-mediated endocytosis of the IR. LMBD1 selectively interacts with the IR. The knockdown of lmbrd1 attenuated IR endocytosis, resulting in the perturbation of the IR recycling pathway and consequential enhancement of the IR signaling cascade. In summary, LMBD1 plays an imperative role in mediating and regulating the endocytosis of the IR.
Introduction
The insulin receptor (IR)2 is a receptor tyrosine kinase that controls mammalian growth and maintains the homeostasis of lipid and glucose metabolism (1). It is expressed on the plasma membrane (PM) as a tetrameric protein that consists of two α subunits and two β subunits linked by disulfide bonds (2). When insulin binds to the IR, it amplifies insulin signals by stimulating a structural change in the IR, allowing the activation of its tyrosine kinase activity. The trans-phosphorylation of the two β subunits functions as a signal for the recruitment and activation of its downstream signaling molecules, PI3K and Akt (3). IR signaling is terminated through receptor-mediated endocytosis followed by the action of tyrosine phosphatase PTP1B in the endosomal compartments (4–6).
Clathrin-mediated endocytosis is a major pathway for receptor internalization, which is essential for both the recycling of proteins and receptors on the PM and the intracellular signaling (7). The assembling of clathrin-coated pits, including the recruitment of adaptor proteins and clathrin triskelion, is tightly co-ordinated in a precise, spatiotemporal manner (8). Adaptor protein-2 (AP-2), although not the nucleator of the clathrin-coated pits (9), facilitates this process by recruiting clathrin, cargoes, and accessory proteins by using its specific motifs (10). Incorporation of the transmembrane cargoes into the clathrin-coated pits requires the cargo proteins to contain specific adaptor protein recognition motifs, such as the YXXΦ motif being recognized by the μ2 subunit of AP-2, a process that has been shown to be meticulously governed. After binding to PtdIns(4,5P)2-rich PM, AP-2 undergoes a huge conformation change from its locked cytosolic form in which the YXXΦ motif binding site of the μ2 subunit is blocked to an unlatched form that allows all cargoes containing the YXXΦ motif to bind (11). Concurrently with the cargo incorporation, clathrin lattice and clathrin-associated sorting proteins are clustered forming a scaffold that facilitates the stabilization, invagination, membrane reshaping, and eventually scission of the coated vesicles (12).
Because cargoes are internalized in a noncompetitive, nonsaturable manner, cargo selectivity is observed (13). The transferrin receptor (TrfR), an AP-2 cargo that possesses the YXXΦ motif, was found to be selectively internalized through its cargo-specific adaptor, the transferrin receptor trafficking protein (TTP) (14). Deletion of the TTP results in the retention of TrfR on the PM. Similarly, although the juxtamembrane dileucine motif of the IR is essential for AP-2-clathrin-mediated endocytosis (15), the adaptor protein that specifically regulates the internalization of the IR remains unidentified.
The limb region 1 (LMBR1) domain containing 1 gene (lmbrd1) encodes proteins that belong to the membrane protein family of lipocalin-1-interacting membrane receptors. Two major proteins are encoded by the lmbrd1, namely, the nuclear export signal-interacting protein (NESI, 467 amino acid residues) and the LMBD1 protein (540 amino acid residues). The LMBD1 protein contains 73 additional amino acid residues at the N terminus of the NESI protein. Previous studies have shown that NESI is critical for the assembly of the hepatitis δ virus (16) and that double allele frameshift mutations of lmbrd1 are associated with the deficiency of lysosomal cobalamin export (17). However, the biological function of LMBD1 remains unclear. In this study, we determined that PM-localized LMBD1 functions as a specific adaptor for the clathrin-mediated endocytosis of the IR.
EXPERIMENTAL PROCEDURES
Knock-out Mouse Generation
lmbrd1+/− mice on a C57BL/6 background were generated by using the Cre-loxP system that allowed deletion of the exons 6 and 7 of the lmbrd1 gene. All experiments were performed using male mice that had been backcrossed into the C57BL/6 background for five generations. Mice were maintained in the Animal Center at the College of Medicine, National Taiwan University, Taiwan. Mouse experimental protocols were approved by the Animal Welfare Committees of National Taiwan University.
Micro-Positron Emission Tomography (Micro-PET)
For micro-PET analysis, mice were fasted for 6 h before the experiments. Micro-PET images of the cardiac uptake of 18F-fluorodeoxyglucose (18F-FDG) were visualized and analyzed by using eXplore Vista PET/CT (General Electric Healthcare) as described previously (18). Briefly, mice were anesthetized using 5% isoflurane in oxygen before intravenous injection of 18F-FDG for glucose uptake analysis. Micro-computed tomography (micro-CT) was used for anatomical alignment. Image reconstruction was conducted using the three-dimensional ordered-subsets expectation maximization (OSEM) algorithm. The signals of selected regions of interest (ROIs) were normalized to the body weight of mice and the total amount of the radioisotope injected, to obtain the standardized uptake value. ECG-gated PET images were collected as described previously (19) with minor modifications. In brief, 30 min after the injection of 18F-FDG, PET acquisition was initiated with simultaneous ECG recording for 1 h. For ECG acquisition, ECG and respiratory parameters were measured with an independent system (BioVet, Spin Systems Pty Ltd.). ECG electrodes were placed on both forepaws and the left hind paw, and the respiratory sensors were placed under the chest. PET list-mode images were sorted into 12 gates and reconstructed using OsiriX.
Plasmids and siRNA
Plasmids pGEMT-Easy-LMBD1, pCRII-TOPO-LMBD1, and pcDNA4-LMBD1-myc-His
For generation of plasmid pGEMT-Easy-LMBD1, a 1.7-kb LMBD1 cDNA fragment was obtained from Huh7 RNA following a reverse transcription and amplification by PCR using the primer set 5′-GAA TTC GAA AGC TTA GAT GGC GAC-3′ and 5′-CTC TAG ACT CGA GCG GTC AAG CAG-3′ and cloned into pGEMT-Easy®. Plasmid pGEMT-Easy-LMRD1 was subjected to sequencing verification. For generation of plasmid pcDNA4-LMBD1-myc-His encoding a myc-His-tagged LMBD1 protein, a 1.7-kb LMBD1 cDNA fragment with stop codon removed by using the primer set 5′-AGT TAA GCT TAG CTC GAG GCC GCC ATG GCG ACT TCT GGC-3′ (L5–540) and 5′-GAC GCG TCT AGA CTG CAG GGC CCA AGC AGA ATA GAC AGA GG-3′ (Ps-Xb, with the underlined nucleotides indicating the mutated stop codon site) in PCR was first cloned into the pCR®II-TOPO® (Invitrogen) vector, generating pCRII-TOPO-LMBD1 for sequence verification. Plasmid pCRII-TOPO-LMBD1 was then digested with KpnI and XbaI restriction endonucleases, and the resultant 1.7-kb DNA fragment was cloned into the KpnI/XbaI sites of the pcDNA4/myc-His A (Invitrogen) to generate plasmid pcDNA4-LMBD1-myc-His.
Plasmids pLMBD1-GFP and pLMBD1-DsRed
For construction of plasmids pLMBD1-GFP and pLMBD1-DsRed, plasmid pcDNA4-LMBD1-myc-His was digested with ApaI restriction endonuclease at 25 °C. The resultant 2.3-kb DNA fragment was independently inserted into the ApaI site of pDsRed monomer-N1 (Clontech) and pEGFP-N1 (Clontech). A further digestion with KpnI eliminated a 0.65-kb DNA fragment from the resultant plasmids and generated plasmids pLMBD1-GFP and pLMBD1-DsRed, respectively.
Plasmids pcDNA4-LMBD1(Y233A)-myc-His and pcDNA4-LMBD1(W295A)-myc-His
For construction of plasmid pcDNA4-LMBD1(Y233A)-myc-His, plasmid pGEMT-Easy-LMBD1 was used as a template for PCR amplification with the following primers: 5′-GGC ACT AGA AGC GCT GCT GCT GAA CGT TTG GAA AAC ACT G-3′ (the underlined nucleotides correspond to the amino acid substitution from Tyr-233 to Ala-233; Y233A) and 5′-ATT TAG GTG ACA CTA TAG AAT-3′ (SP6). The 1.3-kb PCR product was cloned into the pCR®II-TOPO® vector, generating pCRII-TOPO-LM-C-(Y233A) for sequence verification. Following an AfeI/XbaI restriction endonuclease digestion of the plasmid pCRII-TOPO-LM-C-(Y233A), the resultant 0.95-kb DNA fragment was used to replace the cognate DNA fragment of pcDNA4-LMBD1-myc-His to generate pcDNA4-LMBD1(Y233A)-myc-His. For generation of plasmid pcDNA4-LMBD1(W295A)-myc-His, plasmid pGEMT-Easy-LMBD1 was used as a template for two independent PCRs, one using the primer set SP6 and 5′-GAA AAC AGC TGG GCG ACA AAA TTT TGT GGC GCT CTG C-3′ (ATKF) and the other using the primer set 5′-TAA TAC GAC TCA CTA TAG GG-3′ (T7) and 5′-G CAG AGC GCC ACA AAA TTT TGT CGC CCA GCT GTT TTC-3′ (ATKF reverse), with the underlined nucleotides indicating the W295A amino acid substitution. The resultant PCR products were mixed in a 1:1 molar ratio, heated to 100 °C for 5 min for double-helix denaturing, and then cooled to room temperature allowing the overlapping sequences to anneal. The mixture was used as a DNA template for PCR amplification using SP6 and T7 primers to obtain a 2.1-kb DNA product that was then cloned into the pCR®II-TOPO® vector to generate pCRII-TOPO-LM-C-(W295A) for sequence verification. Following an AfeI/XbaI restriction endonuclease digestion of the plasmid pCRII-TOPO-LM-C-(W295A), the resultant 0.95-kb DNA fragment was used to replace the cognate DNA fragment of pcDNA4-LMBD1-myc-His to generate pcDNA4-LMBD1(W295A)-myc-His.
Plasmids pLMBD1-shRNAlmbrd1R-myc-His, pLMBD1-shRNAlmbrd1R(Y233A)-myc-His, and pLMBD1-shRNAlmbrd1R(W295A)-myc-His
For construction of plasmids encoding the wild-type shRNA-resistant LMBD1 and its mutants, a 0.8-kb DNA fragment was first generated by PCR amplification using pcDNA4-LMBD1-myc-His as a template and the primer set L5-540 described earlier and 5′-C GCT TCT AGT GCC TTT TAT AAG GTT CAA TGG CAA AGC AGA CAT GCC ATA G-3′ (shR80, the underlined nucleotides correspond to nucleotides changed at the wobble positions), and cloned into the pCR®II-TOPO® vector to generate pCRII-TOPO-LMBD1(1–258)shRNAlmbrd1R for sequence verification. Following KpnI/AfeI restriction endonuclease digestion of the plasmid pCRII-TOPO-LMBD1(1–258)shRNAlmbrd1R, the resultant 0.8-kb DNA fragment was used to independently replace the cognate DNA fragments of pcDNA4-LMBD1-myc-His, pcDNA4-LMBD1(Y233A)-myc-His, and pcDNA4-LMBD1(W295A)-myc-His to generate plasmids pLMBD1-shRNAlmbrd1R-myc-His (pLMBD1-shR in short), pLMBD1-shRNAlmbrd1R(Y233A)-myc-His (pLMBD1-shR(Y233A) in short), and pLMBD1-shRNAlmbrd1R(W295A)-myc-His (pLMBD1-shR(W295A) in short), respectively.
Plasmid pDsRed-shRNAlmbrd1
For construction of plasmid pDsRed-shRNAlmbrd1, plasmid pDsRed-Monomer-C1 (Clontech) was digested with AflIII restriction endonuclease and treated with the Klenow fragment of DNA polymerase I. The resultant 1.7-kb DNA fragment that consists of the human cytomegalovirus (CMV) immediate early promoter, DsRed monomer, and mRNA polyadenylation signal, was then cloned into the AflIII- and Klenow fragment-treated pLKO.1-shRNAlmbrd1 to generate plasmid pDsRed-shRNAlmbrd1.
Plasmids pLKO.1-shRNAlmbrd1 and pLKO.1-shRNAluc
Lentiviral vectors pLKO.1-shRNAlmbrd1 and pLKO.1-shRNAluc targeting lmbrd1 and luciferase control at 5′-GCGTTACCTTTAAATCTGATA-3′ (shRNAlmbrd1) and 5′-CTTCGAAATGTCCGTTCGGTT-3′ (shRNAluc), respectively, were purchased from the National RNAi Core Facility, Academia Sinica, Taiwan.
siRNAlmbrd1
siRNA duplexes targeting lmbrd1 at 5′-NNAACGGCACUCAAGUAUACU-3′ (siRNAlmbrd1 no. 4), 5′-NNAGGUUACGAACACUUAAGA-3′ (siRNAlmbrd1 no. 5), and 5′-NNAGCAAAGAUGGUCGACCUU-3′ (siRNAlmbrd1 no. 6) were synthesized by Dharmacon RNAi Technologies.
Cell Culture and Transfection
HL-1 and H9C2 cells were cultured as described previously (20). In brief, HL-1 cells were routinely cultured in Claycomb medium, which contains 10 μg/ml insulin (JRH Bioscience), supplemented with 10% fetal bovine serum, 10 μm norepinephrine (Sigma), 2 mm l-glutamine (Invitrogen), 100 units/ml penicillin (Invitrogen), and 100 μg/ml streptomycin (Invitrogen). H9C2 cells were cultured in DMEM supplemented with 10% fetal bovine serum, 2 mm l-glutamine, 100 units/ml penicillin, and 100 μg/ml streptomycin. In insulin-induction experiments, the cultured cells were washed with PBS and incubated with serum-free DMEM for 1 h at 37 °C prior to the induction with 10 μg/ml insulin. Transient transfections of siRNA and plasmid DNA were performed using FuGENE (Roche Applied Science) in accordance with the manufacturer's instructions.
Primary Ventricular Cardiomyocyte Isolation and NucleofectorTM Transfection
Primary rat ventricular cardiomyocytes were isolated as described previously (21, 22). In brief, ventricles were isolated from 25 neonatal rat hearts. The isolated ventricles were digested in a buffer containing 16.8 mg of collagenase type II (Invitrogen), 48 mg of pancreatin (Sigma), and 1.8 mg of DNase I (Roche Applied Science) in 120 ml of HEPES buffer, and preplated twice for fibroblast removal. To knock down the lmbrd1 gene, lmbrd1 siRNA was introduced into the primary cardiomyocytes by using the Amaxa Rat Cardiomyocyte Neonatal Nucleofector® Kit (Nucleofector Program G-009) in accordance with the manufacturer's protocol. Primary cardiomyocytes were cultured on collagen I (BD Biosciences)-coated plates.
Preparation of Whole Cell Lysates and Western Blot Analysis
For whole cell protein extraction, cells were homogenized in radioimmunoprecipitation assay buffer (108 mm NaCl, 50 mm Tris-Cl, 1% sodium deoxycholic acid, 1% Triton X-100, 0.1% SDS, CompleteTM protease inhibitor cocktail (Roche Applied Science), and phosphatase inhibitor cocktail II (Sigma)), and subjected to centrifugation at 12,000 × g, 4 °C for 20 min. The cell lysates were fractionated on SDS-8% polyacrylamide gel under reducing conditions. Western blot analysis was performed on PVDF membranes (Millipore) by using ECLTM Western blotting detection reagents (GE Healthcare). Proteins recognized by specific antibodies were detected using the ImageReader LAS-4000 imaging system (Fujifilm) and quantified by using Gel-Pro 3.1 software.
Immunoprecipitation Assay
For immunoprecipitation assay, 1 mg of whole cell lysate was incubated with specific antibody at 4 °C in a buffer consisting of 108 mm NaCl, 50 mm Tris-Cl, pH 7.5, 0.5% sodium deoxycholic acid, 0.5% Triton X-100, 0.05% SDS, and CompleteTM protease inhibitors for 16 h, followed by an incubation with protein A/G (Santa Cruz Biotechnology) for an additional 1 h at 4 °C. The precipitates were washed three times with radioimmunoprecipitation assay buffer, denatured at 95 °C for 10 min, and subjected to SDS-polyacrylamide gel electrophoresis (PAGE) for Western blot analysis.
Flow Cytometry Analysis
Forty-eight hours after transfection, cells were subjected to serum starvation at 37 °C for 2 h prior to flow cytometry analysis for examining cell surface IR and transferrin uptake. For surface IR staining, cells were scraped off from cultured dishes following incubation with a protease-free dissociation buffer containing 5 mm EDTA in PBS, fixed using 2% paraformaldehyde in PBS for 20 min without permeabilization, and labeled using the mouse antibody specific to the IR α subunit for 1 h at 4 °C. After washing three times with PBS and centrifugation at 800 × g for 5 min at 4 °C, the cells were incubated with the Alexa Fluor 488-conjugated goat anti-mouse IgG antibody for 30 min on ice. Transferrin uptake assay was performed as described previously (23) with modifications. In brief, after serum starvation, cells were treated with Alexa Fluor 488-conjugated transferrin at a concentration of 5 μg/ml for 20 min, followed by PBS wash and trypsin digestion. All samples from surface IR staining and transferrin uptake assay were subjected to FACSCaliburTM flow cytometry (BD Biosciences), and the data were analyzed by using the CellQuest software (BD Biosciences).
Immunofluorescence Confocal Microscopy
HL-1 cells grown on fibronectin-/gelatin-coated coverslips were serum-starved for 2 h prior to insulin induction (10 μg/ml) for 10 min at 37 °C in serum-free DMEM, followed immediately by a fixation using 4% paraformaldehyde in PBS for 20 min, permeabilization using a buffer containing 0.1% Triton X-100 in PBS for 10 min, and a blocking with 5% BSA in PBS for 1 h at room temperature. The cells were then incubated with primary antibodies in PBS containing 3% BSA at 4 °C overnight, washed three times with PBS, and incubated with Alexa Fluor 594-conjugated goat anti-rabbit IgG or Alexa Fluor 488-conjugated goat anti-mouse IgG antibodies along with Hoechst 33258 (Invitrogen) in PBS containing 3% BSA for 1 h at room temperature. The samples were washed three times with PBS before mounting. Images were captured by using a Leica Sp5 confocal microscope with a 63×/1.4 numerical aperture oil-immersion objective (Leica).
Surface Protein Biotinylation Assay
Biotinylation of surface proteins was performed as described previously (24) with modifications. In brief, cells were incubated with EZ-Link-NHS-SS-biotin (300 μg/ml; Pierce) at 37 °C for 2 min. Immediately after biotinylation, the cells were washed using Tris-buffered saline to remove excess biotin. For the analysis of the insulin-induced IR endocytosis, H9C2 cells transfected using siRNA targeting lmbrd1 (siRNAlmbrd1) were then cultured in DMEM supplemented with insulin (10 μg/ml) for various time periods at 37 °C. Protein trafficking was halted at specific time points by rapid cooling to 4 °C. Biotinylated proteins that remained on the cell surface were stripped by the treatment of nonpermeant glutathione (150 mm glutathione in 150 mm NaCl, pH 8.7). Following a subsequent neutralization of glutathione with 50 mm iodoacetamide in PBS, the cells were washed using ice-cold PBS three times and then lysed in radioimmunoprecipitation assay buffer. Cell lysates subjected to centrifugation at 16,000 × g after sonication were quantitated and incubated with NeutrAvidin beads (Pierce) for 1 h at 25 °C. After washing, biotin-labeled proteins were eluted from the NeutrAvidin beads by boiling in sample buffer (50 mm Tris-HCl, 2.5% β-mercaptoethanol, 2% SDS, 10% glycerol, 0.1% bromphenol blue) containing 50 mm DTT for 5 min and subjected to SDS-PAGE for Western blot analysis. To harvest total surface proteins, cells were labeled with EZ-Link-NHS-SS-biotin as described above without the treatment of glutathione.
Total Internal Reflection Fluorescence (TIRF) Microscopy
For fixed cell TIRF microscopy analysis, cells at 48 h after transfection with plasmid pDsRed-shRNAlmbrd1 were fixed using 4% paraformaldehyde in PBS for 20 min. Permeabilization and antibody staining were performed as described earlier under “Immunofluorescence Confocal Microscopy.” The stained cells on Deckglaser coverslips were subjected to TIRF analysis in the presence of PBS without mounting. The total IR and TrfR signals were observed through the epi-fluorescence channel, and PM signals were observed by using TIRF microscopy with an evanescent field depth of 100 nm. For live cell TIRF imaging, cells plated on Deckglaser coverslips were transfected using plasmids expressing LMBD1-GFP, LMBD1-DsRed, IR-GFP (a kind gift from Professor Joseph Bass, Northwestern University, Illinois), and RFP-clathrin light chain (CLC) (a kind gift from Professor Lois E. Greene, National Institutes of Health). Thirty-six hours after transfection, cells were serum-starved in DMEM at 37 °C for 2 h prior to TIRF analysis. Serum-free DMEM was replaced with serum-free DMEM containing insulin (100 nm; Invitrogen) or Alexa Fluor 594-conjugated transferrin (5 μg/ml; Molecular Probe) preincubated at 37 °C. The addition of insulin and Alexa Fluor 594-conjugated transferrin ligand was performed by using the perfusion method. The cells were kept in a 37 °C incubator with 5% CO2 throughout the entire imaging process. TIRF imaging of cells was performed by using a Laser TIRF3 Imaging system (Carl Zeiss) based on the modular research platform of Axio Observer.Z1 (Carl Zeiss) equipped with 405-, 488-, and 561-nm lasers and a filter set 77 HE GFP + mRFP +Alexa Fluor 633 shift-free module (Carl Zeiss). Samples were viewed through a high numerical aperture 100×objective lens (α PlanApochromat 100×/1.57 Oil-HI differential interference contrast Corr, Carl Zeiss). Images were acquired by using EMCCD eVOLVeTM (Photometrics, Tucson, AZ). To eliminate the possibility that the photobleaching effect of the laser might cause a decrease in the TIRF fluorescent signal, epi-fluorescence images were acquired. Image processing and analysis were performed by using ZEN Black Edition 2011 (Carl Zeiss). For fixed cell intensity analysis, ROIs were circled in the differential interference contrast channel. The background intensity was deducted by placing the ROI over areas devoid of any specific fluorescent signal. The number of TIRF signals/pixel detected was divided by the epi-fluorescence signal to obtain the normalized relative PM retention signal. For live cell analysis, similar steps were taken using ROIs to quantify specific TIRF signals versus time.
Antibodies
Mouse anti-TrfR antibody was obtained from Invitrogen. Mouse anti-AP-2 antibody and mouse anti-clathrin heavy chain antibody were obtained from BD Biosciences. Rabbit anti-Akt, rabbit anti-Ser473 Akt, and mouse anti-GAPDH antibodies were obtained from Santa Cruz Biotechnology. Rabbit anti-phospho-IR (pTyr1158/pTyr1162/pTyr1163) antibodies, mouse anti-IR β subunit antibody, and rabbit anti-myc antibody were obtained from Upstate Biotechnology. Mouse anti-IR α subunit antibody was obtained from Millipore. Rabbit anti-LMBD1 antibody recognizing the C-terminal motif (amino acid residues 522–540) was prepared as described previously (16). Goat anti-rabbit and goat anti-mouse HRP-conjugated antibodies were from Jackson ImmunoResearch Laboratories.
Opti-Prep Gradient
For the isolation of clathrin-coated vesicles (CCVs), an Opti-PrepTM (Axis-Shield PoC AS, Oslo Norway) continuous gradient consisting of 10–40% iodixanol solution was applied as described previously (25).
Statistics
Statistical comparisons were made by using the two-tailed Student's t test and are presented as the means ± S.D., with a p value < 0.05 considered to be of statistical significance.
RESULTS
A Single-allele Knock-out of lmbrd1 Results in the Up-regulation of Glucose Uptake
To evaluate the biological function of LMBD1, single-allele lmbrd1 knock-out mice were examined. By using micro-PET analysis, an extraordinary amount of 18F-FDG uptake was observed in the lmbrd1+/− mice (Fig. 1A). In a steady state, a 2-fold increase in 18F-FDG uptake was observed in the hearts of lmbrd1+/− mice (Fig. 1B). However, lmbrd1+/− mice appeared irresponsive when additional insulin was administered (data not shown), suggesting that the signal that caused the increase in glucose uptake did not originate from extracellular stimuli, but rather resulted from the disturbance of IR signaling because of the knock-out of lmbrd1. To verify this, we employed siRNA knockdown techniques to reduce the expression of the lmbrd1 gene in cardiomyocytes. In addition, because the glucose uptake was elevated and disturbed IR signaling was suspected, the phosphorylation level of the IR was examined. Notably, elevated levels of IR phosphorylation were detected in lmbrd1 knockdown cells (Fig. 1C). This observation was validated in the isolated primary culture lmbrd1 knockdown cells (Fig. 1D), suggesting that the knockdown of lmbrd1 allows the IR to remain in its active form. Increased Akt (a downstream signaling molecule of IR) activation was also detected (Fig. 1D), demonstrating the activation of IR signaling pathways in lmbrd1 knockdown cells. These results suggest that LMBD1 participates in the regulation of IR signaling.
FIGURE 1.
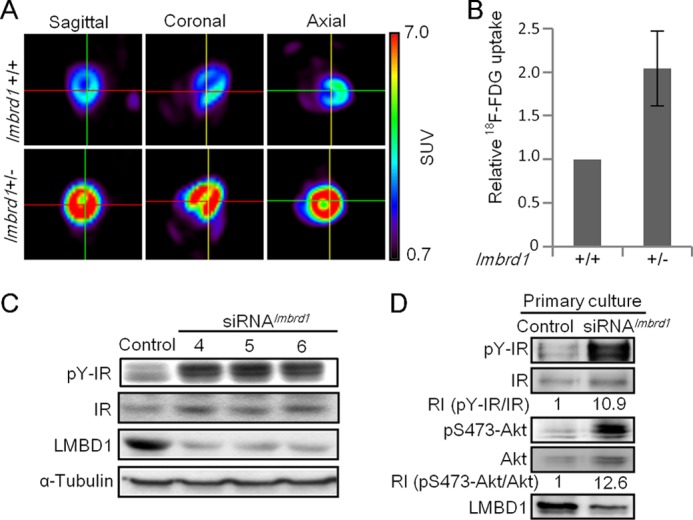
Increased myocardial FDG uptake in lmbrd1+/− mice and activated IR signaling in lmbrd1 knockdown cardiomyocytes. A, representative micro-PET images of 8-week-old male mice taken at 120 min after injection of 18F-FDG. The standardized uptake value (SUV) of FDG is indicated by the color scale ranging from 0.7 to 7.0. Values are normalized to the total amount of the radioisotope injected and the body weight of mice. B, relative FDG uptake in lmbrd1+/+ and lmbrd1+/− mice. Results are shown as the mean percentages ± S.D. (error bar); n = 3/group. C, representative Western blots for the IR and pY-IR expression in HL-1 cells that were transfected using various lmbrd1-specific siRNAs (siRNAlmbrd1). D, representative Western blots for the IR, pY-IR, Akt, and pS473-Akt expression in primary cardiomyocytes transfected using siRNAlmbrd1 no. 6. The relative intensities (RIs) of pY-IR/IR and pS473-Akt/Akt are indicated.
LMBD1 Participates in the IR Internalization Process
LMBD1 was predicted to be a membrane protein that possesses nine transmembrane domains (17). A protein sequence analysis identified two consensus sequences of the AP-2 binding motif and one clathrin box in the nontransmembrane regions of LMBD1 (Fig. 2A). However, only the two AP-2 binding motifs were topologically correct, facing the cytosolic side. The subcellular localizations of LMBD1 were detected in multiple membrane-bound organelles including the lysosome (17) and PM (Fig. 2B). In addition, a surface protein biotinylation assay demonstrated that, in a steady state, ∼3.4% of LMBD1 was localized to the PM, which is nearly the same proportion as the PM-localized surface IR (Fig. 2C).
FIGURE 2.
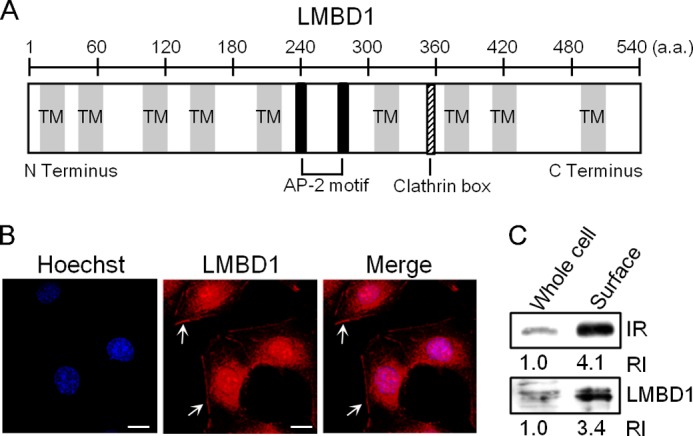
Putative functional motifs and subcellular localization of LMBD1. A, schematic illustration of LMBD1. LMBD1 consists of 540 amino acid residues and possesses nine potential transmembrane (TM) domains, two putative AP-2 binding motifs (black rectangles), and one putative clathrin box (rectangle with slanted lines). B, membrane-associated distribution of LMBD1. Representative confocal images of HL-1 cells co-stained using Hoechst 33258 and the anti-LMBD1 antibody coupled with Alexa Fluor 594-conjugated IgG are shown. Arrows indicate PM of the cells. Scale bars represent 10 μm. C, surface protein biotinylation assay. Biotinylation of total surface proteins was performed as described under “Experimental Procedures.” One milligram of protein lysates from H9C2 cells to which surface proteins had been biotinylated was subjected to NeutrAvidin affinity capture (Surface). A 10-μg protein aliquot from the biotin-labeled cells collected at the step prior to avidin capture was loaded in parallel as controls (Whole cell). The relative intensities (RIs) of the Western blot images are shown.
Because the IR is a receptor tyrosine kinase that autophosphorylates following ligand binding, the phenomenon that the lmbrd1 knockdown cells showed an increased IR phosphorylation level led to the scrutiny of the IR dephosphorylation process and IR-dependent signaling. Following activation, IR signaling occurs through two pathways, the IR metabolic PI3K-Akt signaling pathway and the IR mitogenic Shc-ERK pathway. These two signaling pathways are differentially regulated depending on the localization of the IR; activation of PI3K-Akt occurs at the PM, and ERK signaling is activated after IR internalization (26). Evidently, the inhibition of IR endocytosis leads to the inhibition of Shc-ERK activation, although PI3K-Akt signaling remains activated (7). Moreover, the FRET analysis demonstrated that IR internalization is essential for IR dephosphorylation, a process mediated by PTP1B that occurs at the perinuclear endosomal compartment (5, 6). In the current study, enhanced AKT, but not ERK, phosphorylation was observed in the lmbrd1 knockdown cells (Fig. 1D).3 These results suggest that LMBD1 participates in the IR internalization process; TIRF microscopy confirmed an accumulation of the IR on the PM of lmbrd1 knockdown cells (Fig. 3A). The relative intensities of the TIRF signal to the total IR expression signal showed an average 1.4-fold increase in the surface IR signal of lmbrd1 knockdown cells (Fig. 3B). A flow cytometry analysis also showed an increased level of the surface IR from 45.7% to 67.9% in the cells treated using lmbrd1 shRNA (Fig. 3C), suggesting that lmbrd1 knockdown inhibited IR endocytosis. To clarify whether this was a panoramic effect to all of the receptors on the PM, TrfR, an AP-2 cargo known to be internalized through TTP (14), was used as an experimental control (Fig. 3D). Notably, in both the TIRF microscopy and flow cytometry analyses, no accumulation of TrfR was observed on the PM (Fig. 3, B and D), indicating that LMBD1 plays a unique role in regulating the IR internalization process. The effects of lmbrd1 knockdown on IR internalization were further examined using a surface protein biotinylation assay. Fig. 3, E and F, shows that the ratio of internalized IR to total IR increased in the control cells at 5–25 min after insulin induction. However, the elevated levels of internalized IR were not detected in the lmbrd1 siRNA-treated cells, suggesting disturbed IR endocytosis in the lmbrd1 knockdown cells. These observations agree with the results that showed an accumulation of the IR on the PM of lmbrd1 knockdown cells (Fig. 3, A–C).
FIGURE 3.
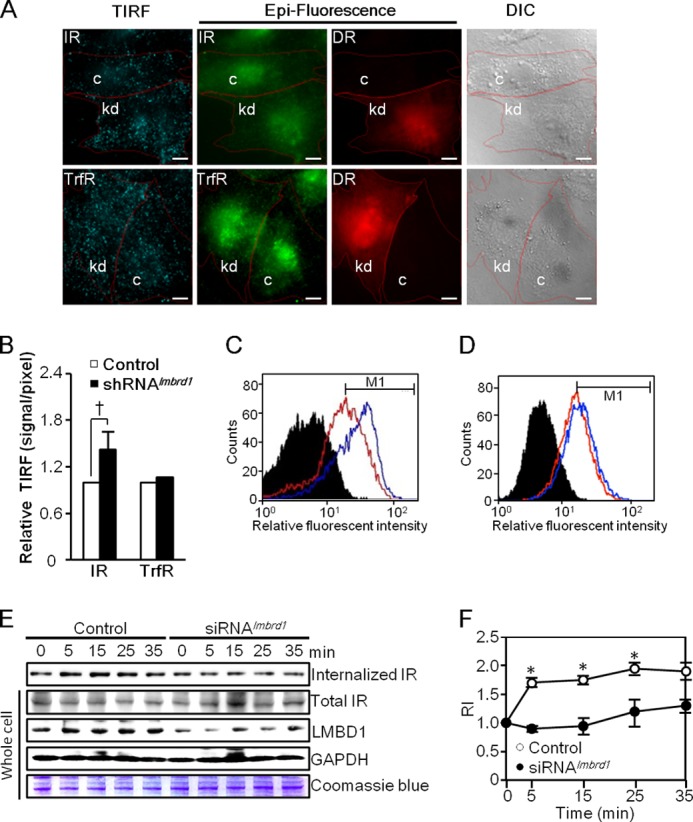
The knockdown of lmbrd1 results in an accumulation of the IR on the PM. A, representative TIRF images of the surface IR and TrfR in lmbrd1 knockdown cells. H9C2 cells were transfected using the pDsRed-shRNAlmbrd1 double promoter construct followed by TIRF analysis as described under “Experimental Procedures.” Cells in which the lmbrd1 gene was knocked down (kd) following the transfection also expressed DsRed, as indicated by the epi-fluorescence DsRed (DR) signal. The IR and TrfR signals observed under TIRF and epi-fluorescence microscope are shown in green. Neighboring cells that did not express DsRed were used as mock control cells (c). Individual cells are outlined in the differential interference contrast (DIC) view. Scale bars represent 10 μm. B, relative intensities of the IR signal on the PM. The total IR and TrfR signals were observed by using the epi-fluorescence channel, and PM signals were observed by using TIRF microscopy. Averages of the relative intensities of PM signals to total signals are shown as the means ± S.D. (error bar); n = 10/group; † represents p = 0.005. C and D, flow cytometry analysis. Flow cytometry analysis of the surface IR signal (C) and the total transferrin uptake (D) in lmbrd1 knockdown H9C2 cells was performed as described under “Experimental Procedures.” Black filled peaks represent control groups. Blue solid lines indicate cells expressing shRNAlmbrd1, and red solid lines indicate cells expressing luciferase control shRNA. E and F, insulin-induced IR endocytosis analyzed by surface protein biotinylation assay. H9C2 cells transfected using lmbrd1-specific siRNA (siRNAlmbrd1 no. 6) were subjected to surface protein biotinylation assay. Internalization of the biotinylated surface IR was monitored following an insulin induction for various time points as described under “Experimental Procedures.” 500 μg of each biotinylated sample collected at various time points was subjected to NeutrAvidin capture and Western blot analysis. A representative Western blot for the internalized IR is shown (E). In addition, 25-μg protein aliquots collected at the step prior to avidin capture (Whole cell) were analyzed in parallel by Western blot analysis and Coomassie Blue staining as controls (E). The plot (F) depicts the relative intensity (RI) of internalized IR to total IR normalized by GAPDH at each time point in control and siRNAlmbrd1 knockdown cells. n = 3, *, p < 0.05.
LMBD1 Participates in the Insulin-induced Clathrin-mediated Endocytosis of the IR
Previous studies have reported that receptors are internalized in a noncompetitive manner (13) and that certain AP-2-clathrin-mediated receptors require specific trafficking proteins for endocytosis (14). To serve as a specific IR trafficking protein, LMBD1 must form a specific complex with the IR. Fig. 4A shows that neither the IR nor TrfR was co-immunoprecipitated with each other, affirming that these receptors endocytose in a noncompetitive manner. By contrast, LMBD1 was co-immunoprecipitated with the IR, but not the TrfR (Fig. 4A). Likewise, in a reverse immunoprecipitation assay, the IR formed a complex with LMBD1 (Fig. 4B), demonstrating specificity, in which LMBD1 selectively participates in a complex formation with the IR, but not the TrfR. Confocal imaging showed that a high percentage of LMBD1 co-localized with the IR (Fig. 4, C and D). By contrast, LMBD1 showed a distinct pattern compared with TrfR, and the co-localization signal was barely observed (Fig. 4, C and D). These results indicate the cargo selectivity of LMBD1.
FIGURE 4.
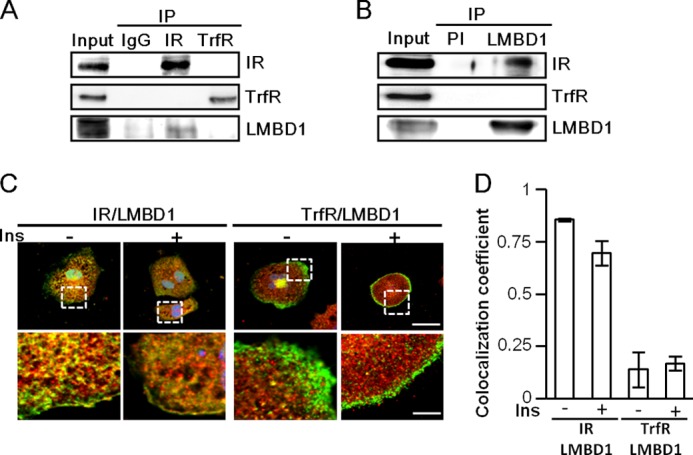
LMBD1 selectively participates in a complex formation with the IR, but not the TrfR. A and B, complex formation between LMBD1 and the IR. HL-1 cell lysates were subjected to immunoprecipitation (IP) and Western blot analysis using preimmune serum (PI) and antibodies as indicated. C, confocal images of HL-1 cells with or without insulin induction. HL-1 cells were co-stained with the IR (Alexa Fluor 488), TrfR (Alexa Fluor 488), and LMBD1 (Alexa Fluor 594) as indicated. The scale bars represent 25 μm in the upper panel and 6 μm in the lower panel. D, co-localization coefficient. The degree of co-localization of LMBD1 with the IR and the TrfR were analyzed by using CoLocalizer Pro software. Bar graph was plotted as mean ± S.D. (error bars); n = 3.
By using TIRF microscopy to monitor live cells, the localization and movement of the LMBD1 in the PM were evident (Fig. 5A). The LMBD1-GFP was endocytosed into the cell, away from the evanescent view of TIRF microscopy after insulin induction. The co-localization and co-movement of the IR-GFP and LMBD1-DsRed were observed (Fig. 5B). As reported previously, the IR is endocytosed with clathrin (7). If LMBD1 participates in the internalization of IR, LMBD1 should also be internalized with clathrin after insulin induction. In the current study, the LMBD1-GFP co-localized and co-internalized with the RFP-CLC after insulin induction (Fig. 5C). By contrast, the LMBD1-GFP neither co-localized nor co-internalized with the Alexa Fluor 594-conjugated transferrin ligand (Fig. 5D). These results strongly suggest that LMBD1 plays a selective role in mediating IR endocytosis.
FIGURE 5.

Live TIRF microscopic images of a single molecule movement after insulin induction. H9C2 cells plated on Deckglaser coverslips were subjected to live cell TIRF imaging as described under “Experimental Procedures” following co-transfection of plasmids that encode proteins as indicated. A, TIRF and epi-fluorescence signals of LMBD1-EGFP (LM-GFP) expressed in H9C2 cells. Relative intensities (RIs) of the averaged TIRF (green) and Epi (red) signals of 10 randomly selected ROIs from insulin-induced cells were plotted. B and C, TIRF images of cells co-expressing IR-GFP and LMBD1-DsR (LM-DR) or LMBD1-GFP (LM-GFP) and RFP-CLC. Scattered plots depict the normalized relative fluorescent intensities of the molecule TIRF to Epi signal with at least 10 randomly selected ROI signals in each group after insulin induction. D, TIRF images of the cells expressing LM-GFP alone. Movements of LM-GFP and transferrin were observed after induction using Alexa Fluor 594-conjugated transferrin (5 μg/ml). Scattered plots depict the normalized relative fluorescent intensities of the molecule TIRF to Epi signal with at least 10 randomly selected ROI signals in each group after insulin induction. Representative ROI images are shown in a series of time-dependent frames. Whole cell images of the frame 1 in each panel are shown on the right with the ROI boxed in white dotted lines. The scale bars represent 5 μm.
LMBD1 Facilitates the Endocytosis of the IR through Its Participation in CCVs
To examine the detailed mechanisms of LMBD1 involvement in IR endocytosis, protein lysates prepared using nuclei-removed HL-1 cells were subjected to continuous gradient centrifugation followed by fractionation and Western blot analysis. The results indicate that LMBD1 existed in CCVs (data not shown). In addition, a sequence analysis of LMBD1 identified two highly conserved AP-2 binding motifs (Fig. 6A), namely, the μ2 subunit binding motif YXXΦ (27, 28) and the α-appendage binding motif WXX(F/W) (29) in the cytosolic loop of LMBD1 between transmembrane domains 5 and 6. An LC-MS/MS analysis revealed clathrin heavy chain (CHC) to be present in the complex of LMBD1 co-immunoprecipitates (data not shown). Further immunoprecipitation and Western blot analysis confirmed that LMBD1 co-immunoprecipitates with both AP-2 and CHC (Fig. 6B).
FIGURE 6.

AP-2 binding motifs are critical for LMBD1 involvement in the clathrin-mediated cardiac IR endocytosis. A, conserved AP-2 μ2 subunit binding motif YXXΦ and α-appendage binding motif WXX(F/W) in LMBD1 among vertebrates. B and C, LMBD1 complexes with CHC and AP-2. Protein lysates prepared from HL-1 cells without (B) or with co-expression of myc-His-tagged exogenous wild-type (Wt) and LMBD1 mutants as indicated (C) were subjected to immunoprecipitation (IP) and Western blot analysis using antibodies that reacted with proteins as indicated. In C, anti-myc antibodies were used to detect the exogenous LMBD1 proteins. D, phenotypic rescue experiment. HL-1 cells were co-transfected using a 1:1 molar ratio of pLKO.1-shRNAlmbrd1 and control plasmid (Vector) or the shRNAlmbrd1-resistant LMBD1 plasmid (LMBD1-shR) of wild-type and AP-2 binding motif mutants (Y233A and W295A) as indicated. Cell lysates were harvested 48 h after transfection for Western blot analysis using specific antibodies to proteins as indicated.
To assess the importance of the two potential AP-2 binding motifs, LMBD1 mutants with mutations at either the AP-2 μ2 subunit binding motif (LMBD1(Y233A)) or the α-appendage binding motif (LMBD1(W295A)) were generated. Both mutants displayed a substantially decreased binding ability to AP-2 (Fig. 6C). To examine whether the disruption of this motif was sufficient to disrupt the IR internalization process, shRNAlmbrd1 knockdown cells were individually introduced with the plasmids expressing the shRNA-resistant wild-type LMBD1 (LMBD1-shR) and mutants, LMBD1-shR(Y233A) and LMBD1-shR(W295A), and the IR phosphorylation status was evaluated (Fig. 6D). The results demonstrated that wild-type LMBD1 effectively reduced the IR phosphorylation status compared with the mutants which were less effective. We conclude that the AP-2 binding motifs are critical for LMBD1 participation in clathrin-mediated endocytosis and that the proper function of LMBD1 is critical for IR internalization.
DISCUSSION
In this study, we demonstrated that the knockdown of lmbrd1 resulted in elevated phosphorylation statuses for both the IR kinase and its downstream signaling protein kinase, Akt. LMBD1 serves as a specific trafficking protein of the IR and participates in clathrin-mediated endocytosis through its interaction with AP-2. LMBD1 deficiency resulted in the retention of the IR on the PM, suggesting that LMBD1 is a critical component in the IR recycling process. The observation of increased myocardial 18F-FDG uptake in lmbrd1 single-allele knock-out mice affirmed this hypothesis because glucose uptake is the downstream effect of IR-Akt activation. Additional studies should elucidate the mechanisms by which LMBD1 specifically interacts with the IR and the stoichiometric ratio required for LMBD1 to participate in the endocytosis process.
Previous studies have demonstrated that in AP-2-depleted cells and in TTP-deficient cells, the clathrin-mediated endocytosis of TrfR was severely hindered (14, 30), suggesting that both components are critical in the TrfR endocytotic process. Numerous studies have proposed that, although receptors such as TrfR and receptor tyrosine kinases enter cells through the CCVs, the endocytosis are differentially regulated in a noncompetitive manner (14, 31). In this study, we demonstrated that the shRNA knockdown of lmbrd1 hindered IR internalization (Fig. 3). In addition, the expression of LMBD1 did not influence transferrin uptake, suggesting the selective role of LMBD1 in IR endocytosis. A co-immunoprecipitation assay and confocal microscopy indicated that the IR existed in a complex different from that of the TrfR (Fig. 4). The cellular isolation of CCVs indicates the existence of LMBD1 in the CCVs (data not shown). Moreover, using confocal microscopy and live TIRF microscopy, we identified the spatiotemporal participation of LMBD1 in CCVs (Fig. 5). Recently, it was demonstrated that a 2:1 stoichiometry of AP-2 to clathrin triskelion was required at the initiation of clathrin coat assembly (8). We hypothesize that LMBD1, possessing the YXXΦ cargo motif, serves as a transmembrane cargo for AP-2. As a cargo that specifically interacts with the IR, LMBD1 plays a role equivalent to that of the previously identified TTP. LMBD1 forms a complex with the IR in the PM, providing sufficient AP-2 recognition motifs YXXΦ and WXX(F/W) at the invagination sites, thereby expediting the AP-2 recruitment process to the peri-PM, facilitating the assembly of CCV and IR internalization. This study elucidated the novel function of the LMBD1 protein in the regulation of IR signaling pathways and glucose homeostasis.
Acknowledgments
We thank J. C. K. Shen, B. C. Chung, Y. T. Yan, R. H. Chen, and J. J. Y. Yen (Academia Sinica, Taipei, Taiwan) and M. J. Su, F. J. Lee, C. L. Chien, S. W. Lin, and Y. P. Li (National Taiwan University, Taipei, Taiwan) for helpful comments on this paper; Professor Joseph Bass (Northwestern University, Illinois) for the plasmid encoding hIR-GFP and Professor Lois E. Greene (National Institutes of Health) for the plasmid encoding RFP-CLC; C. W. Chiao (National Taiwan University, Taipei, Taiwan) for assistance in isolating primary cardiomyocytes; C. T. Tsai and L. P. Lai (National Taiwan University Hospital, Taipei, Taiwan) for cardiomyocyte cell lines; and Y. G. Tsay (National Yang-Ming University, Taipei, Taiwan) for LC-MS/MS analysis. We also are grateful for the technical services provided by the Gene Knock-out Mouse Core Laboratory of National Taiwan University Center for Genomic Medicine and the Imaging Core of the First Core Laboratories on TIRF Microscopy at National Taiwan University College of Medicine.
This work was supported by Research Grants NSC98-2320-B-002-051-MY3 and NSC101-2320-B-002-039 from the National Science Council, Republic of China.
L. T.-L. Tseng, unpublished data.
- IR
- insulin receptor
- AP-2
- adaptor protein-2
- CCV
- clathrin-coated vesicle
- CHC
- clathrin heavy chain
- CLC
- clathrin light chain
- CT
- computed tomography
- 18F-FDG
- 18F-fluorodeoxyglucose
- LMBR1
- limb region 1
- micro-PET
- micro-positron emission tomography
- PM
- plasma membrane
- RFP
- red fluorescent protein
- ROI
- region of interest
- TIRF
- total internal reflection fluorescence
- TrfR
- transferrin receptor
- TTP
- transferrin receptor trafficking protein.
REFERENCES
- 1. Saltiel A. R., Kahn C. R. (2001) Insulin signalling and the regulation of glucose and lipid metabolism. Nature 414, 799–806 [DOI] [PubMed] [Google Scholar]
- 2. Ward C. W., Lawrence M. C., Streltsov V. A., Adams T. E., McKern N. M. (2007) The insulin and EGF receptor structures: new insights into ligand-induced receptor activation. Trends Biochem. Sci. 32, 129–137 [DOI] [PubMed] [Google Scholar]
- 3. Lemmon M. A., Schlessinger J. (2010) Cell signaling by receptor tyrosine kinases. Cell 141, 1117–1134 [DOI] [PMC free article] [PubMed] [Google Scholar]
- 4. Frangioni J. V., Beahm P. H., Shifrin V., Jost C. A., Neel B. G. (1992) The nontransmembrane tyrosine phosphatase PTP-1B localizes to the endoplasmic reticulum via its 35 amino acid C-terminal sequence. Cell 68, 545–560 [DOI] [PubMed] [Google Scholar]
- 5. Eden E. R., White I. J., Tsapara A., Futter C. E. (2010) Membrane contacts between endosomes and ER provide sites for PTP1B-epidermal growth factor receptor interaction. Nat. Cell Biol. 12, 267–272 [DOI] [PubMed] [Google Scholar]
- 6. Haj F. G., Verveer P. J., Squire A., Neel B. G., Bastiaens P. I. (2002) Imaging sites of receptor dephosphorylation by PTP1B on the surface of the endoplasmic reticulum. Science 295, 1708–1711 [DOI] [PubMed] [Google Scholar]
- 7. Ceresa B. P., Kao A. W., Santeler S. R., Pessin J. E. (1998) Inhibition of clathrin-mediated endocytosis selectively attenuates specific insulin receptor signal transduction pathways. Mol. Cell. Biol. 18, 3862–3870 [DOI] [PMC free article] [PubMed] [Google Scholar]
- 8. Cocucci E., Aguet F., Boulant S., Kirchhausen T. (2012) The first five seconds in the life of a clathrin-coated pit. Cell 150, 495–507 [DOI] [PMC free article] [PubMed] [Google Scholar]
- 9. Henne W. M., Boucrot E., Meinecke M., Evergren E., Vallis Y., Mittal R., McMahon H. T. (2010) FCHo proteins are nucleators of clathrin-mediated endocytosis. Science 328, 1281–1284 [DOI] [PMC free article] [PubMed] [Google Scholar]
- 10. Kelly B. T., McCoy A. J., Späte K., Miller S. E., Evans P. R., Höning S., Owen D. J. (2008) A structural explanation for the binding of endocytic dileucine motifs by the AP2 complex. Nature 456, 976–979 [DOI] [PMC free article] [PubMed] [Google Scholar]
- 11. Jackson L. P., Kelly B. T., McCoy A. J., Gaffry T., James L. C., Collins B. M., Höning S., Evans P. R., Owen D. J. (2010) A large-scale conformational change couples membrane recruitment to cargo binding in the AP2 clathrin adaptor complex. Cell 141, 1220–1229 [DOI] [PMC free article] [PubMed] [Google Scholar]
- 12. Kukulski W., Schorb M., Kaksonen M., Briggs J. A. (2012) Plasma membrane reshaping during endocytosis is revealed by time-resolved electron tomography. Cell 150, 508–520 [DOI] [PubMed] [Google Scholar]
- 13. Traub L. M. (2009) Tickets to ride: selecting cargo for clathrin-regulated internalization. Nat. Rev. Mol. Cell Biol. 10, 583–596 [DOI] [PubMed] [Google Scholar]
- 14. Tosoni D., Puri C., Confalonieri S., Salcini A. E., De Camilli P., Tacchetti C., Di Fiore P. P. (2005) TTP specifically regulates the internalization of the transferrin receptor. Cell 123, 875–888 [DOI] [PubMed] [Google Scholar]
- 15. Backer J. M., Shoelson S. E., Haring E., White M. F. (1991) Insulin receptors internalize by a rapid, saturable pathway requiring receptor autophosphorylation and an intact juxtamembrane region. J. Cell Biol. 115, 1535–1545 [DOI] [PMC free article] [PubMed] [Google Scholar]
- 16. Wang Y. H., Chang S. C., Huang C., Li Y. P., Lee C. H., Chang M. F. (2005) Novel nuclear export signal-interacting protein, NESI, critical for the assembly of hepatitis δ virus. J. Virol. 79, 8113–8120 [DOI] [PMC free article] [PubMed] [Google Scholar]
- 17. Rutsch F., Gailus S., Miousse I. R., Suormala T., Sagné C., Toliat M. R., Nürnberg G., Wittkampf T., Buers I., Sharifi A., Stucki M., Becker C., Baumgartner M., Robenek H., Marquardt T., Höhne W., Gasnier B., Rosenblatt D. S., Fowler B., Nürnberg P. (2009) Identification of a putative lysosomal cobalamin exporter altered in the cblF defect of vitamin B12 metabolism. Nat. Genet. 41, 234–239 [DOI] [PubMed] [Google Scholar]
- 18. Hsu W. C., Tzen K. Y., Huy P. T., Duet M., Yeh T. H. (2009) An animal model of central auditory pathway imaging in the rat brain by high resolution small animal positron emission tomography. Acta Otolaryngol. 129, 423–428 [DOI] [PubMed] [Google Scholar]
- 19. Schäfers K. P., Stegger L., Barnard C., Kriens M., Hermann S., Schober O., Schäfers M. (2005) ECG-triggered high-resolution positron emission tomography: a breakthrough in cardiac molecular imaging of mice. Eur. J. Nucl. Med. Mol. Imaging 32, 383. [DOI] [PubMed] [Google Scholar]
- 20. Claycomb W. C., Lanson N. A., Jr., Stallworth B. S., Egeland D. B., Delcarpio J. B., Bahinski A., Izzo N. J., Jr. (1998) HL-1 cells: a cardiac muscle cell line that contracts and retains phenotypic characteristics of the adult cardiomyocyte. Proc. Natl. Acad. Sci. U.S.A. 95, 2979–2984 [DOI] [PMC free article] [PubMed] [Google Scholar]
- 21. Fang K. M., Lee A. S., Su M. J., Lin C. L., Chien C. L., Wu M. L. (2008) Free fatty acids act as endogenous ionophores, resulting in Na+ and Ca2+ influx and myocyte apoptosis. Cardiovasc. Res. 78, 533–545 [DOI] [PubMed] [Google Scholar]
- 22. Su M. J., Chang G. J., Wu M. H., Kuo S. C. (1997) Electrophysiological basis for the antiarrhythmic action and positive inotropy of HA-7, a furoquinoline alkaloid derivative, in rat heart. Br. J. Pharmacol. 122, 1285–1298 [DOI] [PMC free article] [PubMed] [Google Scholar]
- 23. Bairstow S. F., Ling K., Su X., Firestone A. J., Carbonara C., Anderson R. A. (2006) Type Iγ661 phosphatidylinositol phosphate kinase directly interacts with AP2 and regulates endocytosis. J. Biol. Chem. 281, 20632–20642 [DOI] [PubMed] [Google Scholar]
- 24. Lin J. W., Ju W., Foster K., Lee S. H., Ahmadian G., Wyszynski M., Wang Y. T., Sheng M. (2000) Distinct molecular mechanisms and divergent endocytotic pathways of AMPA receptor internalization. Nat. Neurosci. 3, 1282–1290 [DOI] [PubMed] [Google Scholar]
- 25. Woods A. J., Roberts M. S., Choudhary J., Barry S. T., Mazaki Y., Sabe H., Morley S. J., Critchley D. R., Norman J. C. (2002) Paxillin associates with poly(A)-binding protein 1 at the dense endoplasmic reticulum and the leading edge of migrating cells. J. Biol. Chem. 277, 6428–6437 [DOI] [PubMed] [Google Scholar]
- 26. Murphy J. E., Padilla B. E., Hasdemir B., Cottrell G. S., Bunnett N. W. (2009) Endosomes: a legitimate platform for the signaling train. Proc. Natl. Acad. Sci. U.S.A. 106, 17615–17622 [DOI] [PMC free article] [PubMed] [Google Scholar]
- 27. Owen D. J., Evans P. R. (1998) A structural explanation for the recognition of tyrosine-based endocytotic signals. Science 282, 1327–1332 [DOI] [PMC free article] [PubMed] [Google Scholar]
- 28. Ohno H., Stewart J., Fournier M. C., Bosshart H., Rhee I., Miyatake S., Saito T., Gallusser A., Kirchhausen T., Bonifacino J. S. (1995) Interaction of tyrosine-based sorting signals with clathrin-associated proteins. Science 269, 1872–1875 [DOI] [PubMed] [Google Scholar]
- 29. Ritter B., Denisov A. Y., Philie J., Deprez C., Tung E. C., Gehring K., McPherson P. S. (2004) Two WXXF-based motifs in NECAPs define the specificity of accessory protein binding to AP-1 and AP-2. EMBO J. 23, 3701–3710 [DOI] [PMC free article] [PubMed] [Google Scholar]
- 30. Motley A., Bright N. A., Seaman M. N., Robinson M. S. (2003) Clathrin-mediated endocytosis in AP-2-depleted cells. J. Cell Biol. 162, 909–918 [DOI] [PMC free article] [PubMed] [Google Scholar]
- 31. Warren R. A., Green F. A., Enns C. A. (1997) Saturation of the endocytic pathway for the transferrin receptor does not affect the endocytosis of the epidermal growth factor receptor. J. Biol. Chem. 272, 2116–2121 [DOI] [PubMed] [Google Scholar]