

Background: The expression of PAC1, a specific receptor for PACAP, is decreased in brain ischemia.
Results: PAC1 expression was attenuated by inactivation of Sp1 through cross-linking by transglutaminase 2 (TG2) activated by ER stress.
Conclusion: TG2 is involved in negative regulation of PAC1 gene expression.
Significance: Suppression of PAC1 by TG2 might be involved in neuronal damage from brain ischemia.
Keywords: ER Stress, G Protein-coupled Receptors (GPCRs), Gene Expression, Ischemia, Neurons, Neuropeptide, Sp1, PAC1, Pituitary Adenylate Cyclase-activating Polypeptide, Transglutaminase 2
Abstract
Pituitary adenylate cyclase-activating polypeptide (PACAP) functions as a neuroprotective factor through the PACAP type 1 receptor, PAC1. In a previous work, we demonstrated that nerve growth factor augmented PAC1 gene expression through the activation of Sp1 via the Ras/MAPK pathway. We also observed that PAC1 expression in Neuro2a cells was transiently suppressed during in vitro ischemic conditions, oxygen-glucose deprivation (OGD). Because endoplasmic reticulum (ER) stress is induced by ischemia, we attempted to clarify how ER stress affects the expression of PAC1. Tunicamycin, which induces ER stress, significantly suppressed PAC1 gene expression, and salubrinal, a selective inhibitor of the protein kinase RNA-like endoplasmic reticulum kinase signaling pathway of ER stress, blocked the suppression. In luciferase reporter assay, we found that two Sp1 sites were involved in suppression of PAC1 gene expression due to tunicamycin or OGD. Immunocytochemical staining demonstrated that OGD-induced transglutaminase 2 (TG2) expression was suppressed by salubrinal or cystamine, a TG activity inhibitor. Further, the OGD-induced accumulation of cross-linked Sp1 in nuclei was suppressed by cystamine or salubrinal. Together with cystamine, R283, TG2-specific inhibitor, and siRNA specific for TG2 also ameliorated OGD-induced attenuation of PAC1 gene expression. These results suggest that Sp1 cross-linking might be crucial in negative regulation of PAC1 gene expression due to TG2 in OGD-induced ER stress.
Introduction
PAC12 belongs to the glucagon/secretin family of G protein-coupled receptors. Pituitary adenylate cyclase-activating polypeptide (PACAP) is the high affinity ligand for PAC1. Through PAC1, PACAP plays a crucial role in the central nervous system (CNS) as a neurotrophic factor, neurotransmitter, or neuromodulator (1). PACAP increases the survival of cultured neuronal cells under ischemia-like conditions and has neuroprotective effects in in vivo animal models of focal and transient global ischemia (2, 3). It has been reported that after global ischemia, PAC1 mRNA was decreased throughout the hippocampus in rat, whereas PACAP expression was selectively increased in the granule cell layer (4). The expression of PAC1 has also been shown to decrease after transient focal cerebral ischemia in mice (1). So far, little information has emerged on the reduction of PAC1 expression in ischemia, and moreover, the mechanism of this suppression remains unclear.
We recently reported that nerve growth factor (NGF) augmented PAC1 gene expression through the activation of transcription factor Sp1 via the Ras/MAPK pathway in PC12 cells (5). Moreover, it was reported that the administration of Sp1 inhibitor mithramycin A after middle cerebral artery occlusion significantly increased infarct volume in rat (6). Because Sp1 is activated during oxidative stress (7, 8) and hypoxia (9, 10), Sp1 is highly responsive to neuroprotective signals (6).
Endoplasmic reticulum (ER) stress has been reported to contribute to the extent of cerebral infarct volume in ischemic injury (11). ER stress includes a signaling pathway called the unfolded protein response, which is a cellular stress response induced by the accumulation of unfolded proteins in the lumen of the ER. Protein kinase RNA-like endoplasmic reticulum kinase (PERK) receptor response occurs within minutes to hours of unfolded protein response activation to prevent further translational loading of the ER. PERK activates itself by oligomerization and autophosphorylation of the free luminal domain. Although the unfolded protein response is primarily an adaptive response, if the stress persists, the ER stress receptors can also trigger pro-apoptotic pathways to initiate cell death (12). Because many proteins synthesized through the ER are glycosylated, tunicamycin (TM), a protein glycosylation inhibitor, induces unfolded protein accumulation in the ER and, ultimately, cell death. Thus, TM is generally used as an inducer in ER stress. Previously, we reported that PACAP protects PC12 cells against TM-induced cell death (13). TM-induced cell death was inhibited by the salubrinal, a selective inhibitor of cellular complexes that dephosphorylates eukaryotic translation initiation factor 2 subunit α (eIF2α) downstream of PERK pathways (14). Moreover, salubrinal significantly increased the phosphorylation of eIF2α, leading to reduced ER stress-induced brain damage after ischemia/reperfusion injury (15).
It has been reported recently that ER stress or ischemia is associated with transglutaminase 2 (TG2; EC 2.3.2.13); that is, TG2 increased in the hippocampus after ischemia (16–18). TG2 is ubiquitously expressed, and one of its functions is Ca2+-dependent cross-linking of the ϵ-amino group of a lysine residue to the γ-carboxamide group of a glutamine residue (19). TG2 has therefore been implicated in the regulation of cell growth, differentiation, metastasis, and apoptosis. In terms of apoptosis, it was reported that treatment of SH-SY5Y cells with ER stress inducer thapsigargin or TM enhanced the formation of TG2-immunoreactive granules and cell death (20). In addition, alcohol-induced accumulation of TG2 in the nuclei via ER stress induced cross-linking Sp1 and apoptosis in the liver (21, 22), which were inhibited by salubrinal (23). However, it was reported that cystamine, a TG activity inhibitor, exhibits protective effects in brain ischemia and reduces the expression of TG2 in Neuro2a cells (24).
The purpose of this article is to describe basic data that can be useful to an understanding of the mechanisms of the down-regulation of PAC1 expression in brain ischemia. We also aimed to clarify a possible mechanism of the down-regulation of PAC1 gene expression via nuclear TG2 in oxygen-glucose deprivation (OGD)-induced ER stress.
EXPERIMENTAL PROCEDURES
Materials
Tunicamycin and cystamine were obtained from Sigma-Aldrich, and salubrinal was from Santa Cruz Biotechnology. Antibodies against GRP78/Bip, CHOP/GADD153, and β-actin were obtained from Santa Cruz Biotechnology; TG2 was from Thermo Scientific; tubulin, fibrillarin, and cleaved caspase-3 were from Cell Signaling Technology; and PAC1 (93093-4) was donated by Dr. Arimura. A polyclonal antibody against cross-linked Sp1 (CLSp1) was prepared as described previously (21). The CLSp1 antibody is designed to recognize the polymerized Sp1 (>450 kDa), but not monomer one. 5-(Biotinamido) pentylamine (5-BAPA), a biotinylated primary amine substrate for TG2, was obtained from Pierce. TG2-specific inhibitor R283 (targeting intracellular TG2) was prepared as described previously (25, 26).
Cell Culture
Neuro2a mouse neuroblastoma cells were maintained in Dulbecco's modified Eagle's medium (DMEM; Sigma) supplemented with 10% fetal bovine serum (FBS). After a 16-h preincubation in DMEM without FBS, the cells were exposed to tunicamycin, salubrinal, cystamine, or R283 for 24 h. Cultures of mouse primary cortical neurons were performed as described previously (27). Briefly, the cortices of embryonic day 15-16 mice were treated with trypsin, and cells were plated on culture dishes at the density of 3 × 10⁴ cells/cm2. Cells were cultured for 2 h in DMEM supplemented with 10% FBS and then in Neurobasal medium supplemented with 2% B27 supplement (Invitrogen) for up to 21 days in vitro. The cells were maintained in a humidified 37 °C incubator with 5% CO2.
RNA Isolation and RT-PCR
Total RNA was extracted from cells using RNAiso Plus (Takara Bio) according to the manufacturer's protocol. After reverse transcription using a High Capacity cDNA Reverse Transcription Kit (Applied Biosystems), the resulting cDNA was subjected to PCR using TaKaRa Ex Taq Hot Start Version (Takara Bio) according to the manufacturer's protocol. PCR conditions were as follows: 30–35 cycles of denaturation at 94 °C for 1 min, annealing at 56 °C for 1 min, and extension at 72 °C for 120 s. The primer sequences were as follows: mouse PAC1, 5′-GTGGTGTCCAACTACTTCTG-3′ (forward) and 5′-TGGAGAGAAGGCGAATAC-3′ (reverse); mouse Sp1 5′-TCGCTTGCCTCGTCAGCGTC-3′ (forward) and 5′-GCCCACCAGAGACTGTGCGG-3′ (reverse); mouse GAPDH, 5′-ACCACAGTCCATGCCATCAC-3′ (forward) and 5′-TCCACCACCCTGTTGCTGTA-3′ (reverse). GAPDH amplification was performed to normalize the results from different samples.
Western Blotting
Western blotting was performed as described previously (5). Briefly, nuclear and cytosolic proteins were extracted from whole cells with NE-PER Nuclear and Cytoplasmic Extraction Reagents (Thermo Scientific) according to the manufacturer's protocol. Each 30 μg of protein was loaded on a 12% polyacrylamide gel for electrophoresis at a constant current of 100 mA/plate for 2 h at room temperature and blotted to a polyvinylidene fluoride membrane previously treated with 100% methanol. After blocking with 5% skimmed milk dissolved in 20 mm Tris-HCl buffer (pH 7.5) containing 137 mm NaCl and 0.05% Tween 20, the membrane was incubated with one of the following primary antibodies: PAC1 (1:5000), Sp1 (1:200), GRP78/Bip (1:1000), CHOP/GADD153 (1:200), TG2 (1:250), cleaved caspase-3 (1:1000), tubulin (1:400), fibrillarin (1:400), or β-actin (1:1000).
OGD Conditions
Neuro2a cells or mouse cortical neurons were washed with phosphate-buffered saline (PBS) once and incubated in DMEM without glucose (11966-025; Invitrogen) after N2 bubbling for 30 min. The Neuro2a cells or mouse cortical neurons were then incubated in a hypoxia chamber (rectangular jar, 2.5 liters) with an Anaero pack (Mitsubishi Gas Company) to maintain oxygen concentration at <0.1% for 6 h or 1 h, respectively.
Preparation of Vector Constructs for Luciferase Reporter Assays
From the cloned 5′-upstream region of the human PAC1 gene (ADCYAP1R1) (Ensembl Genome Browser: Chromosome7: 31058650–31113403), the fragments were subcloned and inserted into the pGL3 (Promega) as described previously (5). The resulting reporter vectors for PAC1 promoter activity are designated as hP1L-1, -2, and -3, which contain −372 to +268, −252 to +268, and +23 to +268 of 5′-flanking region of the PAC1 gene, respectively. The mutated forms at two Sp1 sites of hP1L-1 were also prepared using the appropriate synthesized primers with the KOD-Plus-Mutagenesis Kit (Toyobo), as described previously (5). The resulting reporter vectors with mutation of Sp1 elements in −314/−305 and −282/−273 were designated as mut1 and mut2, respectively. The Sp1 element of mut1 (5′-ACCGCGCCCC-3′) and that of mut2 (5′-ACCCCGCCCC-3′) were changed into 5′-ACgaattCCC-3′ and 5′-ACgtcgaCCC-3′, both of which contain a five-point mutation (indicated by lowercase letters) by introducing an EcoRI site and a HincII site, respectively. The Sp1-pGL3 promoter vector, which contains three sequential repeats of consensus GC boxes motifs derived from the c-met promoter in the upstream of the luciferase complementary DNA, was generated by inserting a synthesized oligodeoxynucleotide cassette onto the pGL3 vector as described previously (21). All DNAs were prepared using a NucleoBond Xtra Midi EF kit (Macherey-nagel) according to the manufacturer's protocol.
Dual Luciferase Reporter Assay
A dual luciferase reporter assay was performed as described previously (5). Briefly, Neuro2a cells were seeded onto 48-well plates at 1 × 10⁵ cells/well. The cells were co-transfected with mutated vector of hP1L-1, -2, -3, mut1, mut2, or Sp1 with phRL-TK vector using FuGENE 6 (Roche Applied Science) according to the manufacturer's protocol. After the treatment with TM for 24 h, the cells were rinsed with a passive lysis buffer (Promega) for 15 min at room temperature. Luciferase activity was quantified in a Centro LB960 (Berthold Technologies) using the Dual Luciferase Reporter Assay system (Promega). Cystamine, TG activity inhibitor, and salubrinal eIF2α dephosphorylation inhibitor were added to the medium 15 min before TM treatment. The relative luciferase activity of the pGL3 promoter was assigned a value of 100.
Immunocytochemistry
Neuro2a or mouse cortical neurons were plated on a coverslip (Matsunami Glass) coated with poly-l-lysine. The cells were fixed for 20 min with 4% paraformaldehyde in PBS, washed with PBS, and incubated in PBS containing 5% bovine serum albumin and 0.3% Triton X-100 for 60 min. Cells were then incubated with antibodies TG2 (1:250) or CLSp1 (2.5 μg/ml) followed by anti-rabbit secondary antibody conjugated with Alexa Fluor 488 (Invitrogen). Samples were mounted on coverslips with Dako mounting medium (Dako Cytomation) containing 0.5 μg/ml Hoechst 33342 (Dojindo Laboratories). Fluorescent images were obtained using an LSM700 confocal laser scanning microscope (Carl Zeiss) and CellomicsTM Arrayscan V system (Thermo Scientific).
TG2 Activity
In situ TG2 activity was assessed as described previously (21, 22). Briefly, in situ TG2 activity was detected by incorporation of 5-BAPA into Neuro2a cells. Cells were incubated with 0.2 mm 5-BAPA and 100 μm aminoguanidine for 18 h. After washing with culture medium, cells were fixed, permeabilized, and stained with tetramethylrhodamine isothiocyanate-conjugate streptavidin (1:500).
Short Interfering RNA (siRNA) Transfection
siRNA specific for TG2 was synthesized by Invitrogen and transfected into Neuro2a cells with Lipofectamine RNAiMAX (Invitrogen) according to the manufacturer's instructions. Briefly, cells were seeded at a density of 0.5 × 10⁵ cells/cm2 and cultured overnight, after which RNAi/Lipofectamine complexes in Opti-MEM (Invitrogen) were added. After 48 h of incubation, the cells were subjected to OGD as described above. The sequence of TG2 siRNA oligonucleotides is 5′-GAGCGAGATGATCTGGAAC-3′.
Statistical Analysis
The data are expressed as means ± S.E. Using Prism 5 software (Graph Pad), analyses were performed using Tukey's test after analysis of variance or Student's t tests. All experiments were repeated at least three times, and representative results are included in the figures.
RESULTS
OGD or ER Stress Attenuated PAC1 Expression
Because it was previously reported that PAC1 expression was significantly decreased after experimental ischemic insult in vivo (4), we assessed the effect of OGD, a model of ischemic insult in vitro, on PAC1 expression in Neuro2a. The OGD condition decreased PAC1 mRNA and protein expression levels (Fig. 1, A and B). Pretreatment with salubrinal ameliorated the suppression of PAC1 mRNA expression levels (Fig. 1C) and that of its protein levels (Fig. 1D). As well as OGD, we also found that TM treatment for 24 h decreased the expression of PAC1 protein levels and that salubrinal reversed the suppression of PAC1 mRNA (Fig. 1E) and that of its protein levels (Fig. 1F). The expression of ER stress markers CHOP and GRP78 as well as an apoptosis marker, cleaved caspase-3, was increased following OGD, and pretreatment with salubrinal attenuated these expressions (Fig. 1G), indicating that ER stress is involved in OGD in Neuro2a cells. Thus, PAC1 was decreased in OGD-induced ER stress, and pretreatment with salubrinal ameliorated its suppression of PAC1 expression.
FIGURE 1.

Effect of OGD or TM treatment on PAC1 expression with or without salubrinal. Neuro2a cells were treated with OGD for 6 h or with TM for 24 h. A and B, mRNA (A) and protein (B) expression of PAC1 after OGD were determined by RT-PCR and Western blotting, respectively. C and D, mRNA (C) and protein (D) expression of PAC1 after OGD with presence or absence of salubrinal (Sal, 50 μm) were determined. E and F, mRNA (E) and protein (F) expression of PAC1 after TM (0.5 μg/ml) treatment with presence or absence of salubrinal were also determined. G, after OGD with presence or absence of salubrinal, the protein expression of GRP78, CHOP, cleaved caspase-3, and β-actin in the cytosolic extracts was determined by Western blotting using the specific antibodies. Values are presented as means ± S.E. (error bars). *, p < 0.05; **, p < 0.01; and ***, p < 0.001. Representative results from three independent experiments are shown.
Attenuation of Promoter Activity of PAC1 Gene by Tunicamycin Treatment
Using the dual luciferase reporter assay, we evaluated the influence of ER stress on the promoter activity. Among sequential deletion mutants of the 5′-flanking region, the promoter activity of hP1L-1 was attenuated in TM-treated Neuro2a cells (Fig. 2A). The treatment with salubrinal significantly reversed the suppression of the promoter activity (Fig. 2B). The promoter activity of hP1L-1 was also attenuated in OGD-treated Neuro2a cells (data not shown). Because two Sp1 elements were found between −372 and −252 and ethanol-induced ER stress was reported to suppress Sp1 promoter activity in HepG2 cells, we examined the promoter activity of three tandem functional GC boxes reporter derived from c-met gene as described previously (21). As a result, the promoter activity was also significantly decreased by TM treatment, and salubrinal reversed its suppression in Neuro2a cells (Fig. 2C). Then a point mutation was introduced at either of two Sp1 elements (−314/−305 bp and −282/−273 bp), designated as mut1 and mut2, respectively. As well as TM treatment, promoter activities of mut1 and mut2 were decreased by insertion of mutation (Fig. 2D). Their promoter activities were not changed by treatment of TM. These results suggest that both of putative Sp1-binding elements could be necessary for ER stress-mediated suppression of PAC1 promoter activity.
FIGURE 2.

Involvement of Sp1 in suppressive effect of TM on promoter activity of PAC1 gene. A, luciferase activity of three reporter constructs of the 5′-flanking region of human PAC1 gene in Neuro2a cells is shown. B, after transfection of the reporter vector hP1L-1, Neuro2a cells were treated with TM (0.5 μg/ml) in the absence or presence of salubrinal (Sal, 50 μm). C, the cells were transfected with Sp1 promoter vector and then treated with TM for 24 h in the absence or presence of salubrinal. D, schematic represents the mutated reporter constructs on each Sp1 site, which are designated as mut1 (mutation of Sp1 site in −314/−305 bp) and mut2 (mutation of Sp1 site in −282/−273 bp). Luciferase activities of hP1L-1, mut1, and mut2 were assessed in the TM-treated or nontreated cells. Values are presented as means ± S.E. (error bars). *, p < 0.05; **, p < 0.01; and ***, p < 0.001 compared with untreated cells; n.s., not significant. Representative results from three independent experiments are shown.
Nuclear Cross-linked Sp1 Was Induced by OGD
After 6 h of OGD condition or 24 h of TM treatment, expression levels of Sp1 protein were significantly decreased in Neuro2a cells (Fig. 3, A and C). Sp1 mRNA levels, however, were not altered (Fig. 3, B and D). Based on our previous finding that Sp1 is inactivated by cross-linking in liver injury-induced ER stress (21, 22), we examined whether or not CLSp1 is formed in neurons by OGD-induced ER stress. Then in the OGD condition, immunocytochemical staining with CLSp1-specific antibody demonstrated induction of CLSp1 in nuclei of Neuro2a cells (Fig. 3E).
FIGURE 3.
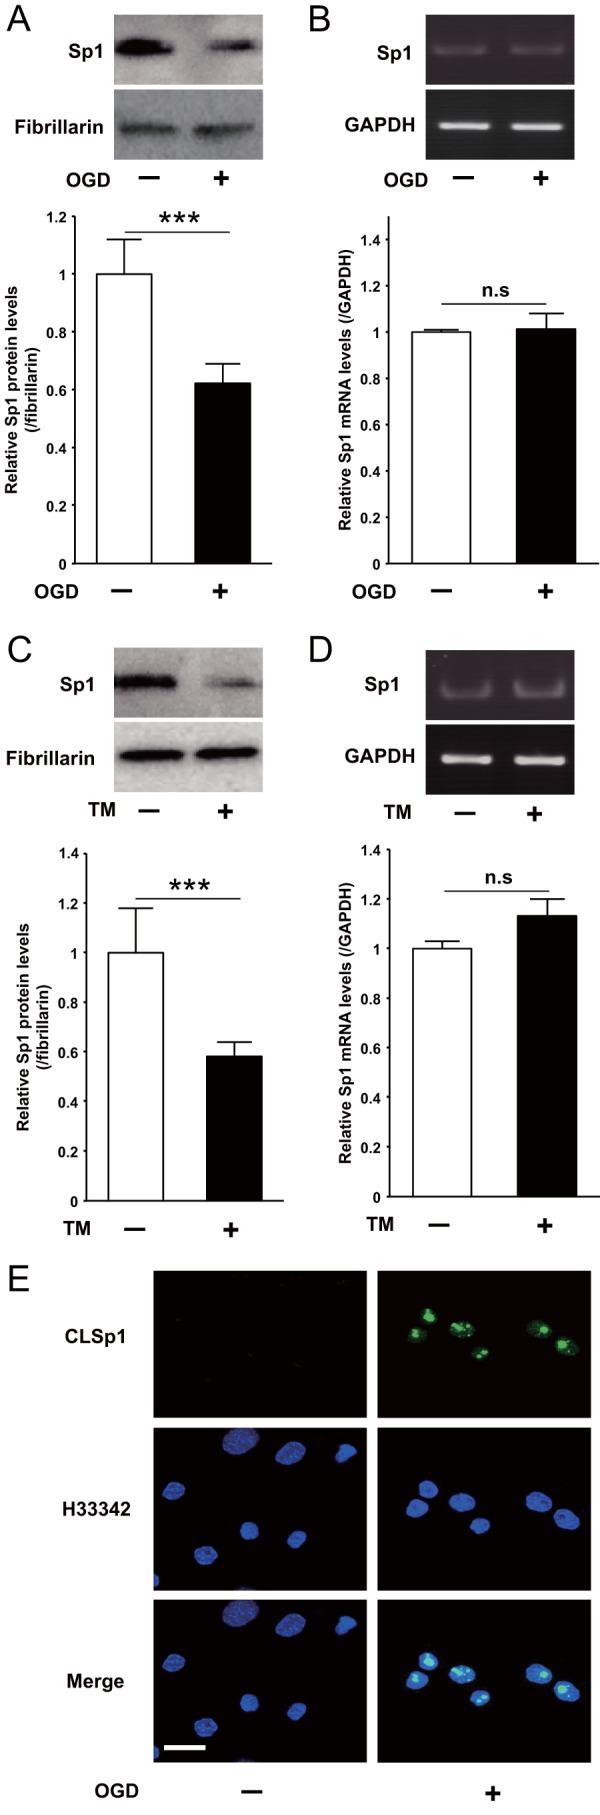
Effect of OGD or TM on Sp1 expression in Neuro2a cells. A and B, after treatment with OGD for 6 h, Neuro2a cells were harvested, and nuclear protein expression (A) and mRNA levels of Sp1 (B) were determined by Western blotting and RT-PCR, respectively. C and D, after treatment with TM for 24 h, the nuclear protein expression (C) and the mRNA levels of Sp1 (D) were also determined in the same way. E, Neuro2a cells treated with OGD for 6 h were fixed and stained with anti-CLSp1 antibody (top row) or Hoechst 33342 (middle row). The two images were merged, and the final image is shown in the bottom row (Merge). ***, p < 0.001 compared with untreated cells; n.s., not significant. Scale bar (E), 20 μm. Representative results from three independent experiments are shown. Error bars, S.E.
Accumulation of Nuclear Transglutaminase 2 Was Blocked by Salubrinal or Cystamine
We investigated the molecular mechanisms underlying the induction of CLSp1 in Neuro2a cells after OGD. Western blotting analysis demonstrated that OGD increased cytosolic and nuclear TG2 in Neuro2a cells, and salubrinal significantly inhibited these increments (Fig. 4A). Immunostaining results also confirmed that OGD-induced nuclear expression and activity of TG2 were suppressed by salubrinal (Fig. 4B). It is interesting that cystamine, an inhibitor of transglutaminase activity, significantly inhibited TG2 accumulation in cytosol and nucleus of Neuro2a cells induced by OGD (Fig. 4C). Further, as well as salubrinal, OGD-induced nuclear TG2 expression and activity were ameliorated by cystamine (Fig. 4D). Immunocytochemical staining demonstrated that the OGD induced accumulation of CLSp1 in Neuro2a nuclei (Fig. 4E, lane 2), which was suppressed by cystamine (Fig. 4E, lane 3). The increments of GRP78, CHOP, and cleaved caspase-3 by OGD were significantly attenuated by pretreatment with cystamine (Fig. 4F).
FIGURE 4.

OGD augmented TG2 protein expression in both cytosol and nucleus of Neuro2a cells. A, after treatment of Neuro2a cells with OGD in the absence or presence of salubrinal (Sal, 50 μm), the protein levels of TG2, β-tubulin (cytosolic loading control), and fibrillarin (nuclear loading control) in cytosolic and nuclear fractions were determined using Western blotting. B, triple staining of TG2 immunoreactivity (top row), TG2 activity (second row), and Hoechst 33342 (third row) after OGD with presence or absence of salubrinal was performed. The results of merging the three images are shown in the bottom row (Merge). C, after treatment with OGD in the absence or presence of cystamine (Cys, 500 μm), Western blotting was conducted in the same way. D, triple staining of TG2 immunoreactivity (top row), TG2 activity (second row), and Hoechst 33342 (third row) was performed in the OGD-treated cells with or without cystamine. The results of merging the three images are shown in the bottom row (Merge). E, double staining of CLSp1 immunoreactivity (top row) and Hoechst 33342 (middle row) was performed in the OGD-treated cells with or without cystamine. The results of merging the two images are shown in the bottom row (Merge). F, after OGD treatment with or without cystamine, protein levels of GRP78, CHOP, cleaved caspase-3 (Casp-3), and β-actin in cytosolic extracts were determined using Western blotting. Values are presented as means ± S.E. (error bars). *, p < 0.05; **, p < 0.01; and ***, p < 0.001. Scale bars (B, E, and D), 20 μm. Representative results from three independent experiments are shown.
The Suppression of PAC1 Gene Expression by OGD-induced ER Stress Was Canceled by TG Activity Inhibitor or TG2-specific Inhibitor
We attempted to evaluate whether or not TG2 is implicated in TM-induced suppression of PAC1 protein expression. Pretreatment with cystamine significantly ameliorated OGD-induced or TM-induced suppression of PAC1 (Fig. 5, A and B). Furthermore, as well as cystamine, TG2-specific inhibitor R283 also canceled the suppression of PAC1 protein expression due to OGD or TM treatment (Fig. 5, C and D).
FIGURE 5.

The suppression of PAC1 expression was canceled by transglutaminase activity inhibitor, cystamine, or TG2-specific inhibitor R283 in Neuro2a cells. A and B, the protein expression of PAC1 after OGD or TM treatment with the presence or absence of cystamine (Cys, 500 μm) was determined by Western blotting. C and D, the protein expression of PAC1 after OGD or TM treatment with presence or absence of R283 (25 μm) was determined in the same way. Values are presented as means ± S.E. (error bars). *, p < 0.05; **, p < 0.01; and ***, p < 0.001. Representative results from three independent experiments are shown.
Effect of Knocking Down of TG2 on the PAC1 Expression in OGD Ischemia-induced ER Stress
To confirm the involvement of TG2 in the OGD-induced attenuation of PAC1 gene expression, Neuro2a cells were transfected with siRNA specific for TG2, which produced a marked decrease in TG2 protein levels (Fig. 6A). Importantly, decreased expression of PAC1 protein by OGD was significantly recovered by the transfection of siRNA against TG2 (Fig. 6B). In addition, the accumulation of CLSp1 in nuclei was abolished by TG2-specific siRNA treatment, but not in the cells transfected with control siRNA (Fig. 6C).
FIGURE 6.

The suppression of PAC1 expression by OGD was canceled by TG2-specific siRNA. A, the protein expression of TG2 was determined by Western blotting after transfection with TG2-specific siRNA or negative control (NC) siRNA. B, the protein expression of PAC1 was also determined after transfection with TG2-specific siRNA or negative control. C, the cells treated with OGD for 6 h after transfection with TG2-specific siRNA or negative control 1 were fixed and stained with anti-CLSp1 antibody (top row) or Hoechst 33342 (middle row). The results of merging the two images are shown in the bottom row (Merge). Values are presented as means ± S.E. (error bars). **, p < 0.01. Scale bar (C), 20 μm. Representative results from three independent experiments are shown.
Effect of OGD Condition or TM Treatment on Primary Mouse Cortical Neurons
OGD significantly decreased PAC1 mRNA in primary mouse cortical neurons (Fig. 7A). Its protein level was also decreased, but was completely recovered by the pretreatment of cystamine (Fig. 7B). Both OGD and TM treatment also induced the nuclear expression of TG2 (Fig. 7, C and D) and induced nuclear accumulation of CLSp1 (Fig. 7, E and F, lanes 2), which was significantly attenuated by pretreatment with cystamine (Fig. 7, E and F, lanes 3).
FIGURE 7.

OGD suppressed PAC1 expression in mouse primary cortical neurons via activation of TG2 and cross-linking of Sp1. Primary cortical neurons were treated with OGD for 1 h. A and B, mRNA levels (A) and protein expression (B) of PAC1 after OGD with presence or absence of cystamine (Cys, 250 μm) were determined by RT-PCR and Western blotting, respectively. Values are presented as means ± S.E. (error bars). *, p < 0.05; **, p < 0.01; and ***, p < 0.001. Representative results from three independent experiments are shown. C and D, primary mouse cortical neurons treated with OGD or TM were fixed and stained with TG2 (top row). The results of merging the two images, TG2 immunoreactivity and Hoechst 33342, are shown in the middle row (Merge). The bottom row shows double-magnified photographs. E and F, double staining of CLSp1 immunoreactivity (top row) and Hoechst 33342 (middle row) after OGD with the presence or absence of cystamine was performed. The results of merging the two images are shown in the bottom row (Merge). Scale bars, 40 μm (D) and 20 μm (E and F).
DISCUSSION
PACAP exhibits pleiotropic action in the CNS through the activation of PAC1. It is well known that both PACAP and NGF enhanced the expression of PAC1 (1). Zac1, which regulates apoptosis and cell cycle arrest, and p53, a tumor suppressor gene, have been shown to induce expression of the PAC1 gene (28). We have recently demonstrated that NGF augmented PAC1 gene expression through the activation of Sp1 via the Ras/MAPK pathway in PC12 cells (5). Further, it was reported that PACAP/PAC1 signaling is involved in pathophysiology of post-traumatic symptom disease, in which a human patient demonstrated increments of PAC1 in the amygdala and bed nucleus of the stria terminalis (29). Thus, the positive regulation of PAC1 has been profoundly investigated so far. However, regarding the negative regulation of PAC1, there are few reports, that is, the attenuated expression of PAC1 after transient focal cerebral ischemia in mice (2). Another study reported PAC1 mRNA was moderately decreased throughout the hippocampus after global ischemia in rat, whereas PACAP expression was selectively increased in the granule cell layer of the hippocampus (4). However, the underlying mechanism in the expression of the PAC1 gene has been unresolved so far. In this context, the data presented here are the first to show a mechanism of decreased PAC1 expression due to post-transcriptional modification of Sp1, a transcriptional factor responsible for the PAC1 gene expression, by TG2.
We first examined how PAC1 gene expression levels were affected by ER stress with TM or in vitro ischemic condition such as OGD. The expressions of cleaved caspase-3, GRP78 as a marker of ER stress and CHOP as an ER stress apoptotic mediator were significantly increased by OGD as well as TM, and their increments were attenuated by salubrinal, indicating a shared mechanism between OGD and TM treatment in terms of ER stress. These findings are also corroborated with previous reports (14). PAC1 expression levels were potently suppressed by OGD not only in Neuro2a cells but also in primary mouse cortical neurons. Furthermore, salubrinal significantly ameliorated reduction of PAC1 gene expression by OGD as well as TM, suggesting that the reduction in PAC1 expression might be primarily due to OGD-induced ER stress.
A luciferase reporter assay was performed to identify which transcriptional element is involved in suppression of PAC1 gene by ER stress. Among deleted mutants of the 5′-flanking region, the promoter activity of hP1L-1 was most potent and significantly attenuated by TM treatment in Neuro2a cells, suggesting the presence of responsible element for the gene suppression by TM in the region of −372/−252 bp. Then, a luciferase reporter assay demonstrated that the mutation on each Sp1 site located at −314/−305 bp and −282/−273 bp of hP1L-1 significantly canceled the suppression due to ER stress. The Sp1 site at −282/−273 bp was identical among human, mice, and rat, and the Sp1 site at −314/−305 bp was also almost conserved in all three species, suggesting that these Sp1 sites might be important for the expression of PAC1 gene. In fact, we recently reported that the Sp1 site at −282/−273 bp was particularly important for NGF-induced expression of PAC1 gene in PC12 cells (5).
Using Western blot analysis, we found that the protein level of Sp1 was significantly decreased by OGD or TM treatment in Neuro2a cells, although its mRNA level did not change. Based on our previous reports that inactivation and cross-linking of Sp1 have been shown to be induced by TG2 in liver injury-induced ER stress (21, 22), we focused on the cross-linking of Sp1, novel post-transcriptional suppression for protein function, and examined whether OGD-induced ER stress induces the cross-linking of Sp1 in neuronal cells. Immunocytochemical staining showed that the CLSp1 was induced in nuclei under the OGD-induced ER stress and was suppressed by salubrinal, cystamine or R283 (data not shown). This is the first report that inactivation and cross-linking of Sp1 were induced by ER stress in neurons. These data suggest that, in addition to PAC1, cross-linking and inactivation of Sp1 might also impair the expression of Sp1-regulated target genes, which are critical for cell growth and survival in the CNS. Thus, decrement of protein expression but not mRNA expression of Sp1 was due to the cross-linking of Sp1, which contributed to the decrement of the expression of PAC1 underlying ER stress.
Although other reports demonstrated the augmentation of TG2 expression in the hippocampus after reperfusion in a gerbil model of global cerebral ischemia (17, 30, 31), we found OGD-induced ER stress increased expression of TG2 not only in cytosol but also in nuclei of neuronal cells. Then OGD-induced nuclear TG2 expression and TG2 activity were markedly attenuated by salubrinal in agreement with previous findings (23). It should be interesting that cystamine attenuated not only TG2 activity but also TG2 expression, which were induced by OGD. Although cystamine is a transglutaminase inhibitor and its underlying mechanism remains unknown, previous reports also demonstrated the suppression of TG2 expression by cystamine (31, 32). Then by using TG2-specific inhibitor R283 and TG2-specific siRNA, we attempted to confirm whether or not TG2 is involved in suppression of PAC1 in OGD-induced ER stress. As a result, both treatments attenuated the accumulation of CLSp1 and the suppression of PAC1 expression in Neuro2a cells not only by TM treatment but also by OGD. Thus, we provide evidence that the accumulation of TG2 in the nucleus induces the formation of CLSp1, which subsequently suppresses PAC1 expression under OGD-induced ER stress in neuronal cells.
Regarding the effect on viability of neuronal cells, treatment with either OGD or TM reduced their survival rate, which was significantly ameliorated by the pretreatment with salubrinal or cystamine (data not shown) in agreement with previous reports (14, 15, 17, 24, 30, 31). The present finding that CHOP, GRP78, and cleaved caspase-3 were attenuated by the pretreatment with cystamine supports the previous report that the downstream activity of TG2 activates the calpain/caspase pathway (32). Also, knocking down of TG2 expression significantly attenuated their cell death (data not shown), In fact, it was reported previously that infarct volumes in TG2-knockout mice were significantly smaller compared with those in wild type mice (33), suggesting that TG2 is a potential target for development of therapeutics of brain ischemia.
In conclusion, we have shown that ischemia-induced activation of the PERK pathway of ER stress, subsequently activating TG2 and cross-linking Sp1, results in the suppression of PAC1 gene expression (Fig. 8), suggesting the attenuation of PACAP neuroprotection in brain ischemia. However, it is well known that brain ischemia also induces gene expression of several neurotrophic factors including NGF (34). Recently, we demonstrated that NGF augmented PAC1 gene expression through the activation of Sp1 via the Ras/MAPK pathway in PC12 cells (5). These observations suggest that PAC1 gene expression might be primarily suppressed but secondarily augmented and that Sp1 might be a pivotal transcriptional element in not only positive but also negative regulation of PAC1 gene expression. Because our findings regarding the suppression of PAC1 expression by TG2 were demonstrated only in in vitro models of neuronal apoptosis with OGD ischemia injury, further detailed analyses of the neurodegenerative pathway and also the protective pathway in vivo must lead us to the important pathophysiological knowledge of TG2 and PACAP. PACAP is well known to exhibit potent neuroprotection and thus could be expected as a therapeutic drug for brain ischemia. The present finding that PAC1 expression is suppressed by ischemia or ER stress should be substantially considered in the clinical application of a PAC1 agonist-like drug for effective treatment of ischemic damage following on stroke.
FIGURE 8.
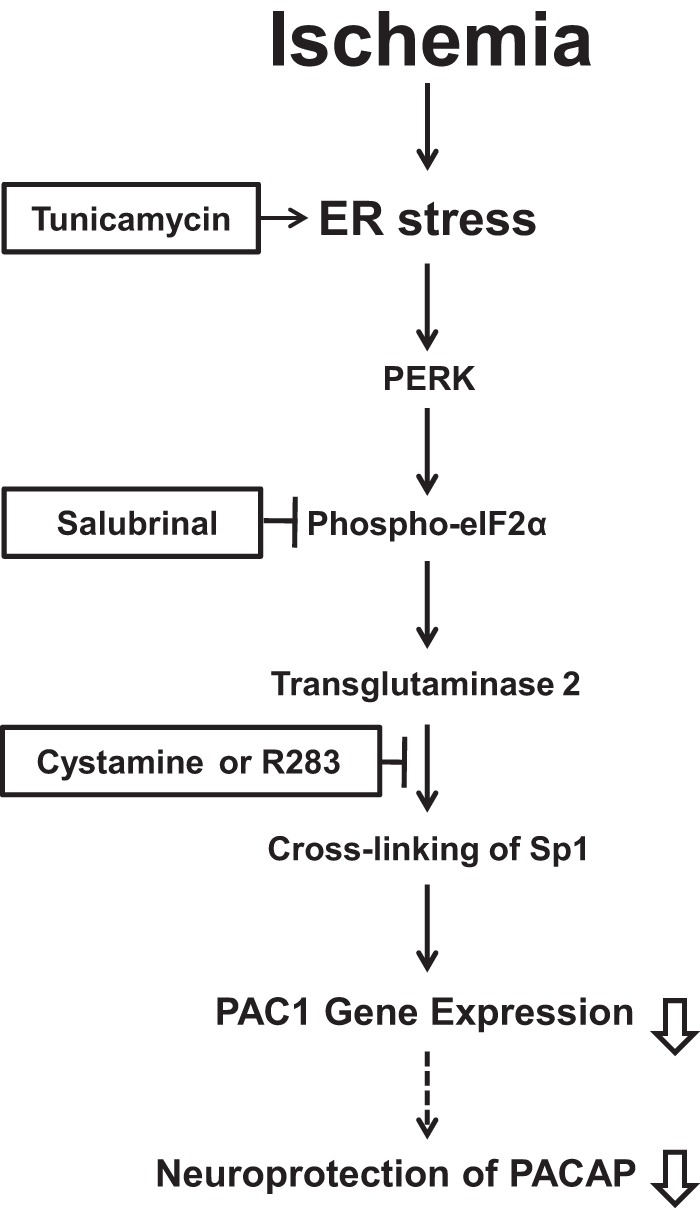
Schematic diagram showing how suppression of PAC1 is induced by brain ischemia via ER stress-mediated PERK activation, resulting in cross-linking of Sp1 by TG2.
Acknowledgments
We thank Dr. Shrestha Rajan and Dr. Xian-Yang Qin for excellent technical assistance and helpful advice.
This work was supported by Grant-in-aid for Scientific Research 21591182 (to A. M.) from the Ministry of Education, Culture, Sports, Science, and Technology of Japan.
- PAC1
- PACAP type 1 receptor
- CLSp1
- cross-linked Sp1
- ER
- endoplasmic reticulum
- OGD
- oxygen-glucose deprivation
- PACAP
- pituitary adenylate cyclase-activating polypeptide
- PERK
- protein kinase RNA-like endoplasmic reticulum kinase
- TG2
- transglutaminase 2
- TM
- tunicamycin.
REFERENCES
- 1. Vaudry D., Falluel-Morel A., Bourgault S., Basille M., Burel D., Wurtz O., Fournier A., Chow B. K., Hashimoto H., Galas L., Vaudry H. (2009) Pituitary adenylate cyclase-activating polypeptide and its receptors: 20 years after the discovery. Pharmacol. Rev. 61, 283–357 [DOI] [PubMed] [Google Scholar]
- 2. Uchida D., Arimura A., Somogyvári-Vigh A., Shioda S., Banks W. A. (1996) Prevention of ischemia-induced death of hippocampal neurons by pituitary adenylate cyclase-activating polypeptide. Brain Res. 736, 280–286 [DOI] [PubMed] [Google Scholar]
- 3. Reglodi D., Somogyvari-Vigh A., Vigh S., Maderdrut J. L., Arimura A. (2000) Neuroprotective effects of PACAP38 in a rat model of transient focal ischemia under various experimental conditions. Ann. N.Y. Acad. Sci. 921, 119–128 [DOI] [PubMed] [Google Scholar]
- 4. Riek-Burchardt M., Kolodziej A., Henrich-Noack P., Reymann K. G., Höllt V., Stumm R. (2010) Differential regulation of CXCL12 and PACAP mRNA expression after focal and global ischemia. Neuropharmacology 58, 199–207 [DOI] [PubMed] [Google Scholar]
- 5. Miura A., Odahara N., Tominaga A., Inoue K., Kambe Y., Kurihara T., Miyata A. (2012) Regulatory mechanism of PAC1 gene expression via Sp1 by nerve growth factor in PC12 cells. FEBS Lett. 586, 1731–1735 [DOI] [PubMed] [Google Scholar]
- 6. Yeh S. H., Yang W. B., Gean P. W., Hsu C. Y., Tseng J. T., Su T. P., Chang W. C., Hung J. J. (2011) Translational and transcriptional control of Sp1 against ischaemia through a hydrogen peroxide-activated internal ribosomal entry site pathway. Nucleic Acids Res. 39, 5412–5423 [DOI] [PMC free article] [PubMed] [Google Scholar]
- 7. Lee J., Kosaras B., Aleyasin H., Han J. A., Park D. S., Ratan R. R., Kowall N. W., Ferrante R. J., Lee S. W., Ryu H. (2006) Role of cyclooxygenase-2 induction by transcription factor Sp1 and Sp3 in neuronal oxidative and DNA damage response. FASEB J. 20, 2375–2377 [DOI] [PubMed] [Google Scholar]
- 8. Ryu H., Lee J., Zaman K., Kubilis J., Ferrante R. J., Ross B. D., Neve R., Ratan R. R. (2003) Sp1 and Sp3 are oxidative stress-inducible, antideath transcription factors in cortical neurons. J. Neurosci. 23, 3597–3606 [DOI] [PMC free article] [PubMed] [Google Scholar]
- 9. Lee M., Bikram M., Oh S., Bull D. A., Kim S. W. (2004) Sp1-dependent regulation of the RTP801 promoter and its application to hypoxia-inducible VEGF plasmid for ischemic disease. Pharm. Res. 21, 736–741 [DOI] [PubMed] [Google Scholar]
- 10. Miki N., Ikuta M., Matsui T. (2004) Hypoxia-induced activation of the retinoic acid receptor-related orphan receptor α4 gene by an interaction between hypoxia-inducible factor-1 and Sp1. J. Biol. Chem. 279, 15025–15031 [DOI] [PubMed] [Google Scholar]
- 11. Hayashi T., Saito A., Okuno S., Ferrand-Drake M., Dodd R. L., Chan P. H. (2004) Oxidative injury to the endoplasmic reticulum in mouse brains after transient focal ischemia. Neurobiol. Dis. 15, 229–239 [DOI] [PubMed] [Google Scholar]
- 12. Szegezdi E., Fitzgerald U., Samali A. (2003) Caspase-12 and ER stress-mediated apoptosis: the story so far. Ann. N.Y. Acad. Sci. 1010, 186–194 [DOI] [PubMed] [Google Scholar]
- 13. Tominaga A., Sugawara H., Inoue K., Miyata A. (2008) Implication of pituitary adenylate cyclase-activating polypeptide (PACAP) for neuroprotection of nicotinic acetylcholine receptor signaling in PC12 cells. J. Mol. Neurosci. 36, 73–78 [DOI] [PubMed] [Google Scholar]
- 14. Boyce M., Bryant K. F., Jousse C., Long K., Harding H. P., Scheuner D., Kaufman R. J., Ma D., Coen D. M., Ron D., Yuan J. (2005) A selective inhibitor of eIF2α dephosphorylation protects cells from ER stress. Science 307, 935–939 [DOI] [PubMed] [Google Scholar]
- 15. Nakka V. P., Gusain A., Raghubir R. (2010) Endoplasmic reticulum stress plays critical role in brain damage after cerebral ischemia/reperfusion in rats. Neurotox. Res. 17, 189–202 [DOI] [PubMed] [Google Scholar]
- 16. Caccamo D., Campisi A., Currò M., Li Volti G., Vanella A., Ientile R. (2004) Excitotoxic and post-ischemic neurodegeneration: involvement of transglutaminases. Amino Acids 27, 373-379 [DOI] [PubMed] [Google Scholar]
- 17. Ientile R., Caccamo D., Marciano M. C., Currò M., Mannucci C., Campisi A., Calapai G. (2004) Transglutaminase activity and transglutaminase mRNA transcripts in gerbil brain ischemia. Neurosci. Lett. 363, 173–177 [DOI] [PubMed] [Google Scholar]
- 18. Tolentino P. J., Waghray A., Wang K. K., Hayes R. L. (2004) Increased expression of tissue-type transglutaminase following middle cerebral artery occlusion in rats. J. Neurochem. 89, 1301-1307 [DOI] [PubMed] [Google Scholar]
- 19. Lorand L., Graham R. M. (2003) Transglutaminases: cross-linking enzymes with pleiotropic functions. Nat. Rev. Mol. Cell Biol. 4, 140–156 [DOI] [PubMed] [Google Scholar]
- 20. Verhaar R., Drukarch B., Bol J. G., Jongenelen C. A., Musters R. J., Wilhelmus M. M. (2012) Increase in endoplasmic reticulum-associated tissue transglutaminase and enzymatic activation in a cellular model of Parkinson's disease. Neurobiol. Dis. 45, 839–850 [DOI] [PubMed] [Google Scholar]
- 21. Tatsukawa H., Fukaya Y., Frampton G., Martinez-Fuentes A., Suzuki K., Kuo T. F., Nagatsuma K., Shimokado K., Okuno M., Wu J., Iismaa S., Matsuura T., Tsukamoto H., Zern M. A., Graham R. M., Kojima S. (2009) Role of transglutaminase 2 in liver injury via cross-linking and silencing of transcription factor Sp1. Gastroenterology 136, 1783–1795 [DOI] [PMC free article] [PubMed] [Google Scholar]
- 22. Tatsukawa H., Sano T., Fukaya Y., Ishibashi N., Watanabe M., Okuno M., Moriwaki H., Kojima S. (2011) Dual induction of caspase 3- and transglutaminase-dependent apoptosis by acyclic retinoid in hepatocellular carcinoma cells. Mol. Cancer 10, 4. [DOI] [PMC free article] [PubMed] [Google Scholar]
- 23. Kuo T. F., Tatsukawa H., Matsuura T., Nagatsuma K., Hirose S., Kojima S. (2012) Free fatty acids induce transglutaminase 2-dependent apoptosis in hepatocytes via ER stress-stimulated PERK pathways. J. Cell. Physiol. 227, 1130–1137 [DOI] [PubMed] [Google Scholar]
- 24. Currò M., Condello S., Caccamo D., Ferlazzo N., Parisi G., Ientile R. (2009) Homocysteine-induced toxicity increases TG2 expression in Neuro2a cells. Amino Acids 36, 725–730 [DOI] [PubMed] [Google Scholar]
- 25. Griffin M., Mongeot A., Collighan R., Saint R. E., Jones R. A., Coutts I. G., Rathbone D. L. (2008) Synthesis of potent water-soluble tissue transglutaminase inhibitors. Bioorg. Med. Chem. Lett. 18, 5559–5562 [DOI] [PubMed] [Google Scholar]
- 26. Skill N. J., Johnson T. S., Coutts I. G., Saint R. E., Fisher M., Huang L., El Nahas A. M., Collighan R. J., Griffin M. (2004) Inhibition of transglutaminase activity reduces extracellular matrix accumulation induced by high glucose levels in proximal tubular epithelial cells. J. Biol. Chem. 279, 47754–47762 [DOI] [PubMed] [Google Scholar]
- 27. Kambe Y., Miyata A. (2012) Role of mitochondrial activation in PACAP-dependent neurite outgrowth. J. Mol. Neurosci. 48, 550–557 [DOI] [PubMed] [Google Scholar]
- 28. Hoffmann A., Ciani E., Houssami S., Brabet P., Journot L., Spengler D. (1998) Induction of type I PACAP receptor expression by the new zinc finger protein Zac1and p53. Ann. N.Y. Acad. Sci. 11, 49–58 [DOI] [PubMed] [Google Scholar]
- 29. Ressler K. J., Mercer K. B., Bradley B., Jovanovic T., Mahan A., Kerley K., Norrholm S. D., Kilaru V., Smith A. K., Myers A. J., Ramirez M., Engel A., Hammack S. E., Toufexis D., Braas K. M., Binder E. B., May V. (2011) Post-traumatic stress disorder is associated with PACAP and the PAC1 receptor. Nature 470, 492–497 [DOI] [PMC free article] [PubMed] [Google Scholar]
- 30. Woo S. K., Kwon M. S., Geng Z., Chen Z., Ivanov A., Bhatta S., Gerzanich V., Simard J. M. (2012) Sequential activation of hypoxia-inducible factor 1 and specificity protein 1 is required for hypoxia-induced transcriptional stimulation of Abcc8. J. Cereb. Blood Flow Metab. 32, 525–536 [DOI] [PMC free article] [PubMed] [Google Scholar]
- 31. Shin D. M., Kang J., Ha J., Kang H. S., Park S. C., Kim I. G., Kim S. J. (2008) Cystamine prevents ischemia-reperfusion injury by inhibiting polyamination of RhoA. Biochem. Biophys. Res. Commun. 365, 509–514 [DOI] [PubMed] [Google Scholar]
- 32. Yoo J. O., Lim Y. C., Kim Y. M., Ha K. S. (2012) Transglutaminase 2 promotes both caspase-dependent and caspase-independent apoptotic cell death via the calpain/Bax protein signaling pathway. J. Biol. Chem. 287, 14377–14388 [DOI] [PMC free article] [PubMed] [Google Scholar]
- 33. Colak G., Johnson G. V. (2012) Complete transglutaminase 2 ablation results in reduced stroke volumes and astrocytes that exhibit increased survival in response to ischemia. Neurobiol. Dis. 45, 1042–1050 [DOI] [PMC free article] [PubMed] [Google Scholar]
- 34. Lee T. H., Kato H., Chen S. T., Kogure K., Itoyama Y. (1998) Expression of nerve growth factor and trkA after transient focal cerebral ischemia in rats. Stroke 29, 1687–1696 [DOI] [PubMed] [Google Scholar]