

Abstract
Cancer is a leading cause of death and alterations of glycosylation are characteristic features of malignant cells. Colorectal cancer is one of the most common cancers and its exact causes and biology are not yet well understood. Here, we compared glycosylation profiles of colorectal tumor tissues and corresponding control tissues of 13 colorectal cancer patients to contribute to the understanding of this cancer. Using MALDI-TOF(/TOF)-MS and 2-dimensional LC-MS/MS we characterized enzymatically released and 2-aminobenzoic acid labeled glycans from glycosphingolipids. Multivariate data analysis revealed significant differences between tumor and corresponding control tissues. Main discriminators were obtained, which represent the overall alteration in glycosylation of glycosphingolipids during colorectal cancer progression, and these were found to be characterized by (1) increased fucosylation, (2) decreased acetylation, (3) decreased sulfation, (4) reduced expression of globo-type glycans, as well as (5) disialyl gangliosides. The findings of our current research confirm former reports, and in addition expand the knowledge of glycosphingolipid glycosylation in colorectal cancer by revealing new glycans with discriminative power and characteristic, cancer-associated glycosylation alterations. The obtained discriminating glycans can contribute to progress the discovery of biomarkers to improve diagnostics and patient treatment.
Worldwide, cancer is a leading cause of death. With estimated 1.2 million diagnoses in 2008, colorectal cancer is the third most common cancer in the world and the fourth most common cause of death with an annual mortality of ∼600 000 (1). The exact causes of colorectal cancer are unknown, but different risk factors such as age, polyps, personal and family history, ulcerative colitis, or Crohn's colitis have been proposed (2). Standard screening procedures include flexible sigmoidoscopy, colonoscopy, and immunological fecal occult blood testing. Each of them has its advantages and drawbacks such as invasiveness or low sensitivity and specificity (3). The method of choice for the treatment of colorectal cancer is surgery and therapeutic decisions are based on the tumor, lymph node, and metastasis staging-system as a prognostic factor (4). Current research has led to improved treatment strategies of colorectal cancer, however, the clinical outcome, the progression of the disease, and the response to the treatment remain variable among individuals. The heterogeneity of colorectal cancer at the molecular level—caused by accumulation of multiple genetic changes—may be one of the main reasons for this variability (5). Genetic factors such as instabilities, but also expression levels (6) can explain part of the cancer biology, but glycomics is gaining importance to complement the overall picture as aberrant glycosylation of proteins and lipids has been shown to be correlated with disease and malignancy (7, 8).
Glycosylation is involved in many biological processes and especially its functional role in cellular interaction with respect to adhesion, cell growth, and signaling is prone to be affected in cancer progression, invasion, and metastasis (9). Several cancer-associated alterations in protein glycosylation have been reported: (1) increased branching of N-glycans, (2) higher density of O-glycans, and (3) incomplete synthesis of glycans. More particularly, an increased or induced expression of GlcNAc transferase V resulting in N-glycan structures with β1–6GlcNAc antennae (5, 10), and the expression of (sialyl) Tn-antigens (11) as aberrant O-glycosylation have been reported (10).
Altered glycosphingolipid (GSL)1 glycosylation of the cell surface membrane during malignancy can affect cell recognition, adhesion, and signal transduction (12) and is found to reflect: (1) incomplete synthesis with or without precursor accumulation, (2) neosynthesis (9), (3) increased sialylation, and (4) increased fucosylation (13). In many cancers, including colorectal cancer, an overexpression of the (sialyl) Lewis X antigen (10, 14) and the expression of (sialyl) Lewis A (15) are considered to be related to malignant transformation—reflecting incomplete synthesis of sialyl 6-sulfo Lewis X and disialyl Lewis A (16) as well as neosynthesis (17). Studies on gangliosides showed an overexpression of these sialylated GSLs in human malignant melanoma (18). Furthermore, the involvement of gangliosides in cell adhesion and motility was reported, which contributes to tumor metastasis (19). Specifically, the gangliosides GD3 (Hex2NeuAc2ceramide) and GM2 (Hex2HexNAc1NeuAc1ceramide) have been found to be associated with tumor-angiogenesis (19). The up-regulation of fucosyltransferases in cancer was shown to cause a higher degree of fucosylation in malignant tissues (20) and Moriwaki et al. proposed that the increase in the fucosylation for GSLs was an early event in cancer (21). Misonou et al. investigated glycans derived from GSLs in colorectal cancer tissues showing aberrant glycan structures based on linkage differences as well as increased sialylation and fucosylation compared with control tissue (22), which is in line with observed changes in GSL glycosylation with regard to cancer progression (9, 13).
Recently, we investigated the N-glycosylation profiles of colorectal tumors and correlating control tissues for biomarker discovery. Statistical analyses revealed an increase of sulfated glycan structures as well as paucimannosidic glycans and glycans containing sialylated Lewis type epitopes in the tumor tissue, whereas structures with bisecting GlcNAc were found to be decreased in malignancy (23). To further progress the understanding of colorectal cancer biology and the improvement of diagnostic tools and patient treatment, we complemented this recent study on N-glycosylation by an investigation of the glycosphingolipid-derived glycans (named GSL-glycans in the following) from frozen tumor tissues and corresponding control tissues from the same 13 colorectal cancer patients. GSL-glycans were enzymatically released, labeled with 2-aminobenzoic acid (AA) and analyzed by hydrophilic interaction liquid chromatography (HILIC) with fluorescence detection as well as matrix-assisted laser desorption/ionization time-of-flight mass spectrometry (MALDI-TOF-MS). Employing multivariate statistical analysis, this approach revealed an intricate GSL-glycosylation pattern of tumor tissues and specific glycosylation differences in comparison to the corresponding control tissue.
MATERIALS AND METHODS
Chemicals and Solvents
Ammonium formiate, 2-aminobenzoic acid (AA), 2-picoline borane, dimethylsulfoxide (DMSO), sodium taurodeoxycholate, and trifluoroacetic acid (TFA) were obtained from Sigma-Aldrich (Zwijndrecht, The Netherlands). The 500 mg C18-reverse phase (RP)-cartridges and methanol were obtained from J.T. Baker (Deventer, The Netherlands) and the 150 mg Carbograph graphitized carbon SPE-cartridges were from Alltech (Breda, The Netherlands). Acetonitrile (ACN) was obtained from Biosolve (Valkenswaard, The Netherlands). Chloroform, glacial acetic acid, and sodium azide were from Merck (Darmstadt, Germany). Recombinant endoglycoceramidase II (rEGCase II from Rhodococcus spec.) was purchased from Takara Bio Inc. (Shiga, Japan) and 2,5-dihydroxybenzoic acid (DHB) from Bruker Daltonics (Bremen, Germany). For preparation of buffers and solutions Milli-Q water was used.
Preparation of GSLs and Glycan Release
Preparation and analyses of the samples were performed as illustrated in Fig. 1. Details on tissue samples and GSL extraction are provided in the supplemental information. Purification of GSLs from the pooled upper phases after extraction was performed by RP-solid phase extraction (SPE). C18-RP-cartidges (500 mg, Baker) were prewashed with 5 ml of methanol followed by equilibration with 5 ml of methanol/water (10:90). Each cartridge was loaded with the pooled upper phases after extraction containing the GSLs and washed with 10 ml water. The combined flow-through and washing fraction were applied to a second C18-RP-cartridge, which was again washed with 10 ml of water. The bound GSLs were eluted from both cartridges with 5 ml of chloroform/methanol/water (10:10:1), combined and dried under a stream of nitrogen. The (glyco-)lipid samples were dissolved in 500 μl reconstitution buffer (50 mm sodium acetate buffer pH 5.0, containing 0.1% sodium taurodeoxycholate), sonicated for 10 min, and subsequently incubated for 10 min at 50 °C. After a further sonification step of 10 min, 8 μl of recombinant rEGCase II were added and samples were incubated for 24 h at 37 °C. Another 8 μl of rEGCase II were added, followed by again 24 h incubation at 37 °C. For purification, a C18-RP-cartridge (500 mg, Baker) was preconditioned with 5 ml of methanol and 5 ml of water. The sample was applied to the cartridge, which was then washed with 7 ml of water. GSL-glycans were contained in the flow-through and washing fraction, which were combined and dried under a stream of nitrogen.
Fig. 1.
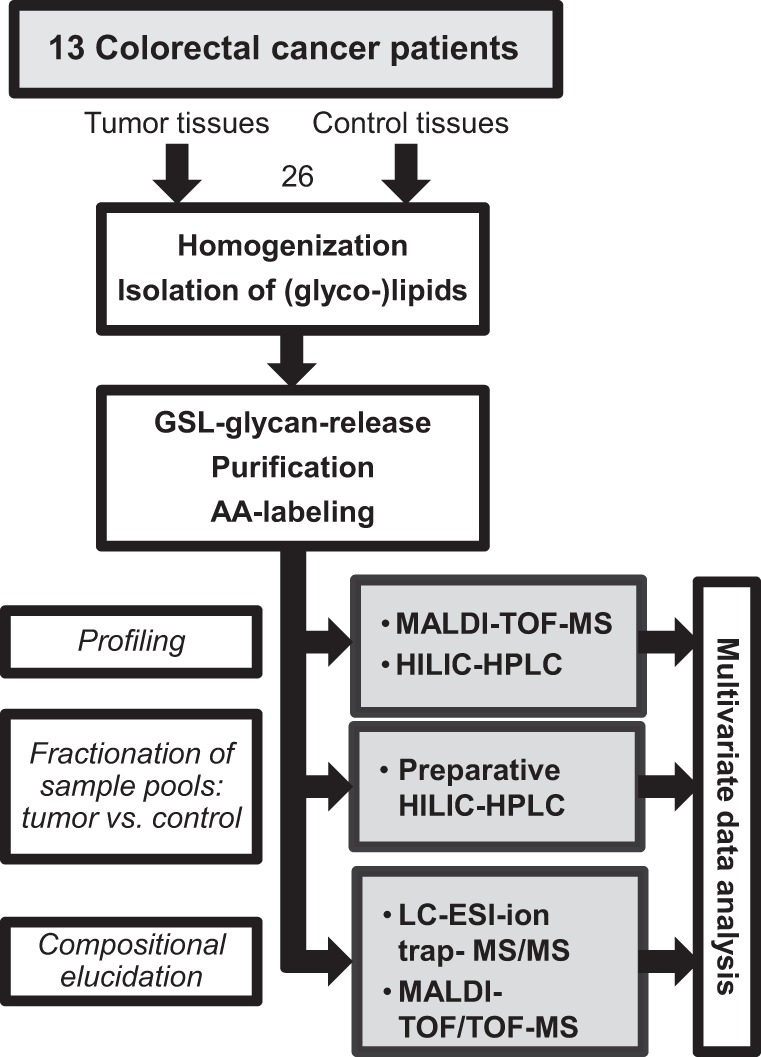
Schematic workflow of glycosphingolipid analysis of tumor and corresponding control tissues derived from 13 colorectal cancer patients.
Glycan Labeling and Purification
The dried samples of released GSL-glycans were dissolved in 50 μl water. For labeling, 25 μl of freshly prepared AA labeling solution (48 mg/ml AA in DMSO containing 15% glacial acetic acid) and 25 μl of freshly prepared reducing agent solution (1 m 2-picoline borane in DMSO) were added (24), followed by 10 min shaking and an incubation for 2 h at 65 °C. After incubation, the reaction mixture was cooled down to room temperature and AA-labeled glycans were purified using graphitized carbon SPE. In detail, the cartridges were preconditioned with 5 ml of ACN (containing 0.1% TFA), 5 ml of water/ACN (50:50), and equilibrated with 10 ml of water. Subsequently, the samples were loaded and washed with 10 ml of water. Elution of the labeled glycans was achieved by applying 5 ml of water/ACN (50:50, containing 0.1% TFA). The organic solvent was removed by vacuum centrifugation. The samples were freeze-dried and re-dissolved in 100 μl water for further analysis by MALDI-TOF-MS and HILIC-HPLC with fluorescence detection.
HILIC-HPLC Analysis and Fractionation of GSL-Glycans
Profiling of released and AA-labeled GSL-glycans of each patient-set was performed using HILIC-HPLC (TSK amide 80, 3 μm, 150 mm × 4.6 mm; Tosoh Bioscience, Stuttgart, Germany) with fluorescence detection (360 nm/420 nm) at a flow rate of 1 ml/min. Two solvents, A (80% ACN, 20% 50 mm ammonium formate pH 4.4) and B (50 mm ammonium formate pH 4.4), were applied in a binary gradient from 3% solvent B (0 min) to 43% solvent B (50 min). For analytical profiling, 1.5 μl of GSL-glycan samples were brought to 80% ACN in a volume of 40 μl. To avoid batch systemic-bias, samples were analyzed in pair-wise manner (tumor and control).
For fractionation purposes, the AA-labeled GSL-glycans samples were pooled according to tissue type (tumor tissue and control tissue, respectively) and freeze-dried. Each pool was dissolved in 500 μl of 77% ACN, followed by preparative HILIC-HPLC (same column and gradient conditions as above). Fractions (30 s) were collected, dried by vacuum centrifugation and reconstituted in 30 μl of water.
MALDI-TOF(/TOF)-MS
The GSL-glycans of 26 patient samples were profiled by MALDI-TOF-MS. Before MS analysis the released and AA-labeled GSL-glycans were purified by HILIC-SPE using cotton microtips (25). Purified glycans were spotted onto a stainless steel MALDI target plate (Bruker Daltonics) and cocrystallized with 1.3 μl of DHB (10 mg/ml in water/ACN, 50:50, containing 0.1% TFA). Samples were allowed to dry at room temperature. MALDI-TOF-MS was performed on an UltrafleXtremeTM mass spectrometer controlled by FlexControl 3.1 software (Bruker Daltonics). Spectra were acquired in the negative-ion reflector mode over the m/z-range from m/z 700 to m/z 5000 for a total of 5000 shots after external calibration using the Bruker peptides calibration kit.
Structure elucidation was achieved by MALDI-TOF/TOF-MS analyses of the fractionated pools. To this end, 5 μl glycan aliquots of dissolved HILIC-HPLC fractions were desalted using a C18 ZipTipTM (Millipore, Billerica, MA) according to the manufacturer's instructions. AA-labeled GSL-glycans were directly eluted onto a stainless steel MALDI target plate (Bruker Daltonics) along with 1.5 μl of DHB (10 mg/ml in water/ACN, 50:50, containing 0.1% TFA) and dried at room temperature. For fragmentation the gas-off TOF/TOF mode was used, in which selected parent ions undergo fragmentation in the field-free drift region, primarily because of metastable decay, followed by separation of the fragment ions by a second acceleration step.
LC-ESI-ion trap-MS/MS
Nano liquid chromatography (LC) was performed on 5 μl of the HILIC-HPLC fractions using an Ultimate 3000 LC system (Thermo Scientific; Amsterdam, The Netherlands). Samples were applied to a C18 trapping column (C18 PepMapTM, 0.3 mm × 5 mm; Thermo Scientific) and washed with 100% solvent A (0.1% formic acid in water and 0.4% ACN) at a flow rate of 25 μl/min for 10 min before separation of AA-labeled GSL-glycans on a C18-RP analytical column (C18 PepMap 100Å, 3 μm, 75 μm × 150 mm; Thermo Scientific) at a flow rate of 300 nL/min and elution was monitored by UV absorption (215 nm). Separation of AA-labeled GSL-glycans was achieved with a gradient from 0% of solvent B (95% ACN, 5% water) as starting condition to 25% in 15 min and in further 10 min to 70% of solvent B. Afterward, the column was washed for 5 min with 70% solvent B. The LC system was coupled via an online nanospray source to an Esquire HCT ultra ESI-ion trap-MS (Bruker Daltonics). Stainless steel capillaries with an inner diameter of 30 μm (Proxeon, Odense, Denmark) were used for electrospray (1100–1250 V) and the solvent was evaporated at 165 °C employing a nitrogen stream of 7 L/min. Spectra were acquired in positive-ion mode over a m/z-range from m/z 300 to m/z 1500 and the five most abundant peaks were selected for MS/MS fragmentation analysis by collision-induced dissociation.
Details on data processing and statistical analysis are provided in the Supplemental information. Compositions were assigned using GlycoWorkbench (Version 1.1, European Carbohydrates DataBase project; http://www.eurocarbdb.org/) with an accuracy of ±0.2 Da for tumor samples and ±0.4 Da for control samples.
RESULTS
Profiling of GSL-Glycans from Colorectal Cancer Tissues
GSL-glycans from tumor tissues of 13 patients diagnosed with colorectal cancer were analyzed and compared with their corresponding control tissues taken from the same resection material (approx. 6 cm apart from the colorectal tumor). GSLs were isolated by methanol/chloroform/water extraction, and glycan moieties were enzymatically released and AA-labeled before analyses by MALDI-TOF-MS as well as by HILIC-HPLC with fluorescence detection. Representative GSL-glycan profiles derived from tumor and control tissue of the same patient are shown in Fig. 2. GSL-glycan structures of the (iso)globo-series, the (neo)lacto-series and gangliosides with different numbers of LacNAc-repeats were found, which is in accordance with literature (22, 26, 27). Although these profiling spectra of tumor and control tissues show many similarities, there are some qualitative and quantitative differences. For example, the presence of sulfated structures could be observed in the higher mass range of GSL-glycans derived from the control tissue, whereas the tumor tissue profile is lacking these peaks or shows only minor amounts.
Fig. 2.

Negative ion mode MALDI-TOF-MS spectra of AA-labeled GSL-glycans from colorectal cancer tissue (B) and corresponding control tissue (A) of a representative patient. Glycan compositions of main peaks are annotated. H = hexose, N = N-acetylhexosamine, S = N-acetylneuraminic acid, F = fucose, Su = sulfate, AA= 2-aminobenzoic acid, * = metastable ion.
Furthermore, HILIC-HPLC with fluorescence detection was performed to profile and compare the tumor and corresponding control samples. The aligned and baseline-corrected chromatograms are provided in supplemental Fig. S1. As observed before for the MS-spectra, also the chromatograms show an overall similarity between the two types of samples, but specific differences in the presence or absence of peaks and relative intensities were detected.
Elucidation of GSL-Glycan Compositions by ESI-Ion Trap-MS/MS and MALDI-TOF/TOF-MS
For structural characterization of GSL-glycan compositions in the patient profiles, samples were pooled according to their tissue type (tumor versus control) and fractionated by preparative HILIC-HPLC. Next, aliquots of the fractions were analyzed by MALDI-TOF(/TOF)-MS and RP-nano ESI-ion trap-MS/MS allowing the identification of 123 GSL-glycan compositions of tumor and control tissues up to m/z of ∼4500 (see supplemental Table S2).
Assignment of structural features was based on the fragment spectra as well as on general glycobiological knowledge, former reported structures in literature and evident patterns in the profiling spectra. The fragmentation analyses revealed GSL-glycan species featuring mostly hexoses and N-acetylneuraminic acids as terminal monosaccharides, but also glycans with terminal HexNAc. On the basis of literature knowledge (27, 28) some of the GSL-glycans are expected to be branched, as summarized in supplemental Table S4. However, results from glycan fragmentation analyses did not provide information on linkage types or branching of GSL-glycan structures. Therefore, glycans were illustrated as linear compositions. In addition, many of the detected glycan compositions are assumed to represent isomer mixtures, containing also linear isomers of possible branched structures. Various modifications such as acetylation and sulfation could be identified as exemplified in the fragment spectra in Figs. 3A and 3B. The acetyl groups were assumed to be linked to N-acetylneuraminic acids on the basis of former reports (29, 30) and because fragment ions indicative for acetyl groups were only found for structures containing N-acetylneuraminic acids.
Fig. 3.

A, ESI-ion trap-MS/MS fragment spectrum of a GSL-glycan of m/z 1019.90 [M+2H]2+ assigned to the acetylated glycan species Ac1Hex5HexNAc3NeuAc1dHex1-AA. B, ESI-ion trap-MS/MS fragment spectrum of a GSL-glycan of m/z 783.75 [M+2H]2+, indicating the sulfated composition of Su1Hex4HexNAc2dHex2-AA with m/z 1564.49 [M-H]−. C, ESI-ion trap-MS/MS fragment spectrum of a GSL-glycan of composition Hex4HexNAc1NeuAc1-AA and m/z 641.79 [M+2H]2+, showing a fragment ion at m/z 626.2 indicative of a globo-series GSL-glycan. Blue circle = glucose, yellow circle = galactose, white square = N-acetylhexosamine, red triangle = fucose, purple diamond = N-acetylneuraminic acid, Ac = acetyl group, Su = sulfate. The presence of branching and structural isomers cannot be excluded.
The fragmentation analyses by MALDI-TOF/TOF-MS as well as LC-ESI-MS/MS for structure elucidation revealed the presence of globo-type GSL-glycans in the glycan pools released using rEGCase II (Fig. 3C). Likewise, we successfully analyzed globo-series GSL-glycans generated by rEGCase II treatment of glycosphingolipids already in a previous study (31). This is remarkable, as Ito et al. reported pronounced resistance of globo-type glycosphingolipids toward rEGCase II treatment (32).
The LC-MS/MS analysis of a GSL-glycan of composition Hex4HexNAc1NeuAc1-AA at m/z 641.78 [M+2H]2+ resulted in a fragment ion at m/z 1079.40 (Fig. 3C). This fragment may be explained as a Hex4NeuAc1-AA fragment [M+H]+, which to our knowledge is not in line with the mammalian GSL structures described in literature. Although an alternative compositional assignment of the fragment ion cannot be ruled out at the current stage, one may speculate that (1) a novel GSL-glycan structure with four inner hexoses was observed, or (2) this fragment may have been generated by a MS/MS-associated glycan rearrangement. More specifically, the loss of an internal N-acetylhexosamine may have occurred, leading to the generation of a [Hex4NeuAc1-AA+H]+ fragment ion. Glycan rearrangements in MS/MS analysis of glycans are well documented, and different rearrangements such as migration of monosaccharides—especially fucoses—and the loss of internal monosaccharides can occur (33).
Furthermore, LC-MS/MS analysis of 981.5 [M+H+Na]2+ of presumably globo-type GSL-glycans repeatedly showed a fragment ion at m/z 615.2 [M+Na]+ (supplemental Fig. S2A) corresponding to an N-acetylneuraminic acid linked to the AA-labeled hexose. In negative mode LIFT MS/MS the same composition of presumably globo-type GSL-glycan of m/z 1959.67 [M-2H+Na]+ could be confirmed, whereas no fragment corresponding to the fragment ion m/z 615.2 [M+Na]+ occurring in LC-MS/MS analysis was observed (supplemental Fig. S2B). Clearly, further studies into MS/MS glycan fragmentation mechanisms will be needed to characterize the fragment ion at m/z 615.2 [M+Na]+ and its interpretation as a mass spectrometric artifact or rearrangement product cannot currently be excluded.
Data Analyses Revealing GSL-Glycan Differences Between Tumor and Control Tissues
Multivariate statistical analysis (see supplemental information for details) were performed on both, MS-derived as well as HILIC-HPLC-derived, profiling data. Before analyses, the data was preprocessed as described in the Supplemental information. To obtain a paired PCA model, the within-individual variation—generated by multilevel simultaneous component analysis (MSCA) (34)—was used for the model generation. The PCA model for the MS profile data resulted in six principal components covering 84.3% (R2Xcum) of the variance in the data. A large part of the variation is already covered by the first principal component (R2X(1) = 32.1%). Together with the second principal component 48.3% of the total variance is explained (supplemental Fig. S3B). Score plots of the major component combinations are provided in supplemental Fig. S3A–S3D. The clustering of the two groups of samples within the data became visually most apparent in the principle components 1 and 5 as shown in Fig. 4A, although component 5 contributes with less than 1% to the variance. Because the model was built on within-patient data, external factors should be negligible. Consistently, no clustering for these components was observed according to gender, blood group, location of the tumor, or microsatellite instability (MSI) (supplemental Fig. S4). To extract discriminative GSL-glycan structures, a two-class PLS-DA model with tumor and controls as the class identities was built. Validation of the model by internal cross-validation (CV) with 13 cycles and each patient as individual group as well as permutation test with intercepts of R2 = 0.304 and Q2 = −0.304 obtained from 200 permutations indicated a valid model (33). A large part of the variation within the data (87.4% R2Ycum) could be explained by the two-component PLS-DA model and a good prediction ability Q2(cum) of 68% was achieved. The score plot after CV is shown in Fig. 4B, showing tumor and control-derived data clearly clustered to the upper right and lower left, respectively, whereas two patients exhibit a slightly separate clustering. Investigation of the underlying metadata of the patients did not result in the identification of abnormalities or special features that could explain the distance to the other samples. The corresponding loading plot of the PLS-DA model is shown in supplemental Fig. S5. The variable importance in the projection (VIP) ranks the variables (m/z values) according to their significance for the model, helping to reveal discriminative structures contributing mainly to the separation. Based on the VIP analysis 63 isotopic peaks of GSL-glycan structures with discriminative potential were extracted, which are listed in part in Table I (complete Table is provided as supplemental Table S3). All compounds that were considered as potential discriminators have a VIP value of 1 or higher for at least two consecutive isotopic peaks. In addition, the composition of these structures has been elucidated. Two of the top three discriminators based on the MS data were found to be decreased in tumor tissue: the acetylated structure Ac1Hex5HexNAc3NeuAc1dHex1-AA (m/z 2036.72 [M-H]−; Fig. 3A), as well as the globo-series GSL-glycan Hex5HexNAc2NeuAc2dHex1-AA (m/z 2082.70 [M-H]−; supplemental Fig. S6). The GSL-glycan Hex6HexNAc4NeuAc1dHex3-AA (m/z 2651.89 [M-H]−; supplemental Fig. S7) was found to be increased in the cancer tissues. The list of potential discriminators was further characterized by mainly fucosylated species to be increased in tumor tissue, whereas sulfated (three), acetylated (one) and disialyl glycans (four) were decreased. Interestingly, the glycan Hex4HexNAc3NeuAc1dHex1-AA (m/z 1832.63 [M-H]−) is a strong discriminator, which is decreased in the tumor tissue, whereas the corresponding fucosylated glycan Hex4HexNAc3dHex3-AA (m/z 1833.70 [M-H]−) showed a tendency toward increased levels in tumor.
Fig. 4.

Overview of multivariate data analysis on MALDI-TOF-MS profiling data of AA labeled GSL-glycans from tumor versus control tissues. Within-patient data was unit variance-scaled to perform PCA and two-class PLS-DA. A, Score plot of the PCA (PC1 vs. PC5) analysis with strong first component covering already 32.1% of the variance explained by the model. Clustering according to tissue type (tumor = red, control = blue) becomes and control is maximized and 87.4% (R2Ycum) variation is explained. The model shows good prediction power (Q2cum = 68%). B, Score plot of cross-validated PLS-DA analysis, where separation between tumor and control is maximized and 87.4% (R2Ycum) variation is explained. The model shows good prediction power (Q2cum = 68%).
Table I. Discriminators based on multivariate statistical analyses.
Glycosphingolipid-derived glycans were analyzed by MALDI-TOF(/TOF)-MS and RP-nano ESI-ion trap-MS/MS. The average relative intensity of the glycans was calculated for control tissue (A) and tumor tissue (B), respectively, and the fold change was determined. Arrows are indicating a decrease (↓) or increase (↑) of the GSL-glycans in the tumor tissue. The VIP value was extracted from a two-class PLS-DA and p values were obtained by Wilcoxon's signed-rank test with p = 0.05. The AUC was calculated by ROC analysis and indicates sensitivity and specificity of the potential discriminators. Blue circle = glucose, yellow circle = galactose, white square = N-acetylhexosamine, red triangle = fucose, purple diamond = N-acetylneuraminic acid, Ac = acetyl group, S = sulfate group, ns = not significant. The presence of branching and structural isomers cannot be excluded.
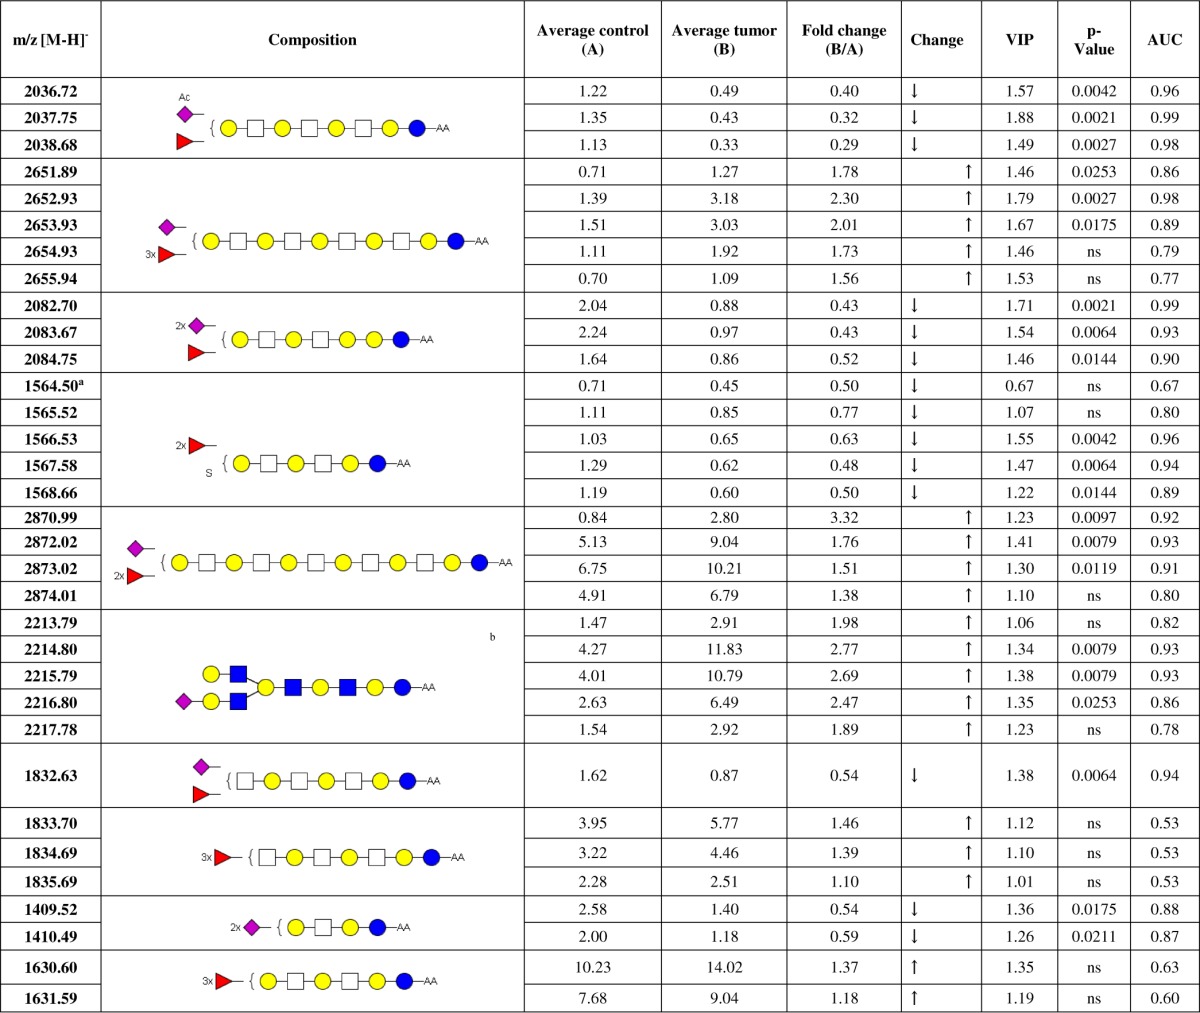
a Exception: VIP value < 1, but is considered in this list because it is the first isotopic peak of the GSL-glycan.
b Glycan structure according to (28).
Additional information on specificity and sensitivity of the potential discriminators was obtained by receiver operating curve (ROC) analysis and determination of the area under the ROC curve (AUC) (Table I, column 9). The former mentioned top three candidates showed high AUC values above 0.86 within the first three isotopes, confirming their potential power as discriminators between tumor tissues derived GSL-glycans and their corresponding controls. Furthermore, the fold change was calculated to indicate an increase or decrease of the differentially expressed GSL-glycans in the tumor tissue compared with the controls (Table I, column 5 and 6). Also this calculation supplied distinct values for the major candidates.
Additionally, Wilcoxon's signed rank test was performed on normalized data comparing relative intensities between tumor and control tissue for each variable. All variables (m/z values and data points, respectively), which showed a p value below 0.05, exhibited also a VIP value above 1 and the main discriminators were confirmed by this alternative analysis (Table I column 8). However the VIP value was the main criterion for consideration as discriminator.
A similar multivariate analysis and evaluation was performed on the HILIC profiling data (Fig. 5). Here, 57.25% (R2Xcum) variance could be covered by four principal components, where the first two principal components cover 19% and 16.1% of the variation, respectively. The score plots of major principal component combinations for the PCA are provided in supplemental Fig. S8. Best visual clustering after coloring the scores according to tissue type (tumor tissue = red, control tissue = blue) was achieved for components 1 and 3 (Fig. 5A), whereas no clustering was observed according to gender, blood group, location of the tumor, or MSI (supplemental Fig. S9). Maximized separation was achieved after applying a two-class-PLS-DA with tumor and control tissues as classes. The PLS-DA score plot after cross validation is shown in Fig. 5B, which explains a major part of the variation between the defined groups of tumor tissue and control tissue (R2Y(cum) = 90.2%). However, the predictive power of the model with Q2(cum) = 32.3% was less compared with the model based on the MS-data. The corresponding loading plot of the PLS-DA is provided as supplemental Fig. S10. Ranking the variables in regard of their contribution to the separation based on their VIP-values allowed the identification of discriminative peaks based on data points, which complied with the above mentioned criteria to be considered as potential discriminator. Because only fluorescence detection was performed with this profiling approach, structure annotation of the discriminating peaks was performed using information based on the MALDI-TOF(/TOF)-MS and LC-MS/MS analyses of the HILIC-HPLC fractions (supplemental Fig. S1). In accordance with MALDI-TOF-MS profiling data, HILIC-HPLC profiling implied decreased acetylation in tumor as a peak containing the acetylated structures Ac1H2S2-AA (m/z 1086.36) and Ac1H3N1S1-AA (m/z 1160.40) was found to be higher in controls. The same holds true for the disialylated structure H3HN1S2-AA (m/z 1409.49). On the other hand, the fucosylated structure H4N2F1-AA (m/z 1338.48), a MS-based discriminator, was assigned to a peak in the chromatogram increased in the tumor profiles (supplemental Fig. S1). In conclusion, the HILIC fluorescence profiling approach confirmed part of the findings of the MALDI-TOF-MS profiling, though the latter method gave a deeper insight into the glycomic differences of the two sample groups.
Fig. 5.
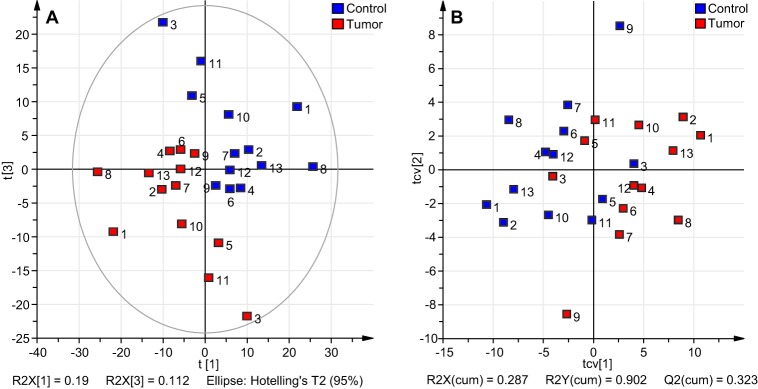
Overview of multivariate data analysis on HILIC-HPLC profiling data of released and AA-labeled GSL-glycans derived from tumor and corresponding control tissue. Unit variance-scaled within-patient data was applied for PCA and PLS-DA analysis. A, The two groups of samples (tumor: red, control: blue) already show a clustering in the score plot of the PCA analysis with the first component explaining 19% of the variance in the data. B, The cross-validated score plot of PLS-DA analysis indicates separation between the two groups of observations with R2Y(cum) = 90.2%, but with less prediction power (Q2cum = 32.3%).
Analysis of GSL-Glycan Classes
The statistical analyses revealed significant differences in the expression of GSL-glycans in colorectal tumor tissues and corresponding control tissues. The obtained discriminating structures indicated a tendency to increased fucosylation in malignancy, along with decreased sulfation, acetylation and disialylation as well as reduced levels of globo-type GSL-glycans. To test whether these observation are only valid for the discriminative structures identified in the multivariate analysis or whether they represent a general trend, the normalized intensities of confirmed structures were summed up within structure classes. A paired t test was then performed to reveal possible differences between tissue types within the structural classes. The results show that the fucosylation is significantly (p value < 0.05) increased in the colorectal tumor tissue compared with the control tissue (box plots in Fig. 6A). Interestingly, the difference is even stronger for structures containing more N-acetylhexosamines than fucoses (Fig. 6B). This observation gives evidence that per Hex-HexNAc repeat only one fucose is attached, which resembles structures of Lewis X and Lewis A type. The paired t test of classes showed further a significant decrease in acetylation (Fig. 6C, p value < 0.05) and sulfation (Fig. 6D, p value < 0.05) of GSL-glycans expressed in tumor tissues. The presence of GSL-glycans of the globo-series was demonstrated by fragmentation analysis and was assumed to occur for structures which are characterized by a difference of three between the number of hexoses and the number of N-acetylhexosamines. Testing on this feature, a significant decrease (p value < 0.01) in the expression in tumor tissues was observed (Fig. 6E). Also the expression of disialyl gangliosides was found to be significantly decreased (p value < 0.01) in the colorectal tumor tissues (Fig. 6F). These findings support the hypothesis that the discriminating structures obtained by PLS-DA represent a general trend in altered GSL-glycan expression in colorectal cancer tissues compared with their corresponding control tissues.
Fig. 6.
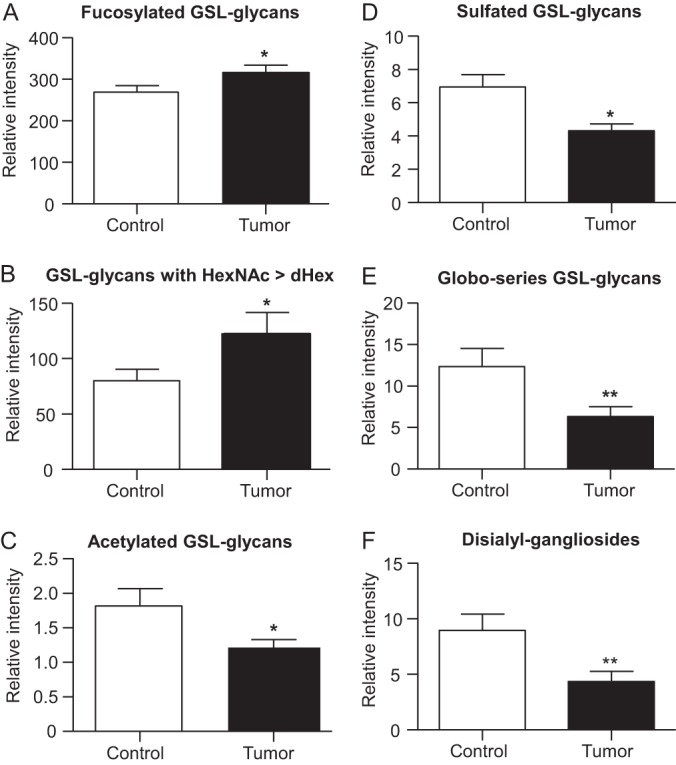
Box plots illustrating the differences within structural classes of GSL-glycans derived from tumor tissue and corresponding control tissues. Based on structural classes, normalized intensities obtained by MALDI-TOF-MS profiling data were summed within the groups (tumor vs. control) and a two-tailed paired t-test was performed to reveal changes between GSL-glycans in tumor tissue (black) and control tissue (white). The box plots show a significant increase in fucosylation of GSL-glycans in malignant tissue (A). A more detailed view on structural differences revealed that the increase in fucosylation becomes evident for GSL-glycans with a larger amount of N-acetylhexosamine then fucoses (B). In contrast, acetylated (C) and sulfated (D) GSL-glycans are significantly decreased in tumor. Additionally, the appearance of GSL-glycans of the globo-series, indicated by a difference of the numbers hexoses and the numbers of N-acetylhexosamines of three (n(Hex)-(HexNAc) = 3), is shown to be significantly decreased in tumor-derived tissue (E) as well as the level of disialylated gangliosides (F). The bars demonstrate the mean normalized intensities of the 13 patients in each group, error bars indicate the standard error of the mean. * p < 0.05; ** p < 0.01.
DISCUSSION
In this study on alterations in the glycosylation of colorectal cancer tissues, we combined MALDI-TOF-MS and HILIC-HPLC with fluorescence detection to investigate glycans released from GSLs. Tissues from thirteen colorectal cancer patients were investigated using this biomarker-discovery approach. To increase the power of the study, paired samples were used (tumor and control tissues from the same patient) and a comparative study design was chosen. Within-patient data was analyzed in a complex multivariate data analysis revealing significant changes in GSL-glycosylation in tumor tissues compared with control tissues.
For MALDI-TOF-MS, derivatization of glycans with AA enabled negative-mode detection of both, neutral and negatively charged (sialylated and sulfated) glycans, thereby providing a single, comprehensive glycan profile. In contrast, analysis of native glycans by MALDI-TOF-MS requires both positive-mode and negative-mode measurements, to cover neutral as well as negatively charged glycans, respectively. Moreover, the rather limited amounts of samples precluded the application of additional parallel analytical approaches. Therefore, the analysis of AA-labeled glycans was preferred taking advantage of a single step to obtain overall glycan profiles. However, this method is influenced by a slightly lower ionization efficacy of neutral glycans compared with sialylated species and by a partial loss of sialic acids because of some insource and metastable decay (35). Still, as these phenomena equally affect tumor and control tissues, it allows a comparative study, which indeed readily revealed tumor-associated GSL-glycosylation features. The same holds true for the enzyme efficiency and its substrate specificity. Because of limited amounts of sample we were not able to investigate these issues and the obtained GSL-glycans may not represent the whole GSL-glycan profile in an unbiased manner. However, the power of our study lays in the comparative approach, which allows the identification of differences between the two tissue types, which one may assume to be equally effected by potential technical limitations.
HILIC-HPLC was used as a second analytical approach, and HILIC-HPLC fractions were subjected to nano LC-MS/MS as well as MALDI-TOF(/TOF)-MS to analyze glycan compositions (supplemental Fig. S11). Using this approach, we identified more than 100 GSL-glycan compositions in tumor and control colorectal tissue present in the fractions. The glycans detected were for the major part in line with literature (22, 26, 27, 36). In addition, we were able to characterize larger GSL-glycan structures, which have not been reported for colorectal cancer tissue before (supplemental Table S4). The two MS/MS approaches for fragmentation gave detailed information on GSL-glycans present in each HPLC fraction and resulted in partially overlapping data, allowing for complementation as well as confirmation of GSL-glycan compositions (supplemental Table S2, supplemental Figs. S2 and S11). The statistical analysis of the HPLC data revealed various discriminating peaks. Peaks for which a GSL-glycan assignment was possible supported results from the MS-data based statistics.
In our study we observed an increased fucosylation of GSLs in the tumor tissues (Figs. 6A and 6B), which is in accordance with previous studies on alterations in cancer glycosylation (21, 27). More specifically, sialyl Lewis X antigen (37) and sialyl Lewis A antigen (15) are considered to be cancer-associated carbohydrate antigens in colon tumors and their overexpression correlates with metastasis occurrence, recurrence and survival. Fucolipids accumulating in colorectal cancer were identified by groups around Hakomori (38, 39, 40), which were also present in the investigated tumor tissues, but were only slightly increased. We newly detected highly fucosylated tumor-associated structures above m/z 2200 [M-H]−, which featured high discrimination power on the basis of statistical analyses (Table I and supplemental Table S3). These structures may be extended versions of previously reported fucosylated GSL-glycans, some of which have been reported for myelomas before whereas their observation in colorectal tumor tissues is novel (28, 41, 42).
Moreover, a significant decrease of GSL-glycan acetylation was observed in the colorectal tumor tissues (Fig. 6C). Interestingly, O-acetylation of sialic acids is involved in cell growth and possibly apoptosis inhibition (30) and has been reported previously to be associated with malignancy such as melanoma and inflammatory events (43). On the contrary, a decrease of O-acetylation was found in the colorectal mucosa (44) and was proposed as an early event in colon cancer progression (45). Assumptions were made that the acetyl-groups linked to the sialic acids protect the colon mucosa from degradation in healthy state (46) and that removal of the acetyl groups enhances cell migration because of cell contact inhibition (47). The ganglioside GD3 was claimed to be the main carrier of acetylated sialic acids (30). Accordingly, we found acetylated GD3 in the investigated tissues, but additional acetylated gangliosides were identified such as GM1, GD2, GD1, and mono- and disialylated gangliosides with up to eight monosaccharides, as well as their fucosylated derivatives.
Our comparative study revealed a significant decrease in sulfation of tumor tissue GSLs (Fig. 6E). This is in line with studies by Byrd et al. (14) and Vavasseur et al. (48) who observed decreased sulfation of colorectal cancer mucins. Likewise, a decreased expression of sialyl 6-sulfo Lewis X in colorectal cancer cells was reported leading to an increased presence of sialyl Lewis X epitopes (49, 50), which is associated with tumor metastasis (8) and tumor angiogenesis (51). Yusa et al. (50) proposed a decreased transcription of the diastrophic dysplasia sulfate transporter (DTDST) gene to cause a reduced expression of 6-sulfated glycans, whereas others associate an up-regulation of glycan sulfotransferase activities with tumorigenesis in human gastric cancer (52). Although decreased sulfation was mainly observed in mucin glycoproteins (14, 48), Siddqui et al. reported an enrichment of sulfo-GSLs in the mucosa of human colonic tumors (53). Alterations in sulfatide composition in colorectal cancer tissues was supposed to be involved in lymph node metastasis (54). In contrast, an unusual accumulation of sulfated glycosphingolipids of colorectal cancer cells was associated with low metastatic potential of the cancer (55). Interestingly, N-glycans in colorectal cancer tumors seem to exhibit an increased sulfation (23) showing that the alteration of glycosylation patterns with malignancies is a complex phenomenon, which not equally affects the various glycoconjugates. Also the function of sulfated glycans has not yet been completely solved: whereas some concluded a protective function against bacteria and degradation (56), which would cause a more vulnerable tissue after sulfate loss, others report a binding of sulfated O-glycans and GSLs to galectin-4 promoting cell adhesion and facilitating migration and motility of tumor cells (57). The role and consequences of changes in glycan sulfation as well as the type of alteration itself remain a contradictory aspect with regard to cancer progression.
The globo-type glycan Gb3 was shown to be highly expressed in metastatic colorectal cancer (58). Because Gb3 is also expressed in the vascular surrounding of the tumor (59), it is assumed to have a pro-angiogenic feature (60), which is supported by the observation of enhanced invasiveness with higher Gb3 expression (58). In our study, we did not detect Gb3-derived glycans in MALDI-TOF-MS profiling because of the interference of matrix signals. However, after fractionation and MS(/MS)-analyses we identified the Gb3 GSL-glycan in the tumor tissue pool. Notably, we found the overall group of detected globo-series GSL-glycans, including sialylated as well as fucosylated structures (supplemental Table S2), to be decreased (Fig. 6F) in the investigated tumor tissues. Hakomori summarized aberrant glycosylation in malignancy including the decreased expression or complete deletion of Gb4, Gb5, and longer neutral glycosphingolipids (61), but to our knowledge no results on an overall decrease of globo-type GSL-glycans associated with colorectal tumors were hitherto reported.
The gangliosides GD3 (Hex2NeuAc2ceramide) and GD2 (Hex2HexNAc1NeuAc2ceramide) were considered as tumor-associated glycans (62, 63) and Furukawa et al. reported elevated levels of disialyl gangliosides in melanomas and small cell lung cancer (64). In our investigations, GD3 turned out to be one of the discriminators, which was decreased in tumor tissue and also other discriminating disialylated gangliosides were found to be decreased in tumor. In line with this, the class comparison of disialyl GSL-glycans revealed a significant decrease in the colorectal tumor samples (Fig. 6F). The presence of GSLs with disialyl Lewis A epitope was shown in colon adenocarcinoma, but only as a minor compound, whereas this structure was found to be enriched on glycoproteins in adenocarcinoma (65). In accordance with our findings, Miyazaki et al. reported a loss of disialylated Lewis A in colorectal cancer cell lines (66). Additionally to the α 2–3-linked sialic acid of sialyl Lewis A, disialyl Lewis A carries a α-2–6 linked sialic acid because of sialyltransferase ST6GalNAcVI activity (67). In their study, Miyazaki et al. found the activity of ST6GalNAcVI to be dramatically reduced in colon tumors (66) leading to incomplete synthesis of glycans. They further identified disialyl Lewis A as a specific ligand for siglec-7, which is involved in immune response acting as inhibitory receptor (66). The loss of disialylation results in accumulation of sialyl-Lewis X and sialyl Lewis A type glycans, which enhances cell adhesion to the vascular endothelium through E-selectin (50) and is associated with a bad prognosis in colorectal cancer patients (16).
All identified discriminative GSL-glycan compositions were investigated and confirmed using LC-MS/MS and MALDI-TOF/TOF-MS fragmentation analysis. Because of the microscale sample preparation the amounts of analytes were limited and prohibited a comprehensive characterization of the discriminators. However, some of the discriminative glycans have previously been reported in literature following large-scale purification as summarized in supplemental Table S4. Furthermore, some discriminators represent general differences between tumor and control tissues, which were known to apply to the case of colorectal cancer (14, 16, 37, 44, 45, 48, 66), supporting the relevance of the discriminating GSL-glycans found here. In addition to former reports, our approach allowed the detection of GSL-glycans in higher mass range as well as GSL-glycans so far only described for other cancers (28) and our analysis newly revealed a general decrease of globo-type GSL-glycans.
Changes of the glycosylation pattern of cells are well known to be cancer-associated and the investigation and evaluation of specific alterations can help to explore the biology of cancers and reveal new diagnostic biomarkers and drug targets. Our results confirmed former findings on aberrant glycosylation in colorectal tumors, but also provided new insights contribute to a better understanding of colorectal tumors. Moreover, the obtained observations show that glycosylation is differently affected in various cancers as well as between glycoconjugates.
Supplementary Material
Acknowledgments
We thank Wesley L.J. Fung for his contribution to the measurements and Ekaterina Nevedomskaya for support with statistical analysis.
Footnotes
* This work was supported by the European Union (Seventh Framework Programme HighGlycan project, grant number: 278535).
 This article contains supplemental Tables S1 to S4 and Figs. S1 to S11.
1 The abbreviations used are:
- GSL-glycan
- glycosphingolipid derived glycan
- AA
- 2-aminobenzoic acid
- Ac
- acetyl group
- Fuc
- F, fucose
- Hex
- H, hexose
- HILIC
- hydrophilic interaction liquid chromatography
- MSCA
- multivariate simultaneous component analysis
- HexNAc
- N, N-acetylhexosamine
- NeuAc
- S, N-acetylneuraminic acid
- PLS-DA
- partial least squares-discriminant analysis
- PCA
- principal component analysis
- RP-SPE
- reversed phase solid phase extraction
- Su
- sulfate group
- MS/MS
- tandem mass spectrometry.
REFERENCES
- 1. Jemal A., Bray F., Center M. M., Ferlay J., Ward E., Forman D. (2011) Global cancer statistics. Cancer J. Clin. 61, 69–90 [DOI] [PubMed] [Google Scholar]
- 2. Weitz J., Koch M., Debus J., Höhler T., Galle P. R., Büchler M. W. (2005) Colorectal cancer. Lancet 365, 153–165 [DOI] [PubMed] [Google Scholar]
- 3. Davies R. J., Miller R., Coleman N. (2005) Colorectal cancer screening: prospects for molecular stool analysis. Nat. Rev. Cancer 5, 199–209 [DOI] [PubMed] [Google Scholar]
- 4. Wolpin B. M., Mayer R. J. (2008). Systemic treatment of colorectal cancer. Gastroenterology 134, 1296–1310.e1 [DOI] [PMC free article] [PubMed] [Google Scholar]
- 5. Murata K., Miyoshi E., Kameyama M., Ishikawa O., Kabuto T., Sasaki Y., Hiratsuka M., Ohigashi H., Ishiguro S., Ito S., Honda H., Takemura F., Taniguchi N., Imaoka S. (2000) Expression of n-acetylglucosaminyltransferase V in colorectal cancer correlates with metastasis and poor prognosis. Clin. Cancer Res. 6, 1772–1777 [PubMed] [Google Scholar]
- 6. Diaz-Cano S. J. (2012) Tumor heterogeneity: mechanisms and bases for a reliable application of molecular marker design. Int. J. Mol. Sci. 13, 1951–2011 [DOI] [PMC free article] [PubMed] [Google Scholar]
- 7. An H. J., Kronewitter S. R., Leoz M. L. A. de, Lebrilla C. B. (2009). Glycomics and disease markers. Curr. Opin. Chem. Biol. 13:601–607 [DOI] [PMC free article] [PubMed] [Google Scholar]
- 8. Kannagi R., Izawa M., Koike T., Miyazaki K., Kimura N. (2004) Carbohydrate-mediated cell adhesion in cancer metastasis and angiogenesis. Cancer Sci. 95, 377–384 [DOI] [PMC free article] [PubMed] [Google Scholar]
- 9. Hakomori S. (1996) Tumor Malignancy Defined by Aberrant Glycosylation and Sphingo(glyco)lipid Metabolism. Cancer Res. 56, 5309–5318 [PubMed] [Google Scholar]
- 10. Fernandes B., Sagman U., Auger M., Demetrio M., Dennis J. W. (1991) β1–6 branched oligosaccharides as a marker of tumor progression in human breast and colon neoplasia. Cancer Res. 51, 718–723 [PubMed] [Google Scholar]
- 11. Brockhausen I. (2006) Mucin-type O-glycans in human colon and breast cancer: glycodynamics and functions. EMBO Rep. 7, 599–604 [DOI] [PMC free article] [PubMed] [Google Scholar]
- 12. Regina Todeschini A., Hakomori S. (2008) Functional role of glycosphingolipids and gangliosides in control of cell adhesion, motility, and growth, through glycosynaptic microdomains. Biochim. Biophys. Acta, Gen. Subj. 1780, 421–433 [DOI] [PMC free article] [PubMed] [Google Scholar]
- 13. Durrant L. G., Noble P., Spendlove I. (2012) Immunology in the clinic review series; focus on cancer: glycolipids as targets for tumour immunotherapy. Clin. Exp. Immunol. 167, 206–215 [DOI] [PMC free article] [PubMed] [Google Scholar]
- 14. Byrd J., Bresalier R. (2004) Mucins and mucin binding proteins in colorectal cancer. Cancer Metastasis Rev. 23, 77–99 [DOI] [PubMed] [Google Scholar]
- 15. Nakayama T., Watanabe M., Katsumata T., Teramoto T., Kitajima M. (1995) Expression of Sialyl Lewisa as a new prognostic factor for patients with advanced colorectal carcinoma. Cancer 75, 2051–2056 [DOI] [PubMed] [Google Scholar]
- 16. Kannagi R. (2003) Molecular mechanism for cancer-associated induction of sialyl Lewis X and sialyl Lewis A expression—The Warburg effect revisited. Glycoconjugate J. 20, 353–364 [DOI] [PubMed] [Google Scholar]
- 17. Koike T., Kimura N., Miyazaki K., Yabuta T., Kumamoto K., Takenoshita S., Chen J., Kobayashi M., Hosokawa M., Taniguchi A., Kojima T., Ishida N., Kawakita M., Yamamoto H., Takematsu H., Suzuki A., Kozutsumi Y., Kanangi R. (2004) Hypoxia induces adhesion molecules on cancer cells: A missing link between Warburg effect and induction of selectin-ligand carbohydrates. Proc. Natl. Acad. Sci. U.S.A. 101, 8132–8137 [DOI] [PMC free article] [PubMed] [Google Scholar]
- 18. Hamilton W. B., Helling F., Lloyd K. O., Livingston P. O. (1993) Ganglioside expression on human malignant melanoma assessed by quantitative immune thin-layer chromatography. Int. J. Cancer 53, 566–573 [DOI] [PubMed] [Google Scholar]
- 19. Birklé S., Zeng G., Gao L., Yu R. K., Aubry J. (2003) Role of tumor-associated gangliosides in cancer progression. Biochem. Mol. Biol. 85, 455–463 [DOI] [PubMed] [Google Scholar]
- 20. Miyoshi E., Moriwaki K., Nakagawa T. (2008) Biological Function of Fucosylation in Cancer Biology. J. Biochem. 143, 725–729 [DOI] [PubMed] [Google Scholar]
- 21. Moriwaki K. (2010) Fucosylation and gastrointestinal cancer. WJH, 2, 151. [DOI] [PMC free article] [PubMed] [Google Scholar]
- 22. Misonou Y., Shida K., Korekane H., Seki Y., Noura S., Ohue M., Miyamoto Y. (2009) Comprehensive Clinico-Glycomic Study of 16 Colorectal Cancer Specimens: Elucidation of Aberrant Glycosylation and Its Mechanistic Causes in Colorectal Cancer Cells. J. Proteome Res. 8, 2990–3005 [DOI] [PubMed] [Google Scholar]
- 23. Balog C. I. A., Stavenhagen K., Fung W. L. J., Koeleman C. A., McDonnell L. A., Verhoeven A., Mesker W. E., Tollenaar R. A. E. M., Deelder A. M., Wuhrer M. (2012) N-glycosylation of colorectal cancer tissues: A liquid chromatography and mass spectrometry-based investigation. Mol. Cell. Proteomics 11, 571–585 [DOI] [PMC free article] [PubMed] [Google Scholar]
- 24. Ruhaak L. R., Steenvoorden E., Koeleman C. A. M., Deelder A. M., Wuhrer M. (2010) 2-Picoline-borane: A non-toxic reducing agent for oligosaccharide labeling by reductive amination. Proteomics 10, 2330–2336 [DOI] [PubMed] [Google Scholar]
- 25. Selman M. H. J., Hemayatkar M., Deelder A. M., Wuhrer M. (2011) Cotton HILIC SPE microtips for microscale purification and enrichment of glycans and glycopeptides. Anal. Chem. 83, 2492–2499 [DOI] [PubMed] [Google Scholar]
- 26. Holgersson J., Strömberg N., Breimer M. E. (1988) Glycolipids of human large intestine: difference in glycolipid expression related to anatomical localization, epithelial/non-epithelial tissue and the ABO, Le and Se phenotypes of the donors. Biochimie 70, 1565–1574 [DOI] [PubMed] [Google Scholar]
- 27. Korekane H., Tsuji S., Noura S., Ohue M., Sasaki Y., Imaoka S., Miyamoto Y. (2007) Novel fucogangliosides found in human colon adenocarcinoma tissues by means of glycomic analysis. Anal. Biochem. 364, 37–50 [DOI] [PubMed] [Google Scholar]
- 28. Stroud M. R., Handa K., Salyan M. E. K., Ito K., Levery S. B., Hakomori S.-i., Reinhold B. B., Reinhold V. N. (1996) Monosialogangliosides of human myelogenous leukemia HL60 cells and normal human leukocytes. 1. Separation of E-selectin binding from nonbinding gangliosides, and absence of sialosyl-lex having tetraosyl to octaosyl core. Biochemistry 35, 758–769 [DOI] [PubMed] [Google Scholar]
- 29. Cheresh D. A., Varki A. P., Varki N. M., Stallcup W. B., Levine J., Reisfeld R. A. (1984) A monoclonal antibody recognizes an O-acylated sialic acid in a human melanoma-associated ganglioside. J. Biol. Chem. 259, 7453–7459 [PubMed] [Google Scholar]
- 30. Schauer R., Srinivasan G. V., Wipfler D., Kniep B., Schwartz-Albiez R. (2011). O-Acetylated Sialic Acids and Their Role in Immune Defense, p. 525–548 In Wu A. M. (ed.), The molecular immunology of complex carbohydrates-3. Springer US. Advances in Experimental Medicine and Biology. Springer US [DOI] [PMC free article] [PubMed] [Google Scholar]
- 31. Wuhrer M., Grimm C., Dennis R. D., Idris M. A., Geyer R. (2004) The parasitic trematode Fasciola hepatica exhibits mammalian-type glycolipids as well as Gal(β1–6)Gal-terminating glycolipids that account for cestode serological cross-reactivity. Glycobiology 14, 115–126 [DOI] [PubMed] [Google Scholar]
- 32. Ito M., Yamagata T. (1989) Purification and characterization of glycosphingolipid-specific endoglycosidases (endoglycoceramidases) from a mutant strain of Rhodococcus sp. Evidence for three molecular species of endoglycoceramidase with different specificities. J. Biol. Chem. 264, 9510–9519 [PubMed] [Google Scholar]
- 33. Wuhrer M., Deelder A. M., van der Burgt Y. E. (2011) Mass spectrometric glycan rearrangements. Mass Spectrom. Rev. 30, 664–680 [DOI] [PubMed] [Google Scholar]
- 34. Jansen J. J., Hoefsloot H. C., van der Greef J., Timmerman M. E., Smilde A. K. (2005) Multilevel component analysis of time-resolved metabolic fingerprinting data. Anal. Chim. Acta 530, 173–183 [Google Scholar]
- 35. Ruhaak L. R., Zauner G., Huhn C., Bruggink C., Deelder A. M., Wuhrer M. (2010) Glycan labeling strategies and their use in identification and quantification. Anal. Bioanal. Chem. 397, 3457–3481 [DOI] [PMC free article] [PubMed] [Google Scholar]
- 36. Breimer M. E., Hansson G. C., Karlsson K.-A., Larson G., Leffler H. (2012) Glycosphingolipid composition of epithelial cells isolated along the villus axis of small intestine of a single human individual. Glycobiology 22, 1721–1730 [DOI] [PubMed] [Google Scholar]
- 37. Schiffmann L., Schwarz F., Linnebacher M., Prall F., Pahnke J., Krentz H., Vollmar B., Klar E. (2012) A novel sialyl LeX expression score as a potential prognostic tool in colorectal cancer. WJSO 10, 95. [DOI] [PMC free article] [PubMed] [Google Scholar]
- 38. Hakomori S., Nudelman E., Levery S. B., Kannagi R. (1984) Novel fucolipids accumulating in human adenocarcinoma. I. Glycolipids with di- or trifucosylated type 2 chain. J. Biol. Chem. 259, 4672–4680 [PubMed] [Google Scholar]
- 39. Fukushi Y., Nudelman E., Levery S. B., Hakomori S., Rauvala H. (1984) Novel fucolipids accumulating in human adenocarcinoma. III. A hybridoma antibody (FH6) defining a human cancer-associated difucoganglioside (VI3NeuAcV3III3Fuc2nLc6). J. Biol. Chem. 259, 10511–10517 [PubMed] [Google Scholar]
- 40. Nudelman E. D., Levery S. B., Stroud M. R., Salyan M. E., Abe K., Hakomori S. (1988) A novel tumor-associated, developmentally regulated glycolipid antigen defined by monoclonal antibody ACFH-18. J. Biol. Chem. 263, 13942–13951 [PubMed] [Google Scholar]
- 41. Stroud M. R., Handa K., Ito K., Salyan M. E. K., Fang H., Levery S. B., Hakamori S., Reinhold B. B., Reinhold V. N. (1995) Myeloglycan, a series of E-selectin-binding polylactosaminolipids found in normal human leukocytes and myelocytic leukemia HL60 cells. Biochem. Biophys. Res. Commun. 209, 777–787 [DOI] [PubMed] [Google Scholar]
- 42. Stroud M. R., Handa K., Salyan M. E. K., Ito K., Levery S. B., Hakomori S.-i., Reinhold B. B., Reinhold V. N. (1996) Monosialogangliosides of human myelogenous leukemia HL60 cells and normal human leukocytes. 2. Characterization of E-selectin binding fractions, and structural requirements for physiological binding to E-selectin. Biochemistry 35, 770–778 [DOI] [PubMed] [Google Scholar]
- 43. Ravindranath M. H., Muthugounder S., Presser N. (2008) Ganglioside signatures of primary and nodal metastatic melanoma cell lines from the same patient. Melanoma Res. 18, 47–55 [DOI] [PubMed] [Google Scholar]
- 44. Shen Y., Kohla G., Lrhorfi A. L., Sipos B., Kalthoff H., Gerwig G. J., Kamerling J. P., Schauer R., Tiralongo J. (2004) O-acetylation and de-O-acetylation of sialic acids in human colorectal carcinoma. Eur. J. Biochem. 271, 281–290 [DOI] [PubMed] [Google Scholar]
- 45. Corfield A., Myerscough N., Warren B., Durdey P., Paraskeva C., Schauer R. (1999) Reduction of sialic acid O-acetylation in human colonic mucins in the adenoma-carcinoma sequence. Glycoconjugate J. 16, 307–317 [DOI] [PubMed] [Google Scholar]
- 46. Robbe C., Capon C., Maes E., Rousset M., Zweibaum A., Zanetta J.-P., Michalski J.-C. (2003) Evidence of regio-specific glycosylation in human intestinal mucins: Presence of an acidic gradient along the intestinal tract. J. Biol. Chem. 278, 46337–46348 [DOI] [PubMed] [Google Scholar]
- 47. Kohla G., Stockfleth E., Schauer R. (2002) Gangliosides with O-acetylated sialic acids in tumors of neuroectodermal origin. Neurochem. Res. 27, 583–592 [DOI] [PubMed] [Google Scholar]
- 48. Vavasseur. F., Dole K., Yang J., Matta K. L., Myerscough N., Corfield A., Paraskeva C., Brockhausen I. (1994) O-glycan biosynthesis in human colorectal adenoma cells during progression to cancer. Eur. J. Biochem. 222, 415–424 [DOI] [PubMed] [Google Scholar]
- 49. Izawa M., Kumamoto K., Mitsuoka C., Kanamori A., Ohmori K., Ishida H., Nakamura S., Kurata-Miura K., Sasaki K., Nishi T., Kannagi R. (2000) Expression of sialyl 6-sulfo Lewis X is inversely correlated with conventional sialyl Lewis X expression in human colorectal cancer. Cancer Res. 60, 1410–1416 [PubMed] [Google Scholar]
- 50. Yusa A., Miyazaki K., Kimura N., Izawa M., Kannagi R. (2010) Epigenetic silencing of the sulfate transporter gene DTDST induces sialyl Lewis x expression and accelerates proliferation of colon cancer cells. Cancer Res. 70, 4064–4073 [DOI] [PubMed] [Google Scholar]
- 51. Tei K., Kawakami-Kimura N., Taguchi O., Kumamoto K., Higashiyama S., Taniguchi N., Toda K., Kawata R., Hisa Y., Kannagi R. (2002) Roles of cell adhesion molecules in tumor angiogenesis induced by cotransplantation of cancer and endothelial cells to nude rats. Cancer Res. 62, 6289–6296 [PubMed] [Google Scholar]
- 52. Chandrasekaran E. V., Xue J., Piskorz C., Locke R., Tóth K., Slocum H., Matta K. (2007) Potential tumor markers for human gastric cancer: an elevation of glycan:sulfotransferases and a concomitant loss of α1,2-fucosyltransferase activities. J. Cancer Res. Clin. Oncol. 133, 599–611 [DOI] [PubMed] [Google Scholar]
- 53. Siddiqui B., Whitehead J. S., Kim Y. S. (1978) Glycosphingolipids in human colonic adenocarcinoma. J. Biol. Chem. 253, 2168–2175 [PubMed] [Google Scholar]
- 54. Morichika H., Hamanaka Y., Tai T., Ishizuka I. (1996) Sulfatides as a predictive factor of lymph node metastasis in patients with colorectal adenocarcinoma. Cancer 78, 43–47 [DOI] [PubMed] [Google Scholar]
- 55. Shida K., Misonou Y., Korekane H., Seki Y., Noura S., Ohue M., Honke K., Miyamoto Y. (2009) Unusual accumulation of sulfated glycosphingolipids in colon cancer cells. Glycobiology 19, 1018–1033 [DOI] [PubMed] [Google Scholar]
- 56. Brockhausen I., Kuhns W. (1997) Role and metabolism of glycoconjugate sulfation. Trends Glycosci. Glycotechnol. 9, 379–398 [Google Scholar]
- 57. Ideo H., Seko A., Yamashita K. (2005) Galectin-4 binds to sulfated glycosphingolipids and carcinoembryonic antigen in patches on the cell surface of human colon adenocarcinoma cells. J. Biol. Chem. 280, 4730–4737 [DOI] [PubMed] [Google Scholar]
- 58. Kovbasnjuk O., Mourtazina R., Baibakov B., Wang T., Elowsky C., Choti M. A., Kane A., Donowitz M. (2005) The glycosphingolipid globotriaosylceramide in the metastatic transformation of colon cancer. Proc. Natl. Acad. Sci. U.S.A. 102, 19087–19092 [DOI] [PMC free article] [PubMed] [Google Scholar]
- 59. Lingwood C. A. (1999) Verotoxin/globotriaosyl ceramide recognition: Angiopathy, angiogenesis and antineoplasia. Biosci. Rep. 19, 345–354 [DOI] [PubMed] [Google Scholar]
- 60. Desselle A., Chaumette T., Gaugler M.-H., Cochonneau D., Fleurence J., Dubois N., Hulin P., Aubry J., Birklé S., Paris F., Addison C. L. (2012) Anti-Gb3 monoclonal antibody inhibits angiogenesis and tumor development. PLoS ONE 7, e45423. [DOI] [PMC free article] [PubMed] [Google Scholar]
- 61. Hakomori S. (1985) Aberrant glycosylation in cancer cell membranes as focused on glycolipids: overview and perspectives. Cancer Res. 45, 2405–2414 [PubMed] [Google Scholar]
- 62. Heimburg-Molinaro J., Lum M., Vijay G., Jain M., Almogren A., Rittenhouse-Olson K. (2011) Cancer vaccines and carbohydrate epitopes. Vaccine 29, 8802–8826 [DOI] [PMC free article] [PubMed] [Google Scholar]
- 63. Shibuya H., Hamamura K., Hotta H., Matsumoto Y., Nishida Y., Hattori H., Furukawa K., Ueda M., Furukawa K. (2012) Enhancement of malignant properties of human osteosarcoma cells with disialyl gangliosides GD2/GD3. Cancer Sci. 103, 1656–1664 [DOI] [PMC free article] [PubMed] [Google Scholar]
- 64. Furukawa K., Hamamura K., Ohkawa Y., Ohmi Y., Furukawa K. (2012) Disialyl gangliosides enhance tumor phenotypes with differential modalities. Glycoconjugate J. 29, 579–584 [DOI] [PubMed] [Google Scholar]
- 65. Nudelman E., Fukushi Y., Levery S. B., Higuchi T., Hakomori S. (1986) Novel fucolipids of human adenocarcinoma: disialosyl Lea antigen (III4FucIII6NeuAcIV3NeuAcLc4) of human colonic adenocarcinoma and the monoclonal antibody (FH7) defining this structure. J. Biol. Chem. 261, 5487–5495 [PubMed] [Google Scholar]
- 66. Miyazaki K., Ohmori K., Izawa M., Koike T., Kumamoto K., Furukawa K., Ando T., Kiso M., Yamaji T., Hashimoto Y., Suzuki A., Yoshida A., Takeuchi M., Kannagi R. (2004) Loss of disialyl Lewis a, the ligand for lymphocyte inhibitory receptor sialic acid-binding immunoglobulin-like lectin-7 (Siglec-7) associated with increased sialyl Lewis a expression on human colon cancers. Cancer Res. 64, 4498–4505 [DOI] [PubMed] [Google Scholar]
- 67. Tsuchida A., Okajima T., Furukawa K., Ando T., Ishida H., Yoshida A., Nakamura Y., Kannagi R., Kiso M., Furukawa K. (2003) Synthesis of Disialyl Lewis a (Lea) Structure in colon cancer cell lines by a sialyltransferase, ST6GalNAc VI, responsible for the synthesis of α-series gangliosides. J. Biol. Chem. 278, 22787–22794 [DOI] [PubMed] [Google Scholar]
Associated Data
This section collects any data citations, data availability statements, or supplementary materials included in this article.