Abstract
We evaluated the effects of feeding a ketogenic diet (KD) for a month on general physiology with emphasis on brown adipose tissue (BAT) in mice. KD did not reduce the caloric intake, or weight or lipid content of BAT. Relative epididymal fat pads were 40% greater in the mice fed the KD (P = 0.06) while leptin was lower (P < 0.05). Blood glucose levels were 30% lower while D-β-hydroxybutyrate levels were about 3.5-fold higher in the KD group. Plasma insulin and leptin levels in the KD group were about half of that of the mice fed NIH-31 pellets (chow group). Median mitochondrial size in the inter-scapular BAT (IBAT) of the KD group was about 60% greater, whereas the median lipid droplet size was about half of that in the chow group. Mitochondrial oxidative phosphorylation proteins were increased (1.5–3-fold) and the uncoupling protein 1 levels were increased by threefold in mice fed the KD. The levels of PPARγ, PGC-1α, and Sirt1 in KD group were 1.5–3-fold while level of Sirt3 was about half of that in the chow-fed group. IBAT cyclic AMP levels were 60% higher in the KD group and cAMP response element binding protein was 2.5-fold higher, suggesting increased sympathetic system activity. These results demonstrate that a KD can also increase BAT mitochondrial size and protein levels.
Keywords: adipose tissue, mitochondrial size, sympathetic activity, energy expenditure, obesity, blood ketones
Introduction
Obesity is caused due to an excess of energy intake over expenditure. Approaches to combat it have included targeting energy intake as well as the expenditure. Brown adipose tissue (BAT) has a role in the expenditure of energy in form of heat due to uncoupling of oxidation and phosphorylation by the uncoupling protein 1 (UCP1) which is specific to this tissue (1). Activation of BAT has been proposed to be an approach to combat obesity (2). With the relatively recent finding of the presence of BAT in humans (3,4), there is an interest in approaches to activate this tissue to increase basal energy expenditure to reduce weight gain.
A major portion of our understanding of BAT physiology comes from studies on cold exposure, hibernation, and arousal of rodents. These studies have identified that sympathetic nervous system activity is one of the primary regulators of BAT physiology (1). Cold exposure is associated with increased BAT amounts as well as UCP1 levels. Ultrastructural analyses of BAT from animals exposed to cold have shown increase in mitochondrial size (5). These changes are associated with increased energy expenditure. Dietary interventions that could increase BAT activity are desirable to facilitate weight loss. Previous studies in rats have shown that diets rich in long chain triglycerides (6,7) or medium chain triglycerides (8,9) can activate BAT through sympathetic stimulation of this tissue.
Ketogenic diets (KDs), which contain lots of fat and little carbohydrates, have been shown to induce UCP1 protein levels in the BAT of mice (10). Associated with this increase in UCP1 is an increase in the energy expenditure of mice on KDs. The effects of KD on BAT are not well understood. We have recently shown that a diet supplemented with ketone ester (KE), a dietary additive to elevate blood ketone levels, can cause increased BAT mitochondrial biogenesis and UCP1 levels (11). In this study, we investigated whether a high fat, low carbohydrate KD can increase mitochondrial proteins and UCP1 levels in BAT. We have also characterized the ultrastructural changes in the brown adipocytes and document the similarities and differences between KD and the KE diet.
Materials and Methods
Mice and Feeding
Eight-week-old male C57BL/6J mice were purchased from Jackson Laboratories (Bar Harbor, Maine, USA), and housed in temperature (21°C) and humidity (rh 70%)-controlled rooms with 12 H light: 12 H dark cycles. Animals were provided NIH-31 diet pellets ad lib and were acclimated to the facility for 4 days before starting the KD (Catalog number F3666, Bio-Serv, Frenchtown, NJ). The mice were trained to eat the KD for 3 days, by providing the diets in addition to the NIH pellets (chow), before switching over completely to the new diets. Control animals were continued on the chow diet. Fresh diets were provided every evening, <30 Min before the start of dark cycle. The food intake was measured daily and the body weight of animals was measured every third day. All experimental procedures were approved by the Animal Care and Use Committee of the National Institutes of Health. Steps were taken to minimize any suffering. As the KD was soft, both groups of animals were provided nylabones to ensure their teeth do not overgrow. Dietary treatment was continued for 1 month.
To measure blood glucose and ketones, blood was collected by nicking the tip of the tails. Precision-Xtra meter (Abbott Labs, Abbott Park, IL, USA) and corresponding glucose and ketone sticks were used which require <2 μL of blood for each measurement. There was at least 24 H difference between two sets of blood measurements from the same mouse. Terminal blood collection from heart puncture was conducted under deep anesthesia. Tissues were harvested post-mortem.
Measurements and Procedures
All procedures were conducted as previously described (11). At the end of the treatment period, the animals were anesthetized and blood collected in heparinized syringes after cardiac puncture and stored on ice. Plasma was obtained by centrifuging the blood within 30 Min of collection at 4,000 g for 10 Min at 4 °C. Animals were sacrificed by cervical dislocation and decapitation under anesthesia. Interscapular BAT (IBAT) and epididymal fat pad were dissected. The harvested BAT were either frozen in liquid nitrogen and stored at −80 °C till further analysis or put in fixatives for transmission electron microscopy (TEM) studies. For TEM of the IBATs, freshly isolated tissue pieces were cut into small pieces (~1–2 mm) and immersed in 0.1 M phosphate buffer containing 2% paraformaldehyde and 2.5% glutaraldehyde (fixing buffer). The fixing buffer was removed and replaced with fresh fixing buffer after 1 H and the tissues were postfixed for 24 H. Then, the fixing buffer was removed and the tissue washed in 0.1 M cacodylate buffer three times and stored in this buffer at 4 °C. TEM was conducted as previously described (11) and imaged in a Hitachi 7650 transmission electron microscope operating at 80 kV. Images were taken with an AMT digital camera.
Random, nonoverlapping images (~18 μm × 18 μm) were chosen for measurements with ImageJ (12). A total area of BAT cells (excluding blood vessels and extracellular areas) of 3,000 μm2 for KD and 4,500 μm2 for Chow has been used randomly divided into at least 10 equal areas. Size distributions of mitochondria were determined from the same images; size distributions of lipid droplets were determined from lower magnification images (~100 μm × 100 μm) of the same tissue areas.
Western Blotting
Frozen IBAT were weighed and lyzed by mincing and sonicating in 10 volumes (10 μL/mg) of ice-cold lysis buffer (20 mM HEPES pH 7.4, 100 mM NaCl, 1% Triton X-100, 1% sodium dodecyl sulfate, 1% sodium deoxycholate, 5 mM nicotinamide, and 10 mM sodium butyrate) containing protease and phosphatase inhibitor cocktails (Pierce Chemicals, Rockford, IL, USA). Following incubation on ice for 1 H, lysates were centrifuged at 10,000g for 15 Min at 4 °C and the clear portion of the supernatants was collected. Protein concentration in the lysates was measured by detergent compatible (DC) protein assay (Bio-Rad, Hercules, CA, USA). Equal protein amounts were run under denaturing conditions on Novex 4–20% Tris-Glycine gels (15 well × 1 mm) Tris-Glycine-SDS buffer and blotted onto 0.45 μm polyvinyl difluoride membranes (Immobilon-P, Millipore, Billerica, MA, USA) using Towbin transfer buffer (25 mM Tris, 192 mM glycine, 20% methanol, pH 8.3). After blocking the blots for 1 H at room temperature with 5% milk powder in Tris buffered saline with 0.1% Tween-20 (TBS-T), the membranes were washed with TBS-T and exposed to primary antibodies diluted in Superblock-TBS buffer (Pierce Chemicals). Membranes were incubated in primary antibodies overnight at 4 °C. After washing with TBS-T for 3 × 10 Min, blots were exposed to corresponding secondary antibodies in TBS-T for 1–2 H at room temperature, developed using Super-signal West Dura Substrate (Pierce Chemical), and imaged using VersaDoc imager (Bio-Rad). Five micrograms of protein was loaded onto each lane for determination of mitochondrial electron transport chain (ETC) proteins as well as UCP1, PPARγ, and PGC-1α. For all other proteins, 50 μg of protein was loaded onto each lane. Primary antibodies to cytochrome c (Cyt c), cytochrome c oxidase subunit IV, and cyclic AMP (cAMP) response element binding protein (CREB) were from Cell Signaling Technology (Danvers, MA). Antibodies to succinate dehydrogenase subunit A and PPARγ were from Abcam (Cambridge, MA, USA). Succinate dehydrogenase subunit B and NADH:ubiquinone oxidoreductase iron sulfur subunit 1 (Ndufs1) antibodies were from Santa Cruz Biotechnology (Santa Cruz, CA, USA). Antibodies to Sirt-1 and Sirt-3 were from Millipore (Bedford, MA). UCP-1 antibody was from Alpha Diagnostics (San Antonio, TX, USA), and the PGC-1α antibody was from Calbiochem/Millipore.
IBAT cAMP Measurement
A kit from Enzo Life Sciences/Assay Designs (Plymouth Meeting, PA) was used to measure IBAT cAMP as per manufacturer’s instructions. Briefly, the tissue was ground and lysed in 10 volumes of cold 0.1 M HCl. After homogenizing the tissue with a pestle, another 10 volumes of 0.1 M HCl was added and mixed. This was followed by a brief (20 Sec) centrifugation at 4 °C to settle debris. The supernatant was carefully decanted into a new tube and centrifuged again. The clear supernatant was diluted 2.5-fold with 0.1 M HCl to measure tissue cAMP levels, according to manufacturer instructions. Protein concentration was measured using DC protein assay.
18F FDG-PET Imaging and Biodistribution Study
After fasting for 4 H, mice were injected intraperitoneally with 3.7 MBq (100 μCi) of 18F-FDG (the Nuclear Pharmacy of Cardinal Health) and reconstituted with sterile saline. Mice were kept awake for 1 H at room temperature during the uptake period (13). Five-minute static PET scans were performed using an Inveon microPET scanner (Siemens Medical Solutions). The PET images were reconstructed using a two-dimensional ordered-subset expectation maximum algorithm without correction for attenuation and scatter.
Immediately after PET imaging, the mice were sacrificed, their IBAT dissected and weighed. The radioactivity in the wet IBAT was measured with a γ-counter (Wallach Wizard, PerkinElmer). The results were expressed as percentage of injected dose per gram of tissue (%ID/g) for a group of four mice. Values are expressed as mean ± SD (n = 4/group).
Data Analysis
Results are presented as means of n = 6 animals in each group ± standard error (s.e.), unless specified otherwise. Statistical analysis was conducted in Microsoft Excel using Students t-test to identify significant differences at P < 0.05.
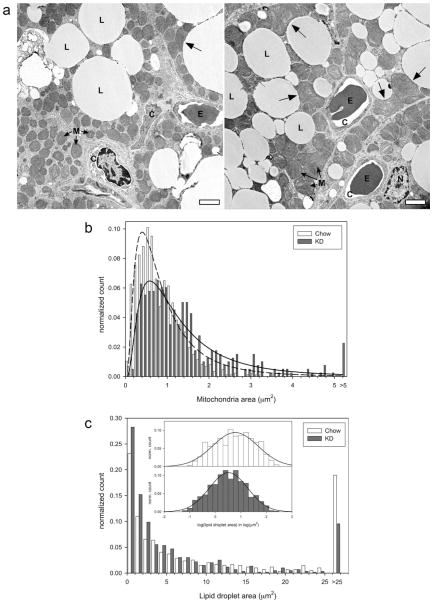
For the electron microscopy images, the lipid and mitochondrial size distributions were found to be skewed to the right (Figs. 3b and 3c). Therefore, logarithms of these data were taken, which were normally distributed. These log data were used in the t-test to identify significant differences.
FIG 3.
IBAT TEM images and size distributions of mitochondria and lipid droplets. (a) Representative TEM images of IBATs from the Chow group (left panel) and the KD group (right panel). L, lipid droplet, C, capillary, M, mitochondria, E, erythrocyte, and N, nucleus. Unlabeled arrows indicate location of large, odd-shaped mitochondria associated with lipid droplets. Scale bar = 2 μm. Note the larger mitochondria and more number of smaller lipid droplets in the KD sample. (b) Distribution of mitochondrial sizes, (c) distribution of lipid droplet sizes. Inset shows normal distribution curve fitted to the logarithm of the lipid droplet size data.
Results
Caloric Intake and Body Weight
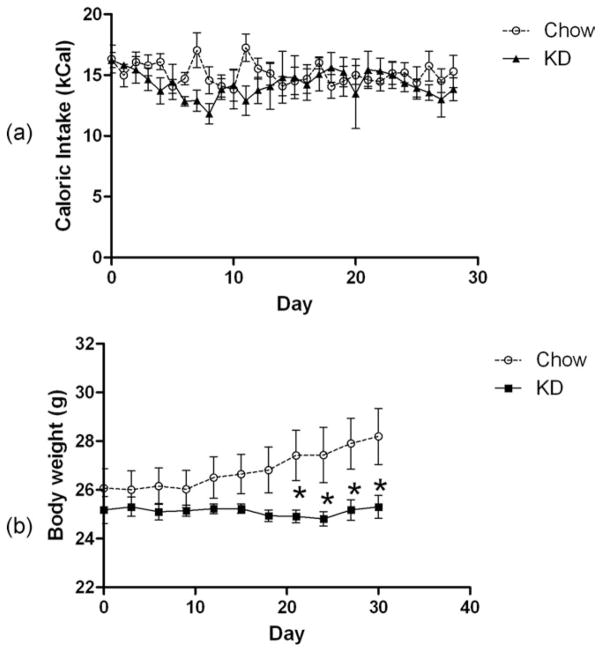
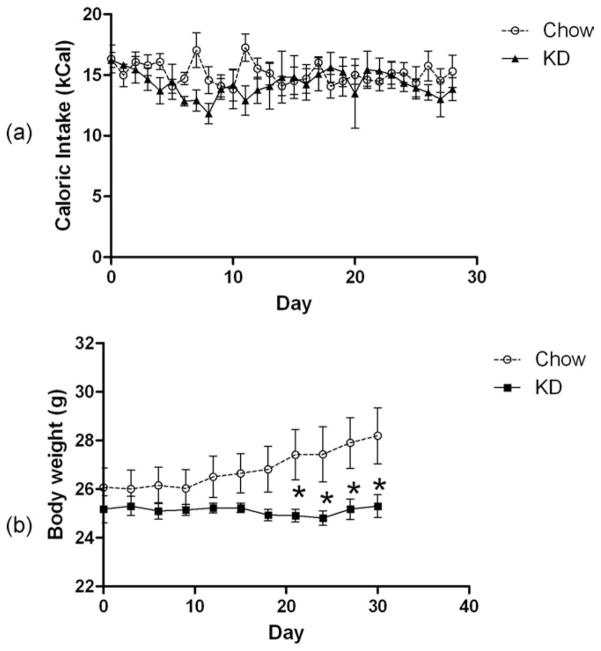
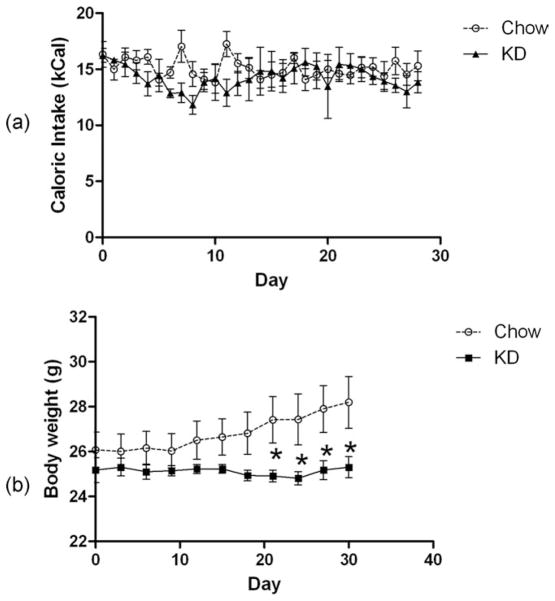
There was no difference in the caloric intake of the mice fed the ketogenic (KD) diet (Fig. 1a). However, unlike the chow-fed group, mice on the KD did not gain any weight (Fig. 1b). Consequently, the KD-fed mice weighed significantly less than the chow-fed group after about 3 weeks on the diet. These results of both caloric intake and body weight are in good agreement with previous studies (10,14).
FIG 1.
(a) Daily Caloric intake and (b) body weights of mice fed ad lib NIH-31 pellets or the KD.
Blood Ketones, Leptin, and Fat Tissue Weights
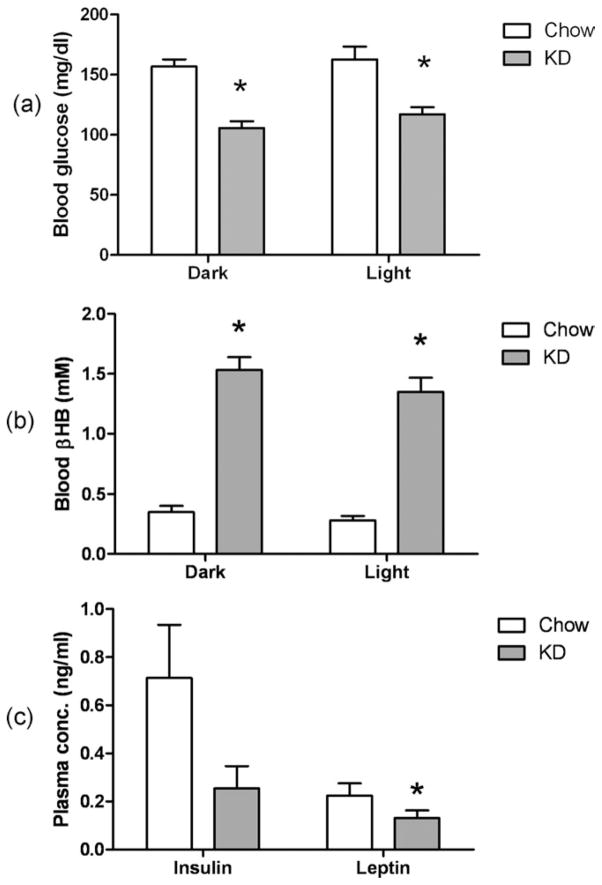
Blood glucose levels were significantly lower while the blood β-hydroxybutyrate (βHB) levels were significantly higher in the KD group compared to the chow group (Fig. 2a).
FIG 2.
(a) Blood glucose levels and (b) blood βHB levels in mice 4 H into dark or light phase. Data presented as mean ± s.e. of n = 6 mice. (c) Plasma insulin and leptin levels. Data presented as mean ± s.e. of n = 6 mice. * indicates significantly different (P < 0.05) from Chow group.
The insulin concentrations in the plasma for the KD group were lower, although not statistically significantly different, than the chow group (Fig. 2b). The leptin levels, however, were significantly lower than the chow group.
Although the absolute IBAT weights were not different between the groups, the relative (body-weight normalized) IBAT weights were greater in mice fed the KD (Table 2). The relative epididymal white adipose tissue (eWAT) from mice on the KD was larger (P ~ 0.06) than eWAT from the chow-fed controls (Table 1).
TABLE 2.
Fat pad weights, absolute (in mg) and as a percent of total body weight
| Treatment | IBAT (mg) | IBAT (%) | eWAT (mg) | eWAT (%) |
|---|---|---|---|---|
| Chow | 121 ± 7 | 0.43 ± 0.02 | 539 ± 89 | 1.86 ± 0.26 |
| KD | 139 ± 10 | 0.55 ± 0.03* | 665 ± 80 | 2.61 ± 0.26 |
P < 0.05.
IBAT: interscapular brown adipose tissue; eWAT: epididymal white adipose tissue.
TABLE 1.
Average daily caloric intake as a fraction of macronutrients in mice on the two diets
| Chow | KG | |
|---|---|---|
| Protein | 3.59 | 0.75 |
| Fat | 2.10 | 13.14 |
| Carbohydrate | 9.28 | 0.15 |
| Total | 14.97 | 14.04 |
TEM Analysis
TEM analysis showed that the brown adipocytes from mice treated with KD had bigger mitochondria than the brown adipocytes from the chow group (Fig. 3a). Interestingly, while the smaller mitochondria were smooth and oval, the bigger mitochondria had odd shapes (Fig. 3a, arrows). This was much more pronounced in mitochondria in the KD sample and was especially striking for the mitochondria that were closer to lipid droplets. The distribution of mitochondrial sizes in the two groups is provided in Fig. 3b. The median mitochondrial size of the KD group was about 60% greater than that of the chow group (1.07 μm2 in the KD group vs. 0.67 μm2 in the chow group, Table 3, P < 0.05). Additionally, the fraction of mitochondria in the non-nucleus/non-lipid area was significantly greater in the KD group (68.2% ± 7.1% in the KD group vs. 41.7% ± 4.7% in the chow group), although the mitochondrial content as a percent of cellular area was not different (Tables 2 and 3). The brown adipocytes from the KD group contained a greater number of smaller lipid droplets (Fig. 3c), with median lipid droplet size being about half of that in the chow group (2.54 μm2 in the KD group vs. 4.86 μm2 in the chow group, P<0.05, Table 3). However, the number of lipid droplets per unit area was significantly greater in the IBAT from the KD group (Table 3). There was no difference in the lipid content of brown adipocyte in the two groups.
TABLE 3.
Summary of electron microscopy analyses of BAT
| Chow | KD | |
|---|---|---|
| Mitochondria | ||
| Number (μm2) | 0.19 ± 0.01 | 0.13 ± 0.01* |
| Size (μm2) | * | |
| 1 quartile | 0.42 | 0.66 |
| Median | 0.67 | 1.07 |
| 3 quartile | 1.09 | 1.71 |
| % Area per cell | 15 ± 4 | 20 ± 11 |
| % Cytosol areaa | 42 ± 5 | 68 ± 7* |
| Lipid | ||
| Number of droplets/μm2 | 0.038 | 0.071 |
| Droplet size (μm2) | * | |
| 1 quartile | 1.12 | 0.82 |
| Median | 4.86 | 2.54 |
| 3 quartile | 17.83 | 8.04 |
| % Area per cell | 70 ± 15 | 61 ± 8 |
Cytosol was defined as (cellular area—nuclear area—lipid area).
P < 0.05. The number of mitochondria per μm2 was significantly less while the mitochondria size as well as mitochondria as a percent of cytosolic area was significantly greater in the KD group compared to the chow group. The number of lipid droplets was significantly greater while the size of the lipid droplets was significantly less in the BAT from the KD group.
Changes in IBAT Mitochondrial ETC Protein Levels and UCPs
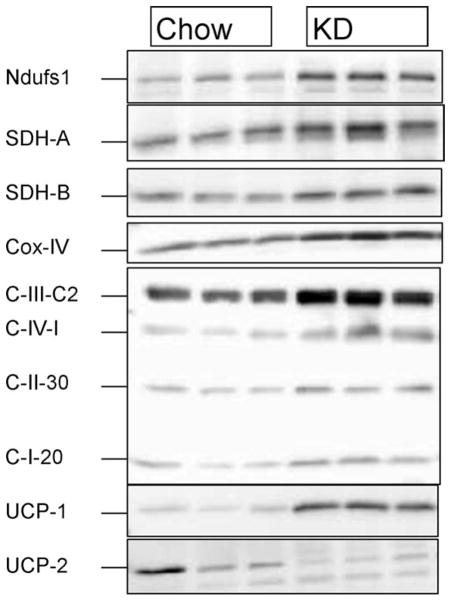
In agreement with the electron microscopy, the IBAT from the mice fed KD had significantly increased mitochondrial ETC proteins compared to chow, as determined by Western blotting (Fig. 4). Additionally, the levels of BAT-specific uncoupling protein (UCP1) were also about twofold greater than that in controls. The levels of UCP2, however, were significantly reduced in the IBATs of KD-treated mice.
FIG 4.
Changes in the levels of mitochondrial proteins. (a) The levels of various mitochondrial proteins were measured by Western blotting, and (b) corresponding densitometric analyses. First three lanes correspond to the Chow group and the last three lanes correspond to the KD group. Ndufs1, NADH dehydrogenase (Complex 1) 70 kDa iron–sulfur subunit 1; SDHa, succinate dehydrogenase (Complex 2) 70 kDa subunit A; SDHb, succinate dehydrogenase (Complex 2) 30 kDa subunit B; Cyt c, Cytochrome c; Cox IV, Cytochrome c oxidase subunit IV; C-III-Core, complex III core protein; C-IV-1, complex IV subunit I; C-I-20, complex I 20 kDa subunit protein (NDUFB8); UCP1 and UCP2. * Indicates significantly different (P < 0.05) from the Chow group.
Changes in Mitochondrial Biogenesis-Related Proteins in IBAT
Mice on the KD had significantly elevated levels of a variety of proteins that have been suggested to be involved in mitochondrial biogenesis (Fig. 5). This included PPARγ and its coactivator PGC-1α and Sirt1. However, the levels of another putative mitochondrial biogenesis regulator in BAT, Sirt3, were significantly reduced in the IBAT of KD-fed animals.
FIG 5.
Western Blots for mitochondrial biogenesis related proteins—PPARγ, PGC-1α, Sirt-1, and Sirt-3. First three lanes correspond to the Chow group and the last three lanes correspond to the KD group. * Indicates significantly different (P < 0.05) from the Chow group.
Effect on IBAT cAMP and CREB Levels
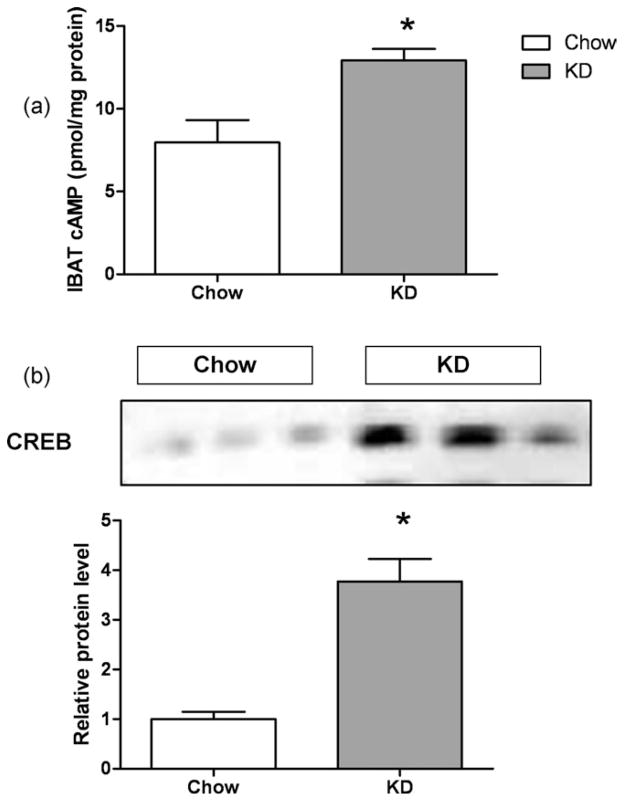
The IBAT from mice fed the KD had significantly elevated cAMP levels (Fig. 6a), suggesting increased sympathetic stimulation of IBAT. Elevated cAMP activates the transcription factor CREB, which has been shown to regulate a variety of genes including UCP1 (15), cytochrome c (16), and PGC-1α (17). Mice on the KD had about twofold increase in CREB (Fig. 6b).
FIG 6.
IBAT cAMP and CREB levels. (a) cAMP levels in IBAT, (b) cAMP response element binding protein (CREB) levels in IBAT measured by Western Blot and corresponding densitometric analysis. * Indicates significantly different (P < 0.05) from the Chow group.
Positron Emission Spectroscopy (PET) Imaging of 18Fluorodeoxyglucose (FDG) Uptake
Mice on the KD had significantly reduced uptake of 18F-FDG in the IBAT (Fig. 7a). Quantification of the 18F-FDG uptake in excised IBATs with γ-counter showed that the 18F-FDG uptake in IBAT of the KD group was about half of the chow group (Fig. 7b).
FIG 7.
(a) 18F-fluoro-deoxyglucose positron emission tomography (18F-FDG-PET) imaging of glucose uptake after 3 weeks on diet. (b) Ex vivo quantification of FDG uptake in the BAT expressed as %ID/g. Data presented as mean ± SD of n = 4 mice in each group. *, P < 0.05.
Discussion
Because of the beneficial effects of KDs in a variety of metabolic and neurological disorders, their use is on the rise. Here, we show that a high fat KD was associated with larger mitochondria, and increased levels of mitochondrial proteins and UCP1 in the BAT. There was a decrease in the number of mitochondria per unit area, suggesting that the KD stimulated fusion of mitochondria. Unlike mitochondrial swelling that results in diminished mitochondrial cristae density and increased matrix, the mitochondrial cristae and matrix appeared similar to the chow group. Also, the increased energy expenditure on the KD, which has been reported in several studies, suggests that mitochondrial function is intact.
The brown adipocytes from the KD group also contained greater number of smaller lipid droplets even though the total lipid amount in the BAT was not different. More numerous, smaller droplets also mean larger available surface area for faster lipolysis. The increased cAMP levels in the tissue suggested a role for increased sympathetic stimulation of the tissue, which would cause increased lipolysis and agree with the smaller droplets observed.
Despite not gaining any weight on the KD, the mice had greater relative amounts of epididymal fat pads. The increased relative WAT in the face of increased BAT size, mitochondrial proteins, and UCP1 seems somewhat of a contradiction. Additionally, KD-treated mice had reduced plasma leptin levels, in agreement with the results of Kennedy et al. (10). Thus, the KD reduces the leptin secretion per unit mass of the adipose tissue. However, despite the reduced circulating leptin levels, the mice were not hyperphagic, suggesting increased leptin sensitivity (18) or changes in the levels of other appetite-regulating hormones. KD has also been shown to improve glucose tolerance in ob/ob mice (19), indicating that the beneficial effect of KD on glucose metabolism do not need leptin. Although leptin has previously been shown to regulate BAT physiology (1,20,21), the changes in BAT in response to KD seem not to be mediated through leptin.
Mice on the KD had significantly reduced uptake of 18F-FDG in their BAT. This result is in agreement with a previous study by Jornayvaz et al. (14) which found significantly reduced labeled glucose uptake during hyperinsulinemic euglycemic clamp in BAT of mice fed the KD. These results suggest that the KD causes insulin resistance in this tissue, although the mechanism is unclear. That the BAT in mice on KD is active is indicated by reduced body weight as well as increased energy expenditure with KD reported in many previous studies (10,14,19). It must be pointed out that the reduced glucose uptake by BAT is not likely due to elevated ketone levels because in our previous study with KE (11), where we achieved much greater circulating ketone levels than the KD, the FDG uptake was significantly elevated.
The KD increased markers of sympathetic activity (cAMP and CREB levels) in the BAT of the mice. Whether or not there was a generalized increase in the sympathetic nervous system activity to other tissues was not investigated as the focus of this work was to characterize changes in brown fat. Reports on the effect of ketone bodies on sympathetic activity have been divergent, one study demonstrated reduced heart rate in the presence of β-hydroxybutyrate (22), while other showed increased norepinephrine turnover in BAT of mice treated with b-hydroxybutyrate (23). It is likely that the sympathetic activity in response to KD is organ-specific and not generalized. It will be of interest to evaluate the effect of KD on parameters of sympathetic nervous system activity in other tissues, for example, heart rate and blood pressure.
There were many similarities between the KE diet and KD on their effect on BAT. Both diets increased mitochondrial size, mitochondrial proteins, and UCP1, mediated through increased tissue cAMP levels indicating increased sympathetic stimulation to this tissue. Yet there were some important differences between the two diets (Table 4). Although the KE diet depressed caloric intake, the KD did not. Importantly, the effect of the two ketone-elevating diets was opposite for IBAT weight and FDG uptake. KD has been shown to increase whole body fat levels, reduce lean body mass, and cause hepatic insulin resistance despite reducing overall weight gain (14). The KE diet did not increase body fat as measured by epididymal fat pad weights and increased mitochondrial proteins in IBAT as well as glucose intake by IBAT. The KE diet increased plasma leptin levels relative to pair-fed controls, while the KD reduced it. Increased Sirt3 has been shown to increase mitochondrial biogenesis in brown adipocytes (24). KD also caused a reduction in Sirt3 levels in the IBAT (this study), while KE diet had no effect (11). These results indicate that the increase in mitochondrial size and proteins by the ketone-elevating diets is not mediated through increased Sirt3. The reduction in Sirt3 with a high fat KD is in agreement with a previous study which found reduced Sirt3 in muscle cells of animals on high fat diet (25). Another important difference between the KE diet and the KD on BAT involved lipid content of the tissue. Although the KE led to significant reduction in the lipid content and the weight of the BAT, the KD did not reduce either. The difference could be due to the higher lipid content of and greater caloric intake on the KD.
TABLE 4.
Comparison of the effects of KD and KE diets
| Effect | KD | KE diet |
|---|---|---|
| Caloric intake | – | ↓ |
| Body weighta | ↓ | – |
| Plasma Leptina | ↓ | ↑ |
| Relative IBAT weight | ↑ | ↓ |
| IBAT lipid content | – | ↓ |
| IBAT Sirt3 | ↓ | – |
| IBAT glucose uptake | ↓ | ↑ |
Body weights and circulating leptin are compared to equicaloric controls consuming carbohydrate-rich diet.
Therefore, our results show novel effects of KD on BAT physiology and metabolism. This study, along with our previous study on the KE diet, indicates that BAT is a ketone body responsive tissue, increasing its mitochondrial protein content in response to increased circulating ketone bodies. Previous studies in humans using KD have shown a reduction in body weight on this diet (26–30). It is possible that the reduction seen is related to increased energy expenditure that may be partly mediated by the BAT activation.
Acknowledgments
We would like to thank Dr. Yoshihiro Kashiwaya and Mr. Calvin Crutchfield for assistance with experimental procedures, Dr. Pal Pacher of NIAAA/NIH for access to the imager for developing the Western blots, and Anne Kamata for help with electron microscopy. The content of this publication does not necessarily reflect the views or policies of the Department ofHealth and Human Services nor does mentioning of trade names, commercial products, or organizations implies endorsement of the U.S. Government.
References
- 1.Cannon B, Nedergaard J. Brown adipose tissue: function and physiological significance. Physiol Rev. 2004;84:277–359. doi: 10.1152/physrev.00015.2003. [DOI] [PubMed] [Google Scholar]
- 2.Cypess AM, Kahn CR. Brown fat as a therapy for obesity and diabetes. Curr Opin Endocrinol Diabetes Obes. 2010;17:143–149. doi: 10.1097/MED.0b013e328337a81f. [DOI] [PMC free article] [PubMed] [Google Scholar]
- 3.Cypess AM, Lehman S, Williams G, Tal I, Rodman D, et al. Identification and importance of brown adipose tissue in adult humans. N Engl J Med. 2009;360:1509–1517. doi: 10.1056/NEJMoa0810780. [DOI] [PMC free article] [PubMed] [Google Scholar]
- 4.Saito M, Okamatsu-Ogura Y, Matsushita M, Watanabe K, Yoneshiro T, et al. High incidence of metabolically active brown adipose tissue in healthy adult humans: effects of cold exposure and adiposity. Diabetes. 2009;58:1526–1531. doi: 10.2337/db09-0530. [DOI] [PMC free article] [PubMed] [Google Scholar]
- 5.Grodums EI. Ultrastructural changes in the mitochondria of brown adipose cells during the hibernation cycle of Citellus lateralis. Cell Tissue Res. 1977;185:231–237. doi: 10.1007/BF00220667. [DOI] [PubMed] [Google Scholar]
- 6.Rothwell NJ, Stock MJ, Tyzbir RS. Energy balance and mitochondrial function in liver and brown fat of rats fed “cafeteria” diets of varying protein content. J Nutr. 1982;112:1663–1672. doi: 10.1093/jn/112.9.1663. [DOI] [PubMed] [Google Scholar]
- 7.Rothwell NJ, Stock MJ, Warwick BP. Energy balance and brown fat activity in rats fed cafeteria diets or high-fat, semisynthetic diets at several levels of intake. Metabolism. 1985;34:474–480. doi: 10.1016/0026-0495(85)90214-8. [DOI] [PubMed] [Google Scholar]
- 8.Rothwell NJ, Stock MJ. Stimulation of thermogenesis and brown fat activity in rats fed medium chain triglyceride. Metabolism. 1987;36:128–130. doi: 10.1016/0026-0495(87)90005-9. [DOI] [PubMed] [Google Scholar]
- 9.Baba N, Bracco EF, Hashim SA. Role of brown adipose tissue in thermogenesis induced by overfeeding a diet containing medium chain triglyceride. Lipids. 1987;22:442–444. doi: 10.1007/BF02537276. [DOI] [PubMed] [Google Scholar]
- 10.Kennedy AR, Pissios P, Otu H, Roberson R, Xue B, et al. A high-fat, ketogenic diet induces a unique metabolic state in mice. Am J Physiol Endocrinol Metab. 2007;292:E1724–1739. doi: 10.1152/ajpendo.00717.2006. [DOI] [PubMed] [Google Scholar]
- 11.Srivastava S, Kashiwaya Y, King MT, Baxa U, Tam J, et al. Mitochondrial biogenesis and increased uncoupling protein 1 in brown adipose tissue of mice fed a ketone ester diet. FASEB J. 2012;26:2351–2362. doi: 10.1096/fj.11-200410. [DOI] [PMC free article] [PubMed] [Google Scholar]
- 12.Abramoff MD, Magalhaes PJ, Ram SJ. Image processing with ImageJ. Biophoton Int. 2004;11:36–42. [Google Scholar]
- 13.Fueger BJ, Czernin J, Hildebrandt I, Tran C, Halpern BS, et al. Impact of animal handling on the results of 18F-FDG PET studies in mice. J Nucl Med. 2006;47:999–1006. [PubMed] [Google Scholar]
- 14.Jornayvaz FR, Jurczak MJ, Lee HY, Birkenfeld AL, Frederick DW, et al. A high-fat, ketogenic diet causes hepatic insulin resistance in mice, despite increasing energy expenditure and preventing weight gain. Am J Physiol Endocrinol Metab. 2010;299:E808–815. doi: 10.1152/ajpendo.00361.2010. [DOI] [PMC free article] [PubMed] [Google Scholar]
- 15.Rim JS, Kozak LP. Regulatory motifs for CREB-binding protein and Nfe2l2 transcription factors in the upstream enhancer of the mitochondrial uncoupling protein 1 gene. J Biol Chem. 2002;277:34589–34600. doi: 10.1074/jbc.M108866200. [DOI] [PubMed] [Google Scholar]
- 16.Vercauteren K, Pasko RA, Gleyzer N, Marino VM, Scarpulla RC. PGC-1-related coactivator: immediate early expression and characterization of a CREB/NRF-1 binding domain associated with cytochrome c promoter occupancy and respiratory growth. Mol Cell Biol. 2006;26:7409–7419. doi: 10.1128/MCB.00585-06. [DOI] [PMC free article] [PubMed] [Google Scholar]
- 17.Wu Z, Huang X, Feng Y, Handschin C, Gullicksen PS, et al. Transducer of regulated CREB-binding proteins (TORCs) induce PGC-1alpha transcription and mitochondrial biogenesis in muscle cells. Proc Natl Acad Sci USA. 2006;103:14379–14384. doi: 10.1073/pnas.0606714103. [DOI] [PMC free article] [PubMed] [Google Scholar]
- 18.Kinzig KP, Honors MA, Hargrave SL, Davenport BM, Strader AD, et al. Sensitivity to the anorectic effects of leptin is retained in rats maintained on a ketogenic diet despite increased adiposity. Neuroendocrinology. 2010;92:100–111. doi: 10.1159/000314180. [DOI] [PMC free article] [PubMed] [Google Scholar]
- 19.Badman MK, Kennedy AR, Adams AC, Pissios P, Maratos-Flier E. A very low carbohydrate ketogenic diet improves glucose tolerance in ob/ob mice independently of weight loss. Am J Physiol Endocrinol Metab. 2009;297:E1197–1204. doi: 10.1152/ajpendo.00357.2009. [DOI] [PMC free article] [PubMed] [Google Scholar]
- 20.Commins SP, Watson PM, Levin N, Beiler RJ, Gettys TW. Central leptin regulates the UCP1 and ob genes in brown and white adipose tissue via different beta-adrenoceptor subtypes. J Biol Chem. 2000;275:33059–33067. doi: 10.1074/jbc.M006328200. [DOI] [PubMed] [Google Scholar]
- 21.Scarpace PJ, Matheny M. Leptin induction of UCP1 gene expression is dependent on sympathetic innervation. Am J Physiol. 1998;275:E259–264. doi: 10.1152/ajpendo.1998.275.2.E259. [DOI] [PubMed] [Google Scholar]
- 22.Kimura I, Inoue D, Maeda T, Hara T, Ichimura A, et al. Short-chain fatty acids and ketones directly regulate sympathetic nervous system via G protein-coupled receptor 41 (GPR41) Proc Natl Acad Sci USA. 2011;108:8030–8035. doi: 10.1073/pnas.1016088108. [DOI] [PMC free article] [PubMed] [Google Scholar]
- 23.Kolanowski J, Young JB, Landsberg L. Stimulatory influence of D(−)3-hydroxybutyrate feeding on sympathetic nervous system activity in the rat. Metabolism. 1994;43:180–185. doi: 10.1016/0026-0495(94)90242-9. [DOI] [PubMed] [Google Scholar]
- 24.Shi T, Wang F, Stieren E, Tong Q. SIRT3, a mitochondrial sirtuin deacetylase, regulates mitochondrial function and thermogenesis in brown adipocytes. J Biol Chem. 2005;280:13560–13567. doi: 10.1074/jbc.M414670200. [DOI] [PubMed] [Google Scholar]
- 25.Palacios OM, Carmona JJ, Michan S, Chen KY, Manabe Y, et al. Diet and exercise signals regulate SIRT3 and activate AMPK and PGC-1alpha in skeletal muscle. Aging (Albany NY) 2009;1:771–783. doi: 10.18632/aging.100075. [DOI] [PMC free article] [PubMed] [Google Scholar]
- 26.Al-Khalifa A, Mathew TC, Al-Zaid NS, Mathew E, Dashti HM. Therapeutic role of low-carbohydrate ketogenic diet in diabetes. Nutrition. 2009;25:1177–1185. doi: 10.1016/j.nut.2009.04.004. [DOI] [PubMed] [Google Scholar]
- 27.Dashti HM, Mathew TC, Khadada M, Al-Mousawi M, Talib H, et al. Beneficial effects of ketogenic diet in obese diabetic subjects. Mol Cell Biochem. 2007;302:249–256. doi: 10.1007/s11010-007-9448-z. [DOI] [PubMed] [Google Scholar]
- 28.Kim DW, Kang HC, Park JC, Kim HD. Benefits of the nonfasting ketogenic diet compared with the initial fasting ketogenic diet. Pediatrics. 2004;114:1627–1630. doi: 10.1542/peds.2004-1001. [DOI] [PubMed] [Google Scholar]
- 29.Westman EC, Yancy WS, Jr, Mavropoulos JC, Marquart M, McDuffie JR. The effect of a low-carbohydrate, ketogenic diet versus a low-glycemic index diet on glycemic control in type 2 diabetes mellitus. Nutr Metab (Lond) 2008;5:36–44. doi: 10.1186/1743-7075-5-36. [DOI] [PMC free article] [PubMed] [Google Scholar]
- 30.Yancy WS, Jr, Foy M, Chalecki AM, Vernon MC, Westman EC. A low-carbohydrate, ketogenic diet to treat type 2 diabetes. Nutr Metab (Lond) 2005;2:34–40. doi: 10.1186/1743-7075-2-34. [DOI] [PMC free article] [PubMed] [Google Scholar]


