Abstract
Accurate determination of potential ligand binding sites (BS) is a key step for protein function characterization and structure-based drug design. Despite promising results of template-based BS prediction methods using global structure alignment (GSA), there is a room to improve the performance by properly incorporating local structure alignment (LSA) because BS are local structures and often similar for proteins with dissimilar global folds. We present a template-based ligand BS prediction method using G-LoSA, our LSA tool. A large benchmark set validation shows that G-LoSA predicts drug-like ligands’ positions in single-chain protein targets more precisely than TM-align, a GSA-based method, while the overall success rate of TM-align is better. G-LoSA is particularly efficient for accurate detection of local structures conserved across proteins with diverse global topologies. Recognizing the performance complementarity of G-LoSA to TM-align and a non-template geometry-based method, fpocket, a robust consensus scoring method, CMCS-BSP (Complementary Methods and Consensus Scoring for ligand Binding Site Prediction), is developed and shows improvement on prediction accuracy. The G-LoSA source code is freely available at http://im.bioinformatics.ku.edu/GLoSA.
Keywords: template-based method, G-LoSA, global structure alignment, pocket shape, computer-aided drug design
INTRODUCION
An increasing number of protein structures are available through advanced high-throughput techniques prior to their biological and functional characterization.1 Accurate identification of ligand binding sites (BS) in a protein is a key step not only for structure-based drug design in that BS are the actual core structure determining drug affinity and selectivity,2 but also for protein function prediction by a structural similarity comparison between binding pockets.3 Although experimental characterization provides the most accurate BS assignment, such procedure is time-, cost- and labor-intensive. Therefore, computational BS prediction has become an alternative approach.
The computational approaches are roughly classified into sequence- and structure-based methods. The sequence-based approaches are mainly based on the presumption that BS-residues are functionally essential and thus preferentially conserved during the evolution.4, 5 In many cases, however, the conserved residues are not only involved in ligand binding, but also play important roles in global topology, specific functional dynamics, or binding interfaces with other macromolecules. Therefore, structure-based approaches are a method of choice if the structure of a target protein is available.
Structure-based approaches can be categorized into geometry-, energy-, and template-based methods, although some methods utilize multiple principles, including the sequence-based approach. Geometry-based methods, such as POCKET,6 Surfnet,7 LigSite,8 CAST,9 ConCavity,10 fpocket,11 predict ligand BS mainly based on protein geometry using various cavity/cleft detection techniques. On the other hand, energy-based methods, such as GRID,12 ICM-PocketFinder,13 Q-SiteFinder,14 estimate druggability of the pockets based on the interaction energy of probe molecules with a protein.
With a rapid increase in the number of protein-ligand complex structures in the Protein Data Bank (PDB, http://www.rcsb.org),15 it has been possible to gain insights into ligand BS from the known PDB holo-structures (structure templates) that are structurally homologous to a target protein. Underlying hypothesis in template-based methods is that proteins with similar global structure have similar function, and hence they may bind similar ligands at similar BS. FINDSITE predicts ligand BS in a target protein from ligands in holo-protein templates detected by threading methods.16 In BSP-SLIM,17 which is a blind-docking method for predicted protein models, positions for ligand docking are chosen on the basis of ligands in holo-structure templates detected by a global structure similarity. Benchmark studies and CASP (Critical Assessment of protein Structure Prediction) competition results have demonstrated that the template-based methods yield consistent, reliable performances, compared to other category methods, though there are limitations in their applications to novel proteins without prior protein/ligand structures.16, 18, 19
It is well known that ligand BS can have similar shape and physicochemical properties even though their proteins are dissimilar in global folds.20, 21 This necessitates utilization of local structure alignment (LSA) in combination with global structure alignment (GSA) to accurately identify proper structure templates. COFACTOR is the first template-based method combining both GSA and LSA.22 In this method, a set of template holo-structures to a target protein is first identified by global structure similarity search. The initial local alignment between the target and the template proteins is then conducted on the basis of conserved residues between the target protein and the BS-residues of the template proteins. The initial superposition is refined by a heuristic procedure using Needleman-Wunsch dynamic programming.23 The performance evaluation shows that COFACTOR predicts ligand BS more accurately than FINDSITE and ConCavity (a geometry-based method utilizing evolutionary sequence conservation).22
However, aligning local structures, such as ligand BS, is challenging because BS-residues are often spatially arranged regardless of the residue order and thus the alignment quality should not be dependent on the sequence continuity. A handful of sequence continuity-independent LSA methods have been reported. SiteEngine24 and SitesBase25 are based on geometric hashing using efficient hashing and matching of triads of representative points on the protein surfaces. Cavbase,26 the method by Park and Kim,27 and ProBiS28 adopt maximum clique search, where maximum common subgraphs are detected from the protein structures represented as graphs. However, they were usually developed to compare BS or to detect functional relationships. Although ProBiS was applied for detection of ligand BS, no result on large benchmark set validation is reported.
Here, we introduce a template-based ligand BS prediction method using our LSA tool, G-LoSA (Graph-based Local Structure Alignment),29 and present the large benchmark set validation results. We systematically compare the performances of LSA using G-LoSA to GSA using TM-align and a non-template geometry-based method using fpocket. By recognizing performance complementarity of each method adopting different principles for BS detection, a new consensus scoring method, CMCS-BSP (Complementary Methods and Consensus Scoring for ligand Binding Site Prediction), is developed to maximally improve prediction accuracy by integrating multiple BS prediction methods.
MATERIALS AND METHODS
Preparation of BS/ligand structure library
A structure library consisting of BS/ligand structure pairs was prepared using the PDB X-ray and NMR structures containing at least one protein and one ligand. The details of the library preparation are described in Supporting Information Section S1.
Benchmark set
The benchmark set contains 406 single-chain ligands (SET-S) and 83 multi-chain ligands (SET-M); a single-chain ligand is in the BS in a single-chain protein and a multi-chain ligand is in the BS at the interface of multiple protein chains. They were collected from the ligAsite benchmark set30 and additional reference sets by Hartshorn et al.31 and Perola et al.32 Interacting residues with a ligand were defined using a 4 Å distance cutoff between ligand and protein heavy atoms.
A smaller number of proteins were separately prepared as a training set to derive the consensus scoring functions. These training benchmark proteins were taken from the Astex diverse set31 and also divided into tSET-S (75 single-chain ligands) and tSET-M (10 multi-chain ligands). Since the number of tSET-M was too small as a training set, we randomly selected additional 10 targets from SET-M and added them to tSET-M.
Template-based ligand BS prediction using local structure alignment
We used G-LoSA29 for the LSA-based ligand BS prediction. In G-LoSA, a given pair of structures is superposed using the aligned residue pairs in a maximum clique identified from the product graph of the structures (see the algorithm details in Supporting Information Section S2).
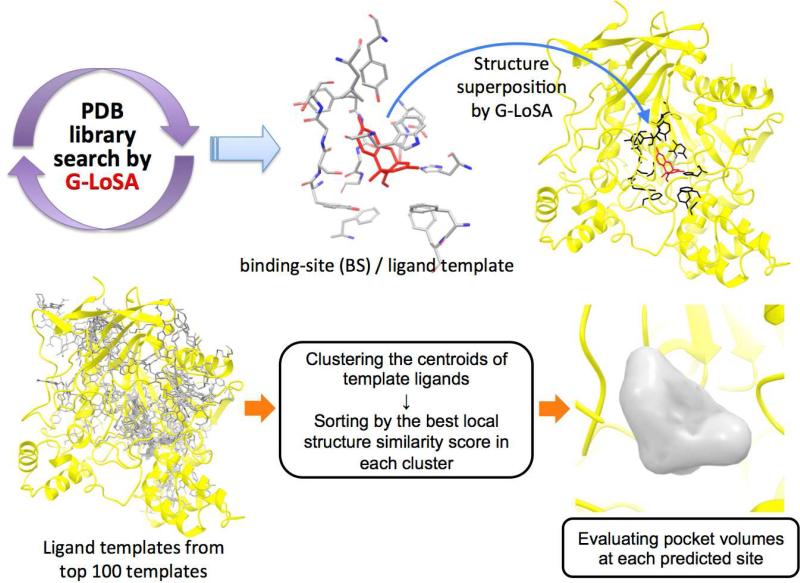
Figure 1 shows the overall procedure of ligand BS prediction by G-LoSA. First, each library BS-structure is superposed onto the whole structure of a target protein by G-LoSA (Supplementary Figure S1), and the similarity score (SG-LoSA) is measured by the superposed structures. 100 BS/ligand templates are then identified in terms of SG-LoSA,
| (1) |
where N is the number of aligned residues. The RMSD is the root-mean-squared deviation of the aligned residue pairs and calculated using the coordinates of Cα atoms and side-chain centroids. To put strict conditions on the library BS/ligand search in this study, we excluded all homologous library proteins whose sequence identity is > 30% to the benchmark target protein.
Figure 1.
Overall procedure to predict ligand BS using G-LoSA.
After entire library search, the scores of the selected 100 templates were Z-transformed using the mean (μ) and standard deviation (σ) of all the library scores to reduce the dependence of SG-LoSA by the number of BS-residues:
| (2) |
where is SZ,G-LoSA between the target and the ith template.
Template ligands, mapped onto the target protein by superposition of the template BS-structures onto the target protein, were clustered by the spatial proximity between their centroids. An average linkage clustering procedure was employed with a cutoff distance of 3 Å. All the clusters were ranked by the best SZ,G-LoSA of each cluster and a predicted BS was determined by the center of all the template ligand's centroids in a cluster.
Template-based methods occasionally provide the predictions within the regions that are geometrically unfavorable for ligand binding (with too small pocket volume). To discard such pockets, we generated the negative images at each predicted BS. First, a box centered by a predicted binding is defined. The box with the size of 20 Å in X, Y, and Z is divided into a set of grid points using a grid spacing of 2 Å. To specifically extract the inner shape of a binding pocket, the grid points in the box are successively discarded by grid filtering criteria as follows; (1) removing the grid points located at < 3.0 Å from all the receptor atoms; (2) removing the grid points located at > 4.5 Å from all the receptor atoms; (3) removing highly solvent-exposed grid points.
To determine highly solvent-exposed grid points, we calculated the fraction of radial rays that strikes the receptor surface atoms among 146 evenly spaced radial rays (20 degrees in each direction) of 8 Å length from a grid point. If the fraction is < 0.5, the grid is removed. After the grid filtering, remaining grid points are clustered by their spatial proximity using a cutoff distance of 3.46 Å, which is the longest distance between different grid points in a cubic lattice. To measure the volume of the negative image, only largest cluster is used and its number of grid points is counted. If the number of grid points is less than 5, the predicted ligand BS was discarded. After removing the inappropriate pockets, top five predictions were finally selected for performance evaluation.
Template-based ligand BS prediction using global structure alignment
For template-based BS prediction using GSA, TM-align33 was used to align the whole structures of target and library proteins, and quantify their global structural similarity. Overall procedure for the GSA-based method is identical to that of the LSA-based method, except that TM-align was used for structure alignment instead of G-LoSA. The templates were identified in terms of a global structure similarity, TM-score,34
| (3) |
where LTarget is the length of target protein and Lali is the number of aligned residues. di is the distance between the ith pair of aligned residues. d0(LTarget) is a distance parameter that normalizes the distance so that the average TM-score is not dependent on the protein size.
Ligand BS prediction using non-template geometry-based method
fpocket11 is a widely-used geometry-based BS prediction method and one of few methods that can be downloaded for large-scale benchmark set validation. We used fpocket as a representative non-template geometry-based BS prediction method (see the algorithm details in Supporting Information Section 3). All parameters were set to the default values. The ligand BS was determined by the centroid of alpha spheres in each pocket.
RESULTS
Performance comparison of individual methods
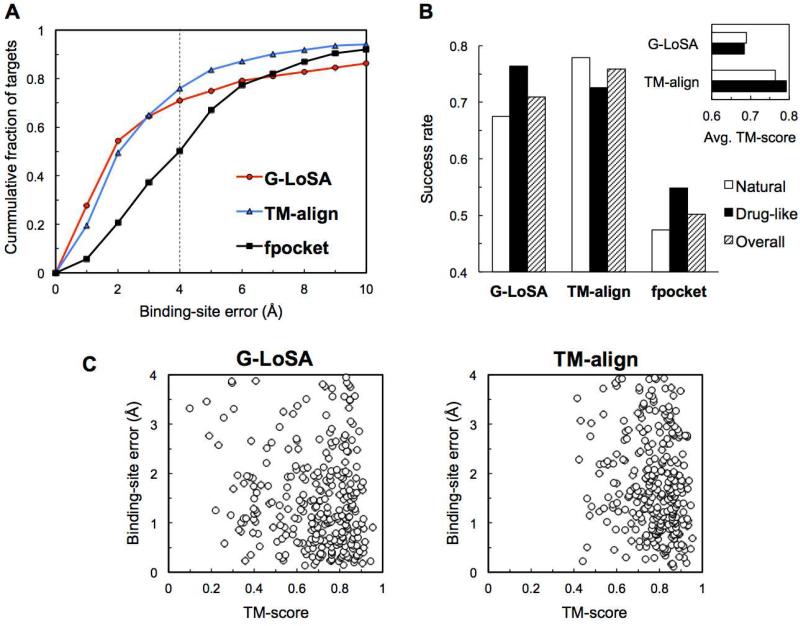
The BS prediction performances by the LSA-based (using G-LoSA), GSA-based (using TM-align) and geometry-based (using fpocket) methods are first compared for SET-S (single-chain ligands; see Methods). For simplicity, hereafter, each method is referred to as G-LoSA, TM-align, and fpocket, respectively. Two criteria are used to evaluate the performance: the least distance between predicted top five BS and the centroid of native ligand (BS-error) and the percentage of targets within 4 Å BS-error (success rate), where 4 Å was chosen based on the average radius of gyration of all benchmark set ligands (3.95 Å). As shown in Figure 2A, both template-based G-LoSA and TM-align show much better performance compared to fpocket. The median BS-errors are 1.85 Å (G-LoSA), 2.03 Å (TM-align), and 3.98 Å (fpocket) (Table 1). The success rates of G-LoSA and TM-align are 70.9% and 75.9% and much higher than that of fpocket (50.2%). While the success rate of G-LoSA is lower than that of TM-align, G-LoSA outperforms TM-align within the 2 Å BS-error range, resulting in 0.18 Å lower median BS-errors, suggesting that G-LoSA provides higher quality superposition within ligand BS.
Figure 2.
Performance comparison of different methods in predicting ligand BS for SET-S. (A) Cumulative fraction of targets versus the best BS-error in top five predictions. (B) Success rates of different methods for natural ligands and drug-like compounds. The inset presents the average TM-score over the best templates for each target. The best template is a template with the highest score in the cluster of the lowest BS-error. (C) Binding-site error as a function of the TM-score of the best template for successful targets.
Table 1.
Summary of BS prediction results on benchmark targets.
| Method | Ligand type | SET-S | SET-M | |||
|---|---|---|---|---|---|---|
| Median BS-error (Å) | Success rate (%) | Median BS-error (Å) | Success rate (%) | |||
| G-LoSA | Natural | 1.93 | 67.5 | 4.87 | 47.5 | |
| Drug-like | 1.73 | 76.4 | 7.52 | 36.4 | ||
| Overall | 1.85 | 70.9 | 5.88 | 44.6 | ||
| TM-align | Natural | 1.96 | 77.9 | 3.04 | 50.8 | |
| Drug-like | 2.34 | 72.6 | 3.85 | 50.0 | ||
| Overall | 2.03 | 75.9 | 3.27 | 50.6 | ||
| fpocket | Natural | 4.10 | 47.4 | 5.25 | 32.8 | |
| Drug-like | 3.61 | 54.8 | 4.23 | 40.9 | ||
| Overall | 3.98 | 50.2 | 4.69 | 34.9 | ||
| CMCS-BSP | Natural | 1.66 | 83.9 | 2.31 | 57.4 | |
| Drug-like | 1.56 | 84.1 | 5.41 | 45.5 | ||
| Overall | 1.59 | 84.0 | 2.91 | 54.2 | ||
Following ligand classification in Roy and Zhang's study,22 we divide SET-S into endogenous ligands (natural) and artificially synthesized (drug-like) ligands; there are 249 natural ligands and 157 drug-like ligands. Figure 2B shows that G-LoSA and fpocket predict BS more accurately for drug-like ligands than for natural ligands, whereas TM-align performs better for natural ligands. By design, geometry-based methods such as fpocket better detect large and deep clefts on the protein surface (i.e., easy pocket) than gently concave pockets or inter-connected subpockets (i.e., hard pocket). Therefore, the fpocket results show that the drug-like ligands tend to prefer the easy pockets to ensure high-affinity to the target protein. The success rate of G-LoSA for the drug-like ligands is the best among the three methods. Although artificially synthesized drug-like compounds are often found in the biological binding-site (e.g., competitive inhibitors or non-hydrolyzable analogs), the BS structures of natural ligands seem to be geometrically less conserved than those targeted by drug-like ligands. Such difference in BS structures makes it difficult for G-LoSA to accurately discriminate the true pockets for natural ligands. On the other hand, the global fold similarity measured by TM-align is less sensitive to the local structural variations, resulting in better performance for natural ligands than G-LoSA. In addition, TM-align's higher success rate for natural ligands over drug-like ligands indicates that better templates are available for GSA-based natural ligand BS prediction in the current PDB library.
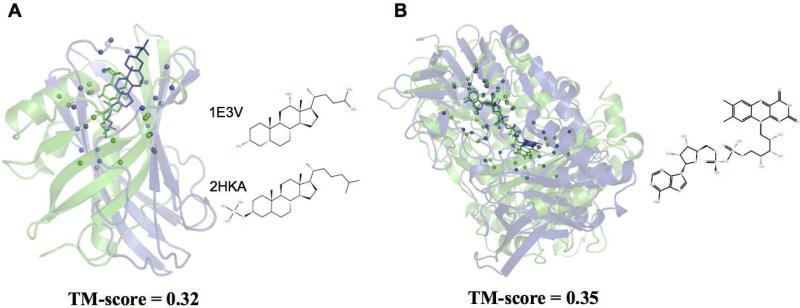
Figure 2B (inset) also shows the TM-score measurement between successful targets and their best templates. Clearly, for both ligand types, the average TM-score in the G-LoSA result is lower than that in the TM-align result. In addition, the number of the successful targets with TM-score < 0.5 for their best templates is 47 for G-LoSA and 10 for TM-align (Figure 2C). This analysis indicates that G-LoSA can efficiently detect the BS structural conservation among proteins with relatively lower global fold similarities. To further demonstrate the ability of G-LoSA in detecting conserved BS from proteins with distinct folds, two representative examples from the benchmark set are presented in Figure 3. In each case, global structure similarities between target and template proteins are low, e.g., TM-scores of 0.32 (Figure 3A) and 0.35 (Figure 3B), but their binding pockets exhibit significant structural similarity.
Figure 3.
Successful examples of detecting similar binding pockets from proteins with distinct global folds by G-LoSA. (A) PDB:1E3V (target, green) and PDB:2HKA (template, blue) with TM-score of 0.32. (B) PDB:2OAL (target) and PDB:3T0K (template) with TM-score of 0.35 in complex with an identical ligand, flavin-adenine dinucleotide. The Cα-atoms in BS-structures are represented as spheres.
Development of CMCS-BSP
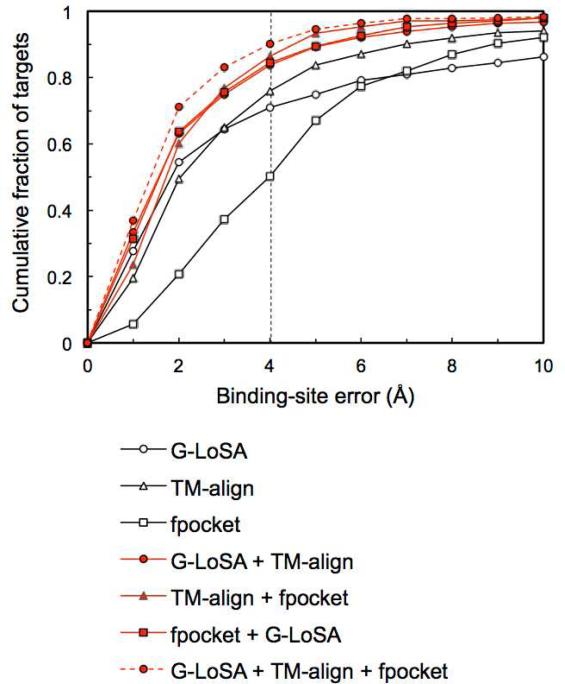
As described in the previous section, G-LoSA has its own merits in predicting ligand BS. However, the performance would be further enhanced if advantages from the methods using different BS-detection algorithms could be efficiently incorporated. To examine the complementarity of G-LoSA in ligand BS prediction, we measure the performances in terms of all possible combinations of the three methods (Figure 4). When we merge five predictions from different two methods and use the best in the combined 10 predictions, their performances are all better than the single methods. The performance of the best in 15 predictions from all three methods is superior to those of any two-method combinations. The results clearly show that LSA-based G-LoSA works complementarily to GSA-based TM-align as well as non-template geometry-based fpocket.
Figure 4.
The complementarity of G-LoSA in ligand BS prediction, measured for SET-S. When two different methods were combined, the best pocket distance was chosen from 10 predictions (five from each method). When all three methods were combined, the best pocket distance was chosen from 15 predictions.
Based on these observations, we have developed a new consensus scoring method, CMCS-BSP (Complementary Methods and Consensus Scoring for ligand Binding Site Prediction). In this method, the consensus scoring function (SCMCS) is a linear summation of the normalized scoring function (f) of each method.
| (4) |
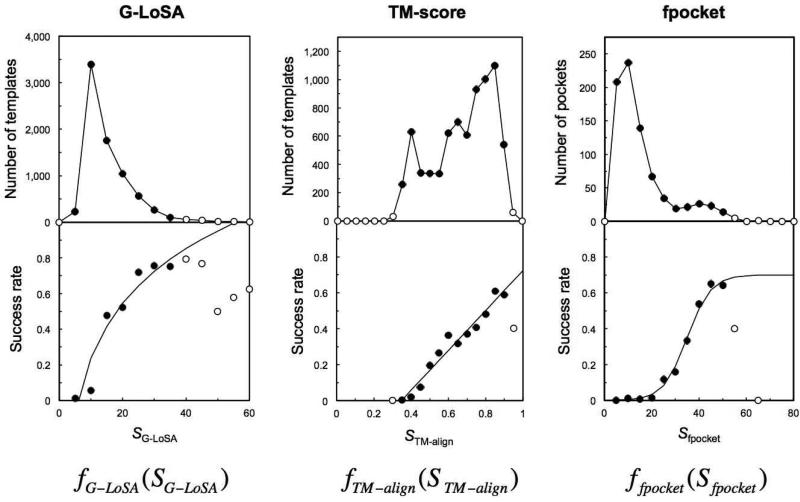
where f is derived using the training benchmark sets (tSET-S or tSET-M; see Methods). For the training benchmark set, the total numbers of templates (by G-LoSA and TM-align) or predictions (by fpocket) are first counted with respect to scores in each method (upper panel of Figure 5). The number of successful templates/predictions is then counted using a cutoff distance of 5 Å for each score bin, and their success rates are calculated (lower panel of Figure 5). The normalized scoring function is obtained by curve fitting of the success rate-score plot of each method with the boundary conditions of minimum value 0 and maximum value 1. The final scoring functions for SET-S are
| (5) |
| (6) |
| (7) |
where SG-LoSA, STM-score, and Sfpocket are the original scores for G-LoSA, TM-align, and fpocket, respectively.
Figure 5.
Derivation of the normalized scoring functions using the training benchmark set, tSET-S. To fit the curve, the points (open circles) with no predictions or the number of predictions less than 15% to the average were discarded as outliers.
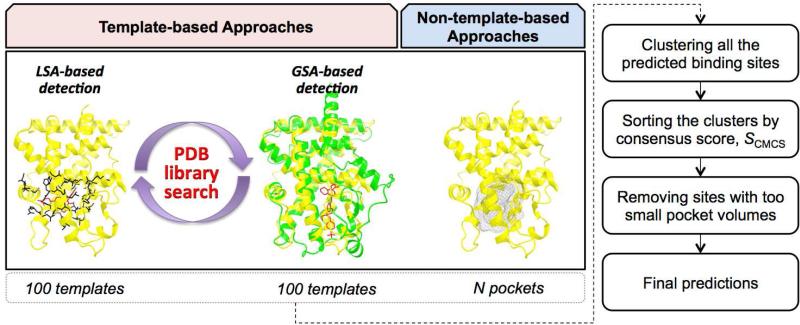
The overall flowchart of the CMCS-BSP method is illustrated in Figure 6. All of the predicted BS from each method are collected and clustered using a distance cutoff of 3 Å. Then, the score of each cluster is determined by SCMCS using the (best) score of each method in the cluster.
| (8) |
After rank-ordering all the clusters by SCMCS, the clusters consisting of only G-LoSA and/or TM-align templates are subjected to the filtering step by pocket volume (see Methods). The top five clusters are then chosen and the BS are determined by the centroids of each cluster.
Figure 6.
Schematic representation of the CMCS-BSP method.
Performance of CMCS-BSP
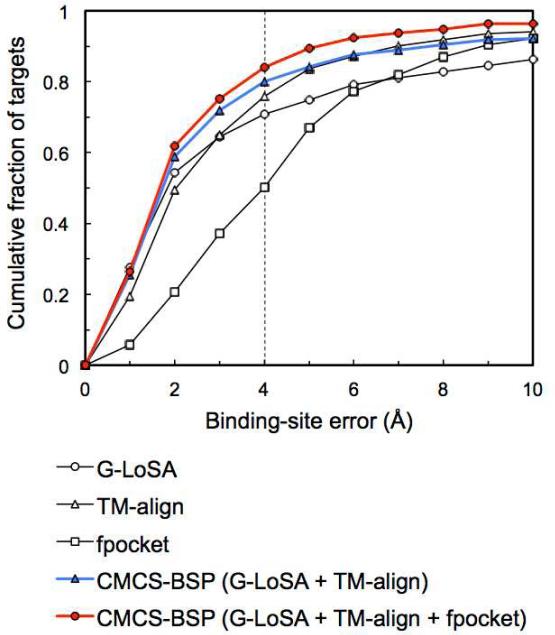
Figure 7 shows the performance of CMCS-BSP for SET-S. The combined template-based methods (G-LoSA and TM-align) increase accuracy over the single methods. Furthermore, additional combination with a non-template-based method, fpocket, further enhances the performance. The median BS-error (1.59 Å) of all three-method combination is 0.26 Å, 0.44 Å, and 1.89 Å lower than that of G-LoSA, TM-align, and fpocket, respectively. The CMCS-BSP method successfully predicts ligand BS for 84% benchmark targets. The success rate is increased by 13.1%, 8.1% and 33.8%, compared to G-LoSA, TM-align and fpocket, respectively (Table 1). In addition, performances for different ligand types become comparable; the success rates are 83.9% (natural ligands) and 84.1% (drug-like ligands), indicating that CMCS-BSP is also useful to remove performance bias resulting from different principles adopted in the individual methods.
Figure 7.
Performance of CMCS-BSP in predicting ligand BS for SET-S. For comparison, the performance results for the individual methods are also included in the plot.
In Table 2, we decompose the CMCS-BSP result in terms of the contributions from each or combined methods. 17% of the total benchmark targets are determined by single methods. More than a half (56%) is determined by two-method combinations and the remaining (27%) is from the three-method combination. Notably, a large fraction (83%) is covered by G-LoSA (i.e., G-LoSA, G-LoSA + TM-align, fpocket + G-LoSA, and G-LoSA + TM-align + fpocket), indicating an important, complementary role that G-LoSA plays in CMCS-BSP. In addition, the success rates increase as the number of different methods predicting identical BS increases (i.e., 53.5% (single methods) to 80.6% (two-method combinations) to 92.6% (three-method combination) in Table 2), indicating that binding pockets commonly detected by multiple methods have high prediction confidence.
Table 2.
Decomposition of CMCS-BSP (G-LoSA + TM-algin + fpocket) results for SET-S in terms of the contributions from each method.
| Methodsa | Fractionb | Success rate (%)c |
|---|---|---|
| G-LoSA | 0.05 | 57.9 |
| TM-align | 0.07 | 54.8 |
| fpocket | 0.05 | 47.6 |
| Avg. | 53.5 | |
| G-LoSA + TM-align | 0.49 | 92.4 |
| TM-align + fpocket | 0.05 | 61.9 |
| fpocket + G-LoSA | 0.02 | 87.5 |
| Avg. | 80.6 | |
| G-LoSA + TM- align + fpocket | 0.27 | 92.6 |
In this table, methods represent the (combined) methods that yield the best prediction in the CMCS-BSP results. For example, G-LoSA + TM-align means that the best prediction was produced by G-LoSA template(s) and TM-align template(s).
Fraction represents the coverage of each method for the benchmark targets. For example, 49% best predictions are from G-LoSA + TM-align.
Success rate is the percentage of successful targets among each fraction. For example, the fraction of successful targets for G-LoSA + TM-align is 0.92 among 49% best predictions.
MetaPocket35 is another method adopting a consensus scoring approach. The method collects predictions from a set of different methods and the raw scores of each site are transformed into Z-scores in each method. All the predicted BS are clustered and then the clusters are ranked by the sum of the Z-scores of the pocket sites in a cluster. When we simply applied this Z-score-based approach in the CMCS-BSP method, the overall performances became worse (Supporting Information Table S1), illustrating the robustness of our consensus scoring approach.
Application of G-LoSA and CMCS-BSP to multi-chain ligands
We evaluate the BS-prediction performances of all the methods against SET-M. The same protocols used for SET-S were used, except that filtering of predicted BS by pocket volume evaluation was not applied because BS in SET-M are from only single chain (for both target and template proteins) and thus tend to be highly solvent-exposed. Clearly, when the number of BS-residues only from a single chain (instead of all the BS-involved chains) are plotted as a function of ligand's radius of gyration, the number of BS-residues is much less proportional to the ligand size for SET-M than for SET-S, due to incompleteness of SET-M binding pockets (Supporting Information Figure S2). The normalized scoring functions, which were derived from tSET-M, for CMCS-BSP are summarized in Supporting Information Section S4.
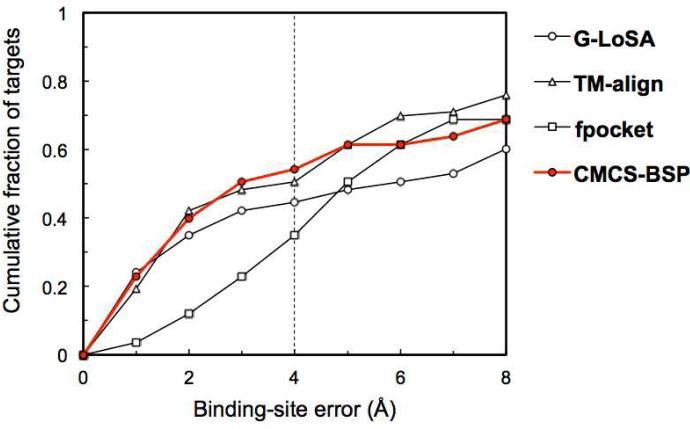
Overall, BS-prediction performance of all the methods are substantially decreased for SET-M (Figure 8), compared to the results for SET-S. The median values of BS-errors for SET-M are 4.03 Å (G-LoSA), 1.24 Å (TM-align), and 0.71 Å (fpocket) larger than those for SET-S, respectively (Table 1). The success rates are 26.3%, 25.3% and 15.3% lower, respectively. Such significant decreases in the template-based methods indicate that proper templates for multi-chain ligands are less available in the current PDB library than for single-chain ligands. G-LoSA is more negatively influenced for multi-chain ligand BS prediction than TM-align, indicating that the ability of G-LoSA in detecting local structure conservation largely deteriorates when non-intact pockets (i.e., BS-structures built from only a single chain instead of the multiple chains) are used. CMCS-BSP improves the prediction ability (Table 1), but the effect is marginal compared to the SET-S case. The results demonstrate that accurate detection of multi-chain ligands is still challenging and thus more sophisticated approaches are needed.
Figure 8.
Performance comparison in predicting ligand BS for SET-M. CMCS-BSP corresponds to the results from the G-LoSA + TM-align + fpocket combination.
DISCUSSION AND CONCLUSIONS
We present a template-based ligand BS prediction method utilizing G-LoSA, our sequence-continuity and fold independent LSA tool. The large benchmark set validation demonstrates that the method provides more reliable predictions than a geometry-based method, fpocket. In comparison with a GSA-based method using TM-align, while the overall success rate of TM-align is better, G-LoSA is more effective not only in detecting drug-like ligands’ BS, but also in detecting conserved BS structures across proteins with dissimilar global folds. This ability of G-LoSA suggests that its potential application could be to quantify the “promiscuity” of a drug-like ligand on a proteome-wide scale. On the other hand, the G-LoSA performance most severely deteriorates for multi-chain ligands (SET-M) due to a lack of available proper templates in the current PDB library and a decrease in its ability in accurately detecting conserved local structures. G-LoSA is written in C++ and the source code is freely available at http://im.bioinformatics.ku.edu/GLoSA. The development of G-LoSA is ongoing. Additional applications will be evaluated with further parameter optimization as well as the improved features.
The present study demonstrates that G-LoSA has performance complementarity to TM-align and fpocket. To take most advantage of the G-LoSA's merit, a robust consensus scoring method, CMCS-BSP, is developed. CMCS-BSP integrates multiple methods of different principles by the linear summation of more elaborately designed normalized scoring function of each method. Improvement on prediction accuracy is achieved when G-LoSA is combined with TM-align by CMCS-BSP. Further performance improvement by additional integration with fpocket also suggests that diverse non-template-based BS prediction methods including geometry- and energy-based methods can enrich the prediction accuracy in CMCS-BSP in cases that no proper templates are available.
The potential binding pockets can be further evaluated using different kinds of computational techniques such as molecular dynamics simulation-based approaches,36 virtual fragment screening approaches,37 and computational solvent mapping38 in order to obtain structural clues to potential ligand structures and discriminate true druggable sites. Once a druggable site is identified in a target protein, virtual high-throughput screening using molecular docking becomes feasible. Furthermore, G-LoSA can also be adopted for BS-focused large-scale structure library searches, aiming at de novo ligand design.29
When the 3D structure of a target protein is obtained, it is common that the structure does not contain any drug-like molecules within the binding pocket of interest. The binding of a ligand induces conformational changes within the BS, resulting in structural differences from its apo-form. In general, geometry- and energy-based BS prediction methods perform better on the holo-structures than the corresponding apo-structures.14, 39 Accounting for residue conservation within binding pockets can improve the prediction accuracy for apo-structures.10 On the other hand, it has been well known that template-based methods using GSA tolerates the local structural changes.16, 17 In G-LoSA, we use Cα atom-based superposition and scoring function. This design is also less sensitive to structural variations within the BS.27, 40 Even so, ultimately, an optimized incorporation of multiple conformations, which are computationally sampled from an initial structure, into CMCS-BSP should be a promising approach to achieve accurate predictions for apo-structures.
Supplementary Material
ACKNOWLEDGMENTS
We thank Ambrish Roy for providing the PDB structures of COFACTOR benchmark set. This work was supported by NIH U54GM087519 and XSEDE resources (TG-MCB070009).
Footnotes
Supporting Information. Details on preparation of BS-ligand structure library, G-LoSA algorithm, fpocket algorithm, and normalized scoring functions for SET-M. Schematic representation of template identification by G-LoSA (Figure S1). The plots of number of BS-residues as a function of ligand Rg (Figure S2). Performance comparison between CMCS-BSP and MetaPocket (Table S1). This information is available free of charge via the Internet at http://pubs.acs.org/.
REFERENCES
- 1.Chandonia JM, Brenner SE. The impact of structural genomics: expectations and outcomes. Science. 2006;311:347–351. doi: 10.1126/science.1121018. [DOI] [PubMed] [Google Scholar]
- 2.Perot S, Sperandio O, Miteva MA, Camproux AC, Villoutreix BO. Druggable pockets and binding site centric chemical space: a paradigm shift in drug discovery. Drug Discov. Today. 2010;15:656–667. doi: 10.1016/j.drudis.2010.05.015. [DOI] [PubMed] [Google Scholar]
- 3.Campbell SJ, Gold ND, Jackson RM, Westhead DR. Ligand binding: functional site location, similarity and docking. Curr. Opin. Struct. Biol. 2003;13:389–395. doi: 10.1016/s0959-440x(03)00075-7. [DOI] [PubMed] [Google Scholar]
- 4.Valdar WS. Scoring residue conservation. Proteins. 2002;48:227–241. doi: 10.1002/prot.10146. [DOI] [PubMed] [Google Scholar]
- 5.Capra JA, Singh M. Predicting functionally important residues from sequence conservation. Bioinformatics. 2007;23:1875–1882. doi: 10.1093/bioinformatics/btm270. [DOI] [PubMed] [Google Scholar]
- 6.Levitt DG, Banaszak LJ. POCKET: a computer graphics method for identifying and displaying protein cavities and their surrounding amino acids. J. Mol. Graph. 1992;10:229–234. doi: 10.1016/0263-7855(92)80074-n. [DOI] [PubMed] [Google Scholar]
- 7.Laskowski RA. SURFNET: a program for visualizing molecular surfaces, cavities, and intermolecular interactions. J. Mol. Graph. 1995;13:323–330. doi: 10.1016/0263-7855(95)00073-9. [DOI] [PubMed] [Google Scholar]
- 8.Hendlich M, Rippmann F, Barnickel G. LIGSITE: automatic and efficient detection of potential small molecule-binding sites in proteins. J. Mol. Graph. Model. 1997;15:359–363. doi: 10.1016/s1093-3263(98)00002-3. [DOI] [PubMed] [Google Scholar]
- 9.Liang J, Edelsbrunner H, Woodward C. Anatomy of protein pockets and cavities: measurement of binding site geometry and implications for ligand design. Protein Sci. 1998;7:1884–1897. doi: 10.1002/pro.5560070905. [DOI] [PMC free article] [PubMed] [Google Scholar]
- 10.Capra JA, Laskowski RA, Thornton JM, Singh M, Funkhouser TA. Predicting protein ligand binding sites by combining evolutionary sequence conservation and 3D structure. PLoS Comput. Biol. 2009;5:e1000585. doi: 10.1371/journal.pcbi.1000585. [DOI] [PMC free article] [PubMed] [Google Scholar]
- 11.Le Guilloux V, Schmidtke P, Tuffery P. Fpocket: an open source platform for ligand pocket detection. BMC Bioinformatics. 2009;10:168. doi: 10.1186/1471-2105-10-168. [DOI] [PMC free article] [PubMed] [Google Scholar]
- 12.Goodford PJ. A computational procedure for determining energetically favorable binding sites on biologically important macromolecules. J. Med. Chem. 1985;28:849–857. doi: 10.1021/jm00145a002. [DOI] [PubMed] [Google Scholar]
- 13.An J, Totrov M, Abagyan R. Pocketome via comprehensive identification and classification of ligand binding envelopes. Mol. Cell Proteomics. 2005;4:752–761. doi: 10.1074/mcp.M400159-MCP200. [DOI] [PubMed] [Google Scholar]
- 14.Laurie AT, Jackson RM. Q-SiteFinder: an energy-based method for the prediction of protein-ligand binding sites. Bioinformatics. 2005;21:1908–1916. doi: 10.1093/bioinformatics/bti315. [DOI] [PubMed] [Google Scholar]
- 15.Rose PW, Beran B, Bi C, Bluhm WF, Dimitropoulos D, Goodsell DS, Prlic A, Quesada M, Quinn GB, Westbrook JD, Young J, Yukich B, Zardecki C, Berman HM, Bourne PE. The RCSB Protein Data Bank: redesigned web site and web services. Nucleic Acids Res. 2011;39:D392–D401. doi: 10.1093/nar/gkq1021. [DOI] [PMC free article] [PubMed] [Google Scholar]
- 16.Brylinski M, Skolnick J. A threading-based method (FINDSITE) for ligand-binding site prediction and functional annotation. Proc. Natl. Acad. Sci. U.S.A. 2008;105:129–134. doi: 10.1073/pnas.0707684105. [DOI] [PMC free article] [PubMed] [Google Scholar]
- 17.Lee HS, Zhang Y. BSP-SLIM: a blind low-resolution ligand-protein docking approach using predicted protein structures. Proteins. 2012;80:93–110. doi: 10.1002/prot.23165. [DOI] [PMC free article] [PubMed] [Google Scholar]
- 18.Oh M, Joo K, Lee J. Protein-binding site prediction based on three-dimensional protein modeling. Proteins. 2009;77(Suppl 9):152–156. doi: 10.1002/prot.22572. [DOI] [PubMed] [Google Scholar]
- 19.Schmidt T, Haas J, Gallo Cassarino T, Schwede T. Assessment of ligand-binding residue predictions in CASP9. Proteins. 2011;79(Suppl 10):126–136. doi: 10.1002/prot.23174. [DOI] [PMC free article] [PubMed] [Google Scholar]
- 20.Carter P, Wells JA. Dissecting the catalytic triad of a serine protease. Nature. 1988;332:564–568. doi: 10.1038/332564a0. [DOI] [PubMed] [Google Scholar]
- 21.Gherardini PF, Wass MN, Helmer-Citterich M, Sternberg MJ. Convergent evolution of enzyme active sites is not a rare phenomenon. J. Mol. Biol. 2007;372:817–845. doi: 10.1016/j.jmb.2007.06.017. [DOI] [PubMed] [Google Scholar]
- 22.Roy A, Zhang Y. Recognizing protein-igand binding sites by global structural alignment and local geometry refinement. Structure. 2012;20:987–997. doi: 10.1016/j.str.2012.03.009. [DOI] [PMC free article] [PubMed] [Google Scholar]
- 23.Needleman SB, Wunsch CD. A general method applicable to the search for similarities in the amino acid sequence of two proteins. J. Mol. Biol. 1970;48:443–453. doi: 10.1016/0022-2836(70)90057-4. [DOI] [PubMed] [Google Scholar]
- 24.Shulman-Peleg A, Nussinov R, Wolfson HJ. Recognition of functional sites in protein structures. J. Mol. Biol. 2004;339:607–633. doi: 10.1016/j.jmb.2004.04.012. [DOI] [PMC free article] [PubMed] [Google Scholar]
- 25.Gold ND, Jackson RM. SitesBase: a database for structure-based protein-ligand binding site comparisons. Nucleic Acids Res. 2006;34:D231–D234. doi: 10.1093/nar/gkj062. [DOI] [PMC free article] [PubMed] [Google Scholar]
- 26.Schmitt S, Kuhn D, Klebe G. A new method to detect related function among proteins independent of sequence and fold homology. J. Mol. Biol. 2002;323:387–406. doi: 10.1016/s0022-2836(02)00811-2. [DOI] [PubMed] [Google Scholar]
- 27.Park K, Kim D. Binding similarity network of ligand. Proteins. 2008;71:960–971. doi: 10.1002/prot.21780. [DOI] [PubMed] [Google Scholar]
- 28.Konc J, Janezic D. ProBiS algorithm for detection of structurally similar protein binding sites by local structural alignment. Bioinformatics. 2010;26:1160–1168. doi: 10.1093/bioinformatics/btq100. [DOI] [PMC free article] [PubMed] [Google Scholar]
- 29.Lee HS, Im W. Identification of ligand templates using local structure alignment for structure-based drug design. J. Chem. Inf. Model. 2012;52:2784–2795. doi: 10.1021/ci300178e. [DOI] [PMC free article] [PubMed] [Google Scholar]
- 30.Dessailly BH, Lensink MF, Orengo CA, Wodak SJ. LigASite--a database of biologically relevant binding sites in proteins with known apo-structures. Nucleic Acids Res. 2008;36:D667–D673. doi: 10.1093/nar/gkm839. [DOI] [PMC free article] [PubMed] [Google Scholar]
- 31.Hartshorn MJ, Verdonk ML, Chessari G, Brewerton SC, Mooij WT, Mortenson PN, Murray CW. Diverse, high-quality test set for the validation of protein-ligand docking performance. J. Med. Chem. 2007;50:726–741. doi: 10.1021/jm061277y. [DOI] [PubMed] [Google Scholar]
- 32.Perola E, Walters WP, Charifson PS. A detailed comparison of current docking and scoring methods on systems of pharmaceutical relevance. Proteins. 2004;56:235–249. doi: 10.1002/prot.20088. [DOI] [PubMed] [Google Scholar]
- 33.Zhang Y, Skolnick J. TM-align: a protein structure alignment algorithm based on the TM-score. Nucleic Acids Res. 2005;33:2302–2309. doi: 10.1093/nar/gki524. [DOI] [PMC free article] [PubMed] [Google Scholar]
- 34.Zhang Y, Skolnick J. Scoring function for automated assessment of protein structure template quality. Proteins. 2004;57:702–710. doi: 10.1002/prot.20264. [DOI] [PubMed] [Google Scholar]
- 35.Zhang Z, Li Y, Lin B, Schroeder M, Huang B. Identification of cavities on protein surface using multiple computational approaches for drug binding site prediction. Bioinformatics. 2011;27:2083–2088. doi: 10.1093/bioinformatics/btr331. [DOI] [PubMed] [Google Scholar]
- 36.Seco J, Luque FJ, Barril X. Binding site detection and druggability index from first principles. J. Med. Chem. 2009;52:2363–2371. doi: 10.1021/jm801385d. [DOI] [PubMed] [Google Scholar]
- 37.Huang N, Jacobson MP. Binding-site assessment by virtual fragment screening. PLoS One. 2010;5:e10109. doi: 10.1371/journal.pone.0010109. [DOI] [PMC free article] [PubMed] [Google Scholar]
- 38.Kozakov D, Hall DR, Chuang GY, Cencic R, Brenke R, Grove LE, Beglov D, Pelletier J, Whitty A, Vajda S. Structural conservation of druggable hot spots in protein-protein interfaces. Proc. Natl. Acad. Sci. U.S.A. 2011;108:13528–13533. doi: 10.1073/pnas.1101835108. [DOI] [PMC free article] [PubMed] [Google Scholar]
- 39.Xie ZR, Hwang MJ. Ligand-binding site prediction using ligand-interacting and binding site-enriched protein triangles. Bioinformatics. 2012;28:1579–1585. doi: 10.1093/bioinformatics/bts182. [DOI] [PubMed] [Google Scholar]
- 40.Gao M, Skolnick J. APoc: large-scale identification of similar protein pockets. Bioinformatics. 2013;29:597–604. doi: 10.1093/bioinformatics/btt024. [DOI] [PMC free article] [PubMed] [Google Scholar]
Associated Data
This section collects any data citations, data availability statements, or supplementary materials included in this article.


