Abstract
Tilt table test (TTT) is a standard examination for patients with suspected autonomic nervous system (ANS) dysfunction or uncertain causes of syncope. Currently, the analytical method based on blood pressure (BP) or heart rate (HR) changes during the TTT is linear but normal physiological modulations of BP and HR are thought to be predominately nonlinear. Therefore, this study consists of two parts: the first part is analyzing the HR during TTT which is compared to three methods to distinguish normal controls and subjects with ANS dysfunction. The first method is power spectrum density (PSD), while the second method is detrended fluctuation analysis (DFA), and the third method is multiscale entropy (MSE) to calculate the complexity of system. The second part of the study is to analyze BP and cerebral blood flow velocity (CBFV) changes during TTT. Two measures were used to compare the results, namely correlation coefficient analysis (nMxa) and MSE. The first part of this study has concluded that the ratio of the low frequency power to total power of PSD, and MSE methods are better than DFA to distinguish the difference between normal controls and patients groups. While in the second part, the nMxa of the three stages moving average window is better than the nMxa with all three stages together. Furthermore the analysis of BP data using MSE is better than CBFV data.
Keywords: Autonomic nervous system (ANS), blood pressure (BP), cerebral autoregulation, cerebral blood flow velocity, heart rate, multiscale entropy (MSE), tilt table test (TTT).
1. INTRODUCTION
The autonomic nervous system (ANS) is a part of the central and peripheral nervous systems, and is independent of the voluntary control by our wills. It can be divided into sympathetic and parasympathetic nervous systems. These activities affect heart rate (HR), respiration rate and so on. The activation of the sympathetic nervous system can raise blood pressure (BP) and accelerates the HR. The parasympathetic nervous system is opposite of sympathetic nervous system, as its activation can slow down the HR. Heart rate variability (HRV) is used to estimate the ANS activities of human traditionally, because of its meaningful and non-invasive characteristics[1-3]. The HRV is measured based on the beat-to-beat variations in RR intervals, which is from electrocardiogram (ECG). Furthermore, this calculation method has been widely accepted in the analysis of ECG signal, and can traditionally be subdivided into time domain and frequency domain.
Cerebral autoregulation is an intrinsic mechanism to maintain stable cerebral blood flow in a range of cerebral perfusion pressure under normal physiological circumstances. Due to its ability, cerebral blood flow will not change significantly with the rapid changes in BP. That is, reduced or increased BP within a certain range will not cause the occurrence of cerebral ischemia or hyper-perfusion and cerebral hemorrhage. In general, the estimation of the status of cerebral autoregulation can be approached via two methods. The first is to manipulate BP slowly and obtain the associated cerebral blood flow changes to identify the upper and lower limits of BP with constant cerebral blood flow. The other type is to calculate the dynamic interaction between the physiologic oscillations of BP and cerebral blood flow. Previous studies have confirmed that dynamic test is more feasible than static for subjects who are not suitable for pharmacological manipulation of BP during the exam [4-5].
In normal physiological conditions, when a person has postural change from lying down to standing up, the body's internal regulating mechanism will begin to operate to prevent large changes of cerebral perfusion and cerebral blood flow during the action. However, for patients with abnormal function of cerebral autoregulation and ANS, neither cerebral perfusion nor cerebral blood flow can be maintained adequately. Using a tilt table test (TTT), the changes of cerebral blood flow velocity (CBFV), BP and HR according to the change of posture can be studied.
For patients with postural hypotension, when they get up fast, they may feel a short period of dizziness, black out or even syncope because of rapid decreasing cerebral perfusion. TTT can be used to simulate similar situation and provide comprehensive information including the possible causes and severities of postural hypotension. During the process of posture changing, biophysiological signals such as HR, BP and CBFV can be changed dependently or independently and TTT can make the correct diagnosis from analysis of the aforementioned signals during the test.
For example, BP change in tilting up phase can tell if a person has orthostatic hypotension. In the same time, the patients’ HR as well as CBFV may or may not change depending on the status of ANS and cerebral autoregulation. In this situation, analysis of their BP, HR and CBFV changes as well as interactions between those signals will be required. Through this comprehensive approach, the patients’ ANS and cerebral autoregulation can be well evaluated.
Currently, the analytic method for BP or HR changes during the TTT is usually linear but normal physiological modulations of BP and HR are thought to be predominately nonlinear. Therefore, the aim of this study is to compare different analytical methods including linear and non-linear approaches in normal controls or subjects with postural hypotension during the TTT exam.
This study consists of two parts. The first part is based on using power spectral density analysis (PSD), detrended fluctuation analysis (DFA) and multiscale entropy analysis (MSE) to analyze HR change in TTT. The second part is based on using MSE and correlation coefficient analysis method to analyze the change between BP and CBFV.
2. METHODOLOGY
2.1. Test Method
TTT is a non-invasive experimental method with high safety. At first, the subject lies down on table and connected to devices to measure the changes of biosignals. The TTT procedure consists of three stages which are shown in Fig. (1). In stage 1, subjects lie down on the horizontal table for about 15 minutes firstly. In stage 2, the table is tilted up to 60 degrees with respect to ground, and maintained for 15 minutes. Stage 3, the table is returned to horizontal state for 10 minutes.
Fig. (1).

The definition of the stages 1, 2 and 3 in the TTT.
Fig. (1). The definition of the stages 1, 2 and 3 in the TTT.
2.2. Analysis Methods and Patients
This study analyzed three biosignals, namely the HR, BP and CBFV. HR analysis, PSD, DFA and MSE methods are used and compared. Then, BP and CBFV, correlation coefficient analysis and MSE methods are used and compared as well.
After obtaining the local hospital institutional ethics committee approval and written informed consent from the study subjects, experiments were conducted at the National Taiwan University Hospital on 4 healthy students for control group and 13 with clinical diagnosis of postural hypotension patients (postural hypotension is defined as a systolic BP decrease of at least 20 mmHg or a diastolic BP decrease of at least 10 mmHg within three minutes of standing) for experimental group.
2.2.1. Power Spectral Density Analysis
This method is the traditional analysis method and had been used to analyze ECG data to evaluate ANS previously. It uses Fast Fourier Transform (FFT) to estimate power spectrum density (PSD), and divided to three regions, which are (a) high frequency (HF) 0.15~0.4 Hz, (b) low frequency (LF) 0.04~0.15 Hz and (c) very low frequency (VLF) 0.003~0.04 Hz. The sum of area under power spectrum means total power (TP), and the area in each frequency region represents the region’s power. Generally, the individual power is divided by TP to normalization.
On the significance of physiological, the ratio of the high frequency power (HFP) and TP were used as the index of parasympathetic nervous system, and the ratio of the low frequency power (LFP) and TP were used as the index of sympathetic nervous system. Moreover, the ratio of LFP and HFP were used as the index of parasympathetic - sympathetic nervous system balance [1, 2, 6].
2.2.2. Detrended Fluctuation Analysis
The DFA method is used to quantify the scaling behavior of a time series, and to quantify the fractal-like scaling properties of the RR interval data. The first step of DFA is to analyze data to find the integral of interbeat interval time series, that is
| (1) |
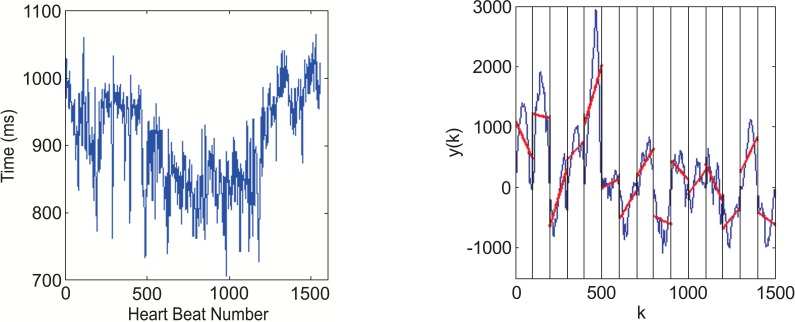
where is the interbeat (blue line) and is the average interbeat interval (red line) as shown in Fig. (2).
Fig. (2).
The pre-treatment of use DFA to analyze HR(a) RR interval from ECG data before analyze. (b) The curve is integrated time series y(k).
Next, the root-mean-square fluctuation of the fluctuation of the integrated function is defined
| (2) |
where N is the point on the trend with timescale of n. Then the scale exponent α is calculated using a linear fit on a log-log plot of F(n).
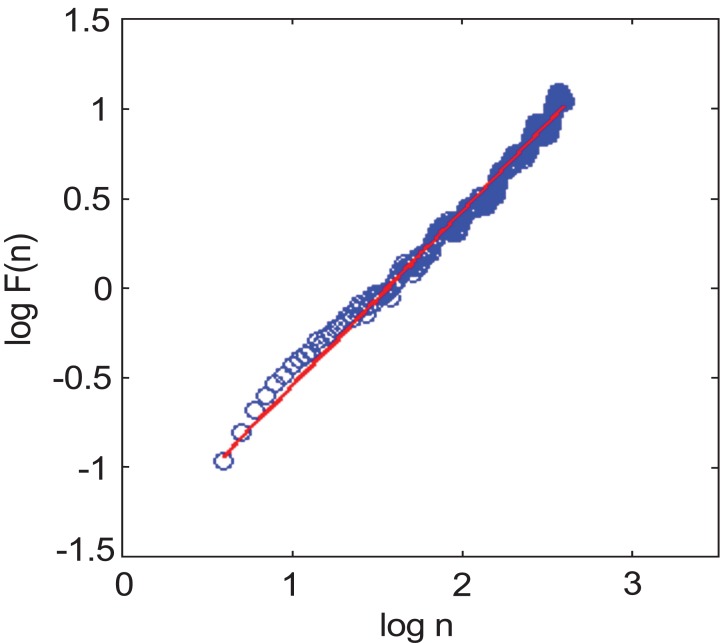
The α value represents the correlation properties of the signal. A fractal-like signal in the scaling exponent of healthy subjects is nearly 1 and the α values is show in Fig. (3) [7].
Fig. (3).
The calculation of α value of DFA (The blue circles are plotted on log10n and log10 F(n)by DFA, and the red line is the first order curve fitting which is a slope of DFA).
2.2.3. Multiscale Entropy Analysis
Many time series data logged from physical and biological systems, contain hidden long-range correlations that can provide interesting and useful information on the structure and evolution of the dynamical system. Since sample entropy is affected easily by noise, the measured value can be with large error. MSE can reduce the error caused by noise effect using more than one scale.
For one-dimensional continuous discrete signal from first term to last term to calculate the coarse-gained time series, the function can be calculated as follows:
| (3) |
where τ is scale factor and
Moreover, complexity index (CI) is defined as the sum of area under the MSE curve. No matter MSE or CI, the higher value means the more complex system is and healthier situation they have. In this study, ECG, BP and CBFV data were analyzed using CI methodology [8].
2.2.4. Correlation Coefficient Analysis
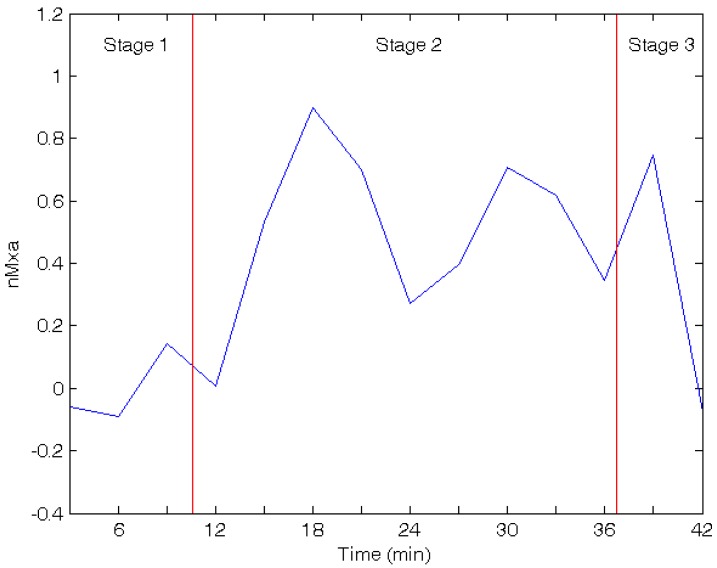
This method has been described in more details by Reinhard et al [9]. In this study, non-invasive method has been used to measure biosignals and calculate Pearson correlation coefficient between BP and CBFV during TTT. This index using a moving average window is called nMxa as shown in Fig. (4) [9]. A correlation index of nearing 0 to -1 indicates functioning autoregulation, whereas a correlation index of nearing 1 denotes impaired autoregulation.
Fig. (4).
The nMxa in three stages of TTT (Blue curve is the correlation coefficient of BP and CBFVchange by time, and red lines divide time into three stages).
2.2.5. Statistical Analysis
The results expressed as mean±SD of data obtained from two groups were compared using the unpaired Student’s t-test (also known as the unpaired t-test). P value < 0.05 was considered statistically significant [10-11].
2.3. Results
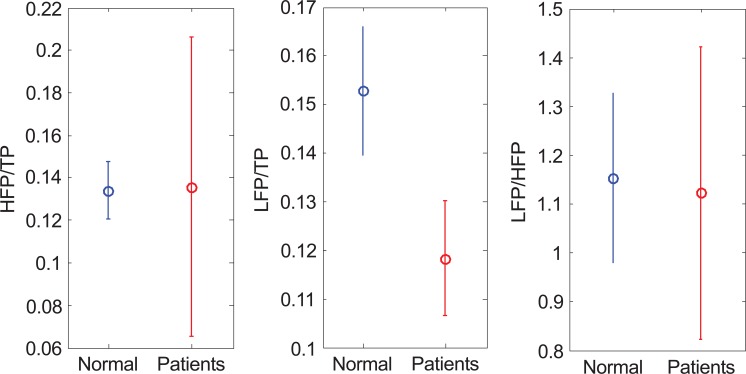
The first method to analyze ECG is PSD as shown in Fig. (5). HFP/TP (normal, 0.134±0.014; patients, 0.135±0.071; p value =0.968) and LFP/HFP (normal, 1.152±0.172; patients, 1.121±0.299; p value =0.849) can hardly tell the difference of the data distribution, but in LFP/TP (normal, 0.153±0.013; patients, 0.118±0.012; p value =0.0002), the average of normal is higher than the patients.
Fig. (5).
The results of applying PSD in TTT (a)HFP/TP (b) LFP/TP (c) LFP/HFP.
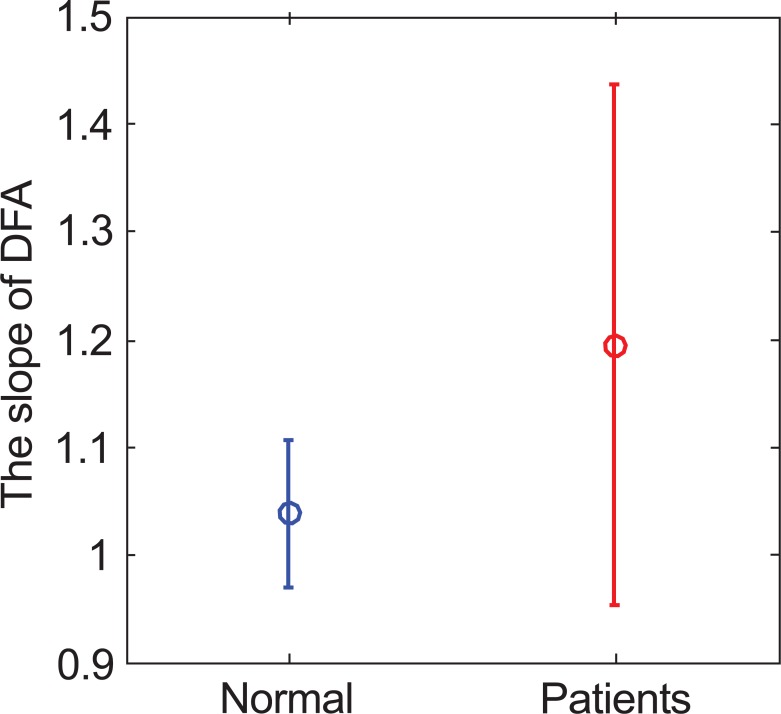
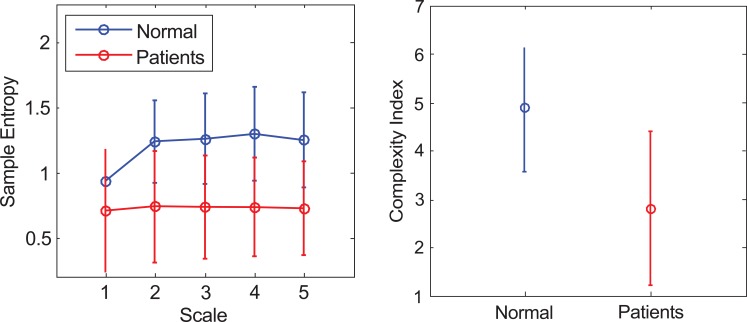
The second method is DFA, which is used to calculate the slope of both groups. Fig. (6) shows the result of average value and standard deviation (normal, 1.038±0.063; patients, 1.194±0.242; p value =0.231). The range of the standard deviation in patients group is much wider than the distribution range of the control group. MSE analysis is the third method. First, the ECG’s sample entropy is calculated under different scales, then the average value and standard deviation as shown in Fig. (7a) and Table 1. Secondly, the average value and standard deviation of the CI (normal, 4.884±1.317; patients, 2.792±1.591, p value =0.03), are calculated as shown in Fig. (7b). For the MSE analysis, the result in the normal group (blue line) is significantly higher than the patients’ group (red line) in both MSE curve and CI.
Fig. (6).
The α value of normal and patients’ group.
Fig. (7).
The result of applying MSE to analyze ECG (a) The sample entropy values on each scale. (b) The CI values for normal and patients’ group.
Table 1.
The Value of Sample Entropy of ECG
| Subject | Scale 1 | Scale 2 | Scale 3 | Scale 4 | Scale 5 |
|---|---|---|---|---|---|
| Normal | 0.937±0.188 | 1.236±0.275 | 1.257±0.303 | 1.297±0.313 | 1.251±0.320 |
| Patients | 0.709±0.468 | 0.724±0.462 | 0.731±0.397 | 0.735±0.380 | 0.721±0.362 |
| P value | 0.367 | 0.05 | 0.03 | 0.02 | 0.02 |
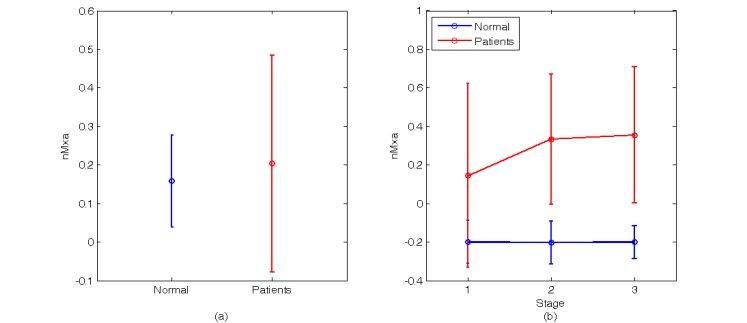
The BP and CBFV part, two methods are used for the analysis. The first method is correlation coefficient. In this method, two kinds of calculation are used. The first one is to calculate the average of all moving average window (normal, 0.158±0122; patients, 0.203±0.280, p value =0.768), as shown in Fig. (8a). In this calculation, there are two sets of data for normal and patients, but it is difficult to see the difference. The second one is to divide all moving average window into three stages, then compute the average of these three stages, as shown in Fig. (8b) and Table 2. In the second coefficient of patients’ group is higher than the normal group, and there is no significant change in these three stages of normal group. However, the correlation coefficient increases in patients subjects with the tiling up and re-supine stages. According to a previous study, the correlation index of functioning autoregulation is nearing 0 to -1 and nearing 1 denotes impaired autoregulation [9].
Fig. (8).
The result of applying correlation coefficient to analyze BP and CBFV (a) The nMxa during the whole experiment. (b) The nMxa of the three stages.
Table 2.
The Value of nMxa, BP-CI and CBFV-CI During Three Stages of TTT
| Subject | Stage 1 | Stage 2 | Stage 3 | ||||||
|---|---|---|---|---|---|---|---|---|---|
| nMxa | BP-CI | CBFV-CI | nMxa | BP-CI | CBFV-CI | nMxa | BP-CI | CBFV-CI | |
| Normal | -0.200±0.123 | 3.882±0.289 | 4.314±0.557 | -0.203±0.112 | 4.749±0.748 | 5.003±0.715 | -0.200±0.085 | 3.943±0.317 | 4.075±0.593 |
| Patients | 0.145±0.477 | 2.542±1.720 | 4.621±1.404 | 0.334±0.338 | 3.377±0.879 | 5.501±2.215 | 0.356±0.353 | 3.758±1.440 | 5.552±2.002 |
| P value | 0.181 | 0.150 | 0.682 | 0.0078 | 0.013 | 0.6716 | 0.008 | 0.806 | 0.176 |
Note: nMxa is the Pearson correlation coefficient between BP and CBFV, BP-CI is the CI of BP and CBFV-CI is the CI of CBFV.
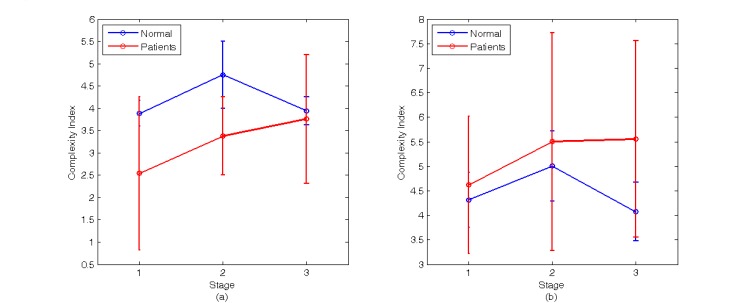
The second method is based on MSE theory to calculate the CI value in different TTT stages of BP and CBFV, as shown in Fig. (9). Fig. (9a) and Table 2 show the CI value of BP in different stages of TTT. The CI value of the normal group is higher than the patients’ group which means the complexity and ANS activity of normal group higher than patients’ group. But the CI value of the patients’ group changes little in TTT, and increase with the stages. Fig. (9b) and Table 2 show CI value of CBFV changes with the stages of TTT. The value of the patients’ group has no obvious difference with the normal group, which is different from the trend of BP result, and both CI values decrease when the table is back to laid-down position.
Fig. (9).
The result of applying MSE to analyze BP and CBFV signals (a) The average value and standard deviation of CI value of BP in different stage (b) The average value and standard deviation of CI value of CBFV in different stage.
3. DISCUSSION AND CONCLUSION
The ECG analysis shows that there is a significant difference for LFP/TP in traditional PSD method. Sympathetic nervous system can make the cardiovascular system activated, therefore, all the study subjects including controls and patients will feel the external stimuli when doing TTT. However, the ANS function of the patients’ group can be distinguished which makes differences from the normal group. On the other hand, it has the same reason when patients’ group receiving TTT in MSE analysis, which has significant difference between two groups. This caused the sample entropy and CI for the patients’ group to be lower than the normal group.
Regarding the correlation coefficient analysis of BP and CBFV, nMxa is calculated using the entire test process and hardly show the difference between the two groups. However, if the mean nMxa of respective stages are distinguished, the nMxa of normal group is less than patients’ group obviously.The finding could be related to the possibly significant BP changes during the tilting up in the patient group, and thus further impaired the status of cerebral autoregulation. That is, although the ability of cerebral autoregulation is only a partial affected by the ANS effects, it will cause changes in BP directly. Therefore, even though the patients may be having poor cerebral autoregulation in the stage 1, they are not necessarily achieving a significant difference. However, the BP will decline and exceed the ability to effect autoregulation of range in the stage 2, so this will give positive correlation coefficient when analyzing BP and CBFV biosignals. In addition, stage 3 will cover partial effect of stage 2, therefore, the results are similar to stage 2 and has significant difference with stage 1. In the other hand, the MSE analysis of BP part, the CI of normal group is higher than patients’ group, and it has obviously changed in three stages. Significant difference can be observed between the two groups when using MSE in stage 2 among the three stages of TTT, because the ANS of normal group act is stronger than patients’ group when they have been stimulated by changing in posture. It indicates that the normal group may have better adaptability under the external stimulus, but the CI of patients’ group is hardly to see the trends obviously because of impaired ANS. However, in the part of CBFV, the CI of patients’ group is no significant different with the normal group. It is probably due to the ANS only partial contribution to the working components of cerebral autoregulation.The patients’ group whom they have the abnormal ANS function in order to maintain CBFV in the specific range, and their vascular resistance have more complicated changes than normal group. In order to avoid syncope by the ischemia, the cerebrovascular have to regulate blood flow of the brain. Therefore, the result of MSE for CBFV is not like BP and the CI of patients’ group is lower than the normal group.
Therefore, a concise summary of this study in the HR part concluded that the ratio of the low frequency power and total power of PSD, and MSE methods are better than DFA to distinguish the different between normal and patients’ group significantly.While the BP and CBFV part, the nMxa of the three stages moving average window is better than the nMxa with all three stages together. Also the analysis of BP data using MSE is better than CBFV data.
ACKNOWLEDGEMENT
This research was partially supported by the Stroke Center and Department of Neurology, National Taiwan University, Taiwan and National Science Council in Taiwan through Grant NSC 99-2221-E-155-046-MY3. This research was also supported by the Center for Dynamical Biomarkers and Translational Medicine, National Central University, Taiwan which is sponsored by National Science Council (NSC101-2911-I-008-001) and Min-Sheng General Hospital Taoyuan,-Taiwan National Taiwan University Hospital Joint Research Program (100-MSN11).
CONFLICT OF INTEREST
The authors confirm that this article content has no conflicts of interest.
REFERENCES
- 1.Thayer J F, Yamamoto S S, Brosschot J F. The relationship of autonomic imbalance heart rate variability and cardiovascular disease risk factors. Int J Cardiol May. 2010;141 (2): 122–131. doi: 10.1016/j.ijcard.2009.09.543. [DOI] [PubMed] [Google Scholar]
- 2.Thayer J F, Åhs F, Fredrikson M, Sollers J J, III Wagere T. D A meta-analysis of heart rate variability and neuroimaging studies: Implications for heart rate variability as a marker of stress and health Neurosci. Biobehav Rev February. 2012;36(2):747–756. doi: 10.1016/j.neubiorev.2011.11.009. [DOI] [PubMed] [Google Scholar]
- 3.Sornmo L, Laguna P. Bioelectrical Signal Processing in Cardiac and Neurological Application. Elsevier Acad Press Amsterdam. 2005 [Google Scholar]
- 4.Tang S C, Huang Y W, Shieh J S, Huang S J, Yip P K, Jeng J. S Dynamic cerebral autorgulation in carotid stenosis before and after carotid stinting J. Vasc Surg July. 2008;48(1):88–92. doi: 10.1016/j.jvs.2008.02.025. [DOI] [PubMed] [Google Scholar]
- 5.Reinhard M, Roth M, Guschlbauer B, Harloff A, Timmer J, Czosnyka M, Hetzel A. Dynamic Cerebral Autoregulation in Acute Ischemic Stroke Assessed From Spontaneous Blood Pressure Fluctuations. Stroke July. 2005;36:1648–1689. doi: 10.1161/01.STR.0000173183.36331.ee. [DOI] [PubMed] [Google Scholar]
- 6.Gupta J, Dube A, Singh V, Gupta RC. Spectral analysis of heart rate variability in bronchial asthma patients Indian. J.Physiol. Pharmacol. . 2012;564:330–336. [PubMed] [Google Scholar]
- 7.Castiglioni P, Parati G, Rienzo M D, Carabalona R, Cividjian L. Q Scale exponents of blood pressure and heart rate during autonomic blockade as assessed by detrended fluctuation analysis . J.Physiol January. 2011;5892:355–369. doi: 10.1113/jphysiol.2010.196428. [DOI] [PMC free article] [PubMed] [Google Scholar]
- 8.Lu CW, Czosnyka M, Shieh JS, Smielewska A, Pickard JD, Smielewski P. Complexity of intracranial pressure correlates with outcome after traumatic brain. injury Brain June. 2012;1358:2399–2408. doi: 10.1093/brain/aws155. [DOI] [PMC free article] [PubMed] [Google Scholar]
- 9.Reinhard M, Roth M, Muller T, Czonyka M, Timmer J, Hetzel A. Cerebral autorgulation in carotid artery occlusive disease assessed from spontaneous blood pressure fluctuations by the correlation coefficient index. Stroke. . 2003;34:2138–2144. doi: 10.1161/01.STR.0000087788.65566.AC. [DOI] [PubMed] [Google Scholar]
- 10.Cleophas TJM, Zwinderman AH. Statistics Applied to Clinical Studies. Springer USA. 2012 [Google Scholar]
- 11.Greenhalgh T. The Basics of Evidence-Based Medicine. John Wiley Sons NY.: 2010. How to Read a Paper. [Google Scholar]


