

Abstract
Correct guidance of the migration of neural progenitor cells (NPCs) is essential for the development and repair of the central nervous system (CNS). Electric field (EF)-guided migration, electrotaxis, has been observed in many cell types. We report here that, in applied EFs of physiological magnitude, embryonic and adult NPCs show marked electrotaxis, which is dependent on the PI3K/Akt pathway. The electrotaxis was also evidenced by ex vivo investigation that transplanted NPCs migrated directionally towards cathode in organotypic spinal cord slice model when treated with EFs. Genetic disruption or pharmacological inhibition of phosphoinositide 3-kinase (PI3K) impaired electrotaxis, whereas EF exposure increased Akt phosphorylation in a growth factor-dependent manner and increased phosphatidylinositol-3,4,5-trisphosphate (PIP3) levels. EF treatments also induced asymmetric redistribution of PIP3, growth factor receptors, and actin cytoskeleton. Electrotaxis in both embryonic and adult NPCs requires epidermal growth factor (EGF) and fibroblast growth factor (FGF). Our results demonstrate the importance of the PI3K/Akt pathway in directed migration of NPCs driven by EFs and growth factors and highlight the potential of EFs to enhance the guidance of various NPC populations in CNS repair therapies.
Keywords: Neural progenitor cells, Electric field, Cell migration, PI3K, Akt, Growth factors
Introduction
Neural stem/progenitor cells (NSCs/NPCs) exhibit various features that make them suitable for CNS repair. Targeting endogenous or transplanted NSCs/NPCs towards damaged areas remains a major challenge; therefore, developing methods for directing cell migration to appropriate locations is of central importance in tissue repair. Here, we have examined the use of EFs to direct NPC migration and the mechanisms and requirements involved. Endogenous EFs control several aspects of cell physiology and play a critical role during CNS development (Borgens and Shi, 1995 and McCaig et al., 2005). In particular, EF-directed cell migration, termed electrotaxis or galvanotaxis, has been demonstrated for a wide variety of cell types (Zhao et al., 2006 and Yao et al., 2008), including neural progenitors from embryonic brain explants (Li et al., 2008). The conditions in which cells display electrotaxis and the participating signaling pathways have been extensively studied. The PI3K/Akt pathway has emerged as a major regulator of electrotaxis as, for example, its genetic disruption or pharmacological inhibition markedly impairs electrotactic migration (Zhao et al., 2006 and Yao et al., 2008). Another important requirement is the growth factors that are usually necessary for electrotaxis to occur (Wang et al., 2003 and Zhao et al., 1996), although exceptions have been reported (Fang et al., 1998 and Pullar et al., 2006). EGF and FGF-2 are among the main growth factors linked to electrotaxis (Zhao et al., 1996 and Zhao et al., 1999), and they play important roles in NPC migration as well (Ciccolini et al., 2005 and Dayer et al., 2007).
In this study, we have investigated the basis for electrotaxis in embryonic NPCs (eNPCs) and adult NPCs (aNPCs). We have explored the involvement of PI3K/Akt signaling and the roles of EGF and FGF-2, as well as the EF-induced asymmetric localization of signaling molecules and actin cytoskeleton previously reported in other cell types (Zhao et al., 2002). Our results suggest an important mechanistic link between growth factors, EFs and PI3K/Akt activation, leading ultimately to directed migration of NPCs.
Materials and methods
Cell culture
The adult rat NPC clone HCN-A94 was maintained as described previously (Gage et al., 1995). eNPCs were cultured from fetal brain tissue of E12-14 day SD rats or mice carrying a deletion of the p110γ subunit of PI3K, using the neurosphere method carried out as described previously (Meng et al., 2007). After at least 5 passages, neurospheres were digested to single cells using trypsin and EDTA and grown on polyornithine/laminin-coated electrotactic chambers as described previously (Zhao et al., 1996). Next day, both eNPCs and aNPCs were fixed by 4% paraformaldehyde for immunofluorescent staining after 5-h EFs stimulation at 250 mV/mm and 500 mV/mm field strength.
Cell migration in EFs and time-lapse imaging
Steady DC EFs in a physiological range up to 500 mV/mm (Borgens and Shi, 1995) were applied to both eNPCs and aNPCs in electrotactic chambers. Time-lapse experiments were performed using a Zeiss Axiovert 100 equipped with a MetaMorph 6.1 imaging system with a motorized X, Y, Z stage (Universal Imaging Corporation, Downingtown, PA) and the images were captured with a digital camera (PDMI-2; Medical System Corp., Greenvale, NY). Cell migration was quantified as described previously (Zhao et al., 1996). The mean directedness of the total cell population was calculated from the formula , where n is the total number of cells and θi is the angle between the vector of cell displacement and the EF vector. Trajectory speed was calculated as the total distance travelled by the cells divided by the travelling time, which dictates the motility of the cells. Displacement speed was calculated as the straight line distance between the start and end points of migrating cells divided by the travelling time, which dictates the efficiency/persistence of directional migration.
Organotypic rat spinal cord slices
Organotypic spinal cord cultures were prepared from the lumbar spinal cords of C57 BL/6 2-week-old mice as described by Stoppini et al. (1991) with minor modifications. In brief, their lumbar spinal cords were dissected. Subsequently, spinal cords were sliced into 500-μm-thick sections with McIlwain tissue chopper (The Mickle Laboratory Engineering Co Ltd., UK). The slices were cultured in a petri dish containing Matrigel (B.D. Biosciences, UK). The spinal cord slice cultures were maintained in a 5% CO2 incubator at 37 °C. The medium containing HEPES buffer (25 mM, Gibco, UK), fetal calf serum (15%, Invitrogen, UK), and DMEM/F-12 (Invitrogen, UK) was exchanged twice weekly.
Injection of Hoechst labeled NPCs into organotypic spinal cord slice
We prepared the NPC suspension at 1 × 10⁶ cells/μl, followed by pre-incubation in 5 μM Hoechst 33342 containing medium for 30 min. 2 μl of the suspension was injected into the spinal cord slice slowly. Subsequently, we applied 500 mV/mm EFs to the spinal cord slices containing Hoechst labeled NPCs in electrotactic chambers. Time-lapse experiments were performed using DeltaVision imaging system (Imosol Image Solutions, UK) to record the cell migration behaviors in the ex vivo spinal cord slice model at a single cell level.
Western blotting analysis
Cells were either starved in B27 medium without growth factors for minimum 3 h or plated in medium containing both EGF and FGF before EF stimulation. After EF application for 1 h, cells (~ 2.5 × 10⁶) were lysed in 200 μl SDS sample buffer. Cell extracts were resolved on 4 –12% Bis–Tris gels and transferred onto nitrocellulose membranes. Antibodies used were against total (rabbit polyclonal antibody; 1:200) and a phosphorylated epitope (Ser473) of Akt (rabbit polyclonal antibody; 1:500, both from Cell Signaling, Beverly, MA). Gel analysis function of ImageJ software was used to quantify the phosphorylated epitope of Akt (NIH, USA).
Immunofluorescent analysis
NPCs were fixed with 4% paraformaldehyde for 20 min, permeabilized with 0.2% TritonX-100 for 10 min, and incubated in blocking solution (1% BSA in PBS) for 30 min before incubation with primary antibodies at 4 °C overnight. After extensive washing with blocking solution, cells were incubated with secondary antibodies at 37 °C for 1 h, washed and mounted in Vectashield mounting medium with DAPI (Vector Laboratories, Peterborough, UK). All antibodies were diluted in blocking solution. Primary antibodies used were mouse monoclonal anti-nestin (1:200; Abcam, Cambridge, UK); rabbit polyclonal anti-EGF receptor (1:30), mouse monoclonal anti-phospho-EGF receptor (Tyr1068; 1:200), rabbit polyclonal anti-FGF receptor1 (1:30) and mouse monoclonal anti-phospho-FGF receptor (Tyr 653/654; 1:30; all from Cell Signaling, Beverly, MA); mouse monoclonal anti-PIP3 IgM (1:100; Echelon, UK) and mouse monoclonal anti-actin FITC conjugate clone (1:50; Sigma-Aldrich, UK). Secondary antibodies were FITC-conjugated goat anti-mouse and anti-rabbit and Cy3-conjugated goat anti-mouse IgM (all 1:200; Jackson ImmunoResearch, UK).
Flow cytometry analysis
Cells were fixed at room temperature for 10 min, permeabilized with 500 μ l flow cytometry permeabilization buffer, and incubated with mouse anti-nestin monoclonal antibody (1:50; Abcam, Cambridge, UK) for 30 min on ice. After extensive washing with blocking solution, cells were incubated with FITC-conjugated secondary antibody on ice for 30 min. Excess antibody was removed by several washing, before the cells were re-suspended as the final pellet in 500 μl staining buffer for flow cytometric analysis (The Becton Dickinson Four Colour FACSCaliburs 14519 and 14520, UK).
Results
Embryonic and adult neural progenitor cells show directed migration in EFs either in vitro or ex vivo
Previous studies demonstrated that nestin-positive cells we obtained from neurosphere culture of E12 – 14 day fetal brain are neural stem/progenitor cells, which has been confirmed by their proliferation and multipotential differentiation properties (Meng et al., 2007). We showed that the aNPC and eNPC populations used in this study were mostly nestin-positive and that 5-h EF treatment did not affect nestin expression rate, which were confirmed by the nestin staining and flow cytometry (FACS) analysis both before and after EF stimulation (Suppl. Fig. 1A-F). When both cell types were exposed to a range of physiological EFs in the presence of EGF and FGF-2 (Borgens and Shi, 1995), both eNPCs (Fig. 1B, E) and aNPCs (Fig. 1C, F) showed highly directed cell migration towards the cathode (Fig. 1H; Suppl. Movie 1 and Suppl. Movie 2). In situ immunocytochemical staining after EF stimulation further confirmed that cells showing obvious electrotaxis are nestin-positive NPCs (Suppl. Movie 3 and Suppl. Fig. 1G-I). EF control of cell migration was also evidenced by the fact that reversal of the EF vector elicited an immediate, sharp reversal in the direction of migration (Fig. 1G; Suppl. Movie 4). The same observation was also recorded on single cells not in physical contact with surrounding cells, suggesting that EFs regulate the cell motility at the single cell level directly rather than through modulation of cell–cell interactions indirectly (Suppl. Movie 3 and Suppl. Movie 5). EFs markedly increased cell speed as well in a voltage-dependent manner (Suppl. Fig. 2A and B).
Fig. 1. eNPCs and aNPCs show directed migration in EFs.

(A–C) Migration of eNPCs (A, B) and aNPCs (C) in the absence (A) or presence of EFs (B, C). Red lines and blue arrows represent trajectories and direction of cell movement. (D–F) Migration paths of a group cells plotted as if all starting from the origin position, either without EFs (D), or in 500 mV/mm (E and F showed migration paths of eNPCs and aNPCs separately). Red cross in D–F represents the center of mass of all cells ending positions, which indicates to which extent directed cell migration occurred in terms of direction and efficiency. (G) Directedness as a function of time, showing a sharp reversal in direction of migration after EF polarity, is reversed (arrow). Electrotactic response increased significantly at 10 min post EFs stimulation, and maximized at ~ 30 min of EF treatment. (H) Directedness as a function of EF strength. Scale bar: 50 μm.
We further transplanted eNPCs into organotypic spinal cord slice ex vivo model to detect whether NPCs still show electrotaxis in an environment mimicking in vivo condition. Spinal cord slice is one of the ideal recipient tissues to study NPCs ex vivo behaviors post transplantation, because the cytoarchitectonic tissue organization is well preserved within these cultures, and spinal cord slice ex vivo model also allows procedures that are not technically feasible to track cells in vivo using time-lapse recording at a single cell level. eNPCs showed highly directed migration towards cathode in spinal cord slice, reversing EF polarity triggered a sharp reversal of electrotactic response of those cells (Fig. 2; Suppl. Movie 6), very similar to what they have shown in vitro.
Fig. 2. eNPCs transplanted into spinal cord slice also show directed migration in EFs ex vivo.
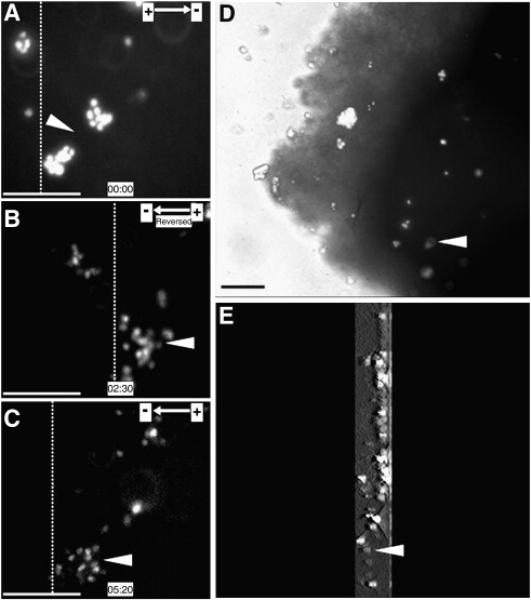
(A) NPCs labeled with Hoechst 33342 were transplanted into organotypic spinal cord slice at the starting point of the EF treatment. NPCs migrated directionally towards cathode for 2.5 h, at which point the EF polarity was reversed (B). Reversing EF polarity triggered a sharp reversal of electrotaxis towards the EF vector (C). (D) Photograph for spinal cord slice when time-lapse recording finished. (E) The 3D reconstruction for spinal cord slice when time-lapse recording finished. 3D scanning was 300-μm thickness and started form middle of slice and ended to the bottom of slice. Dotted lines indicate the relative positions of the same population of transplanted cells at the beginning, reversing, and ending points of the EF treatment (A–C, respectively). Arrow heads indicate the same population of Hoechst 33342-labeled NPCs. Scale bar: 50 μm.
PI3K inhibition or genetic deletion impairs NPC electrotaxis, and EF exposure upregulates PIP3 levels and Akt phosphorylation
To assess the importance of PI3K signaling in eNPC and aNPC electrotaxis, we pre-incubated both cell types with the PI3K inhibitor LY294002 (50 μM) for 1 h before EF exposure. This treatment effected a pronounced reduction in directed migration of eNPCs and aNPCs, as well as a decrease in speed (Fig. 3A: *P < 0.05, Student’s T test; Suppl. Fig. 2C and D; Suppl. Movie 7). We also examined the effect of genetic disruption of PI3K pathway by obtaining eNPCs from mice carrying a deletion of the p110γ subunit of PI3K (Zhao et al., 2006). Unlike wild-type counterparts, these cells showed significantly reduced directional migration in EFs (Fig. 3B-F: *P < 0.05 compared between wild-type and p110γ−/−NPCs, Student’s T test; and Suppl. Movie 8). P110γ−/−NPCs also reduced both trajectory and displacement speed after EFs were applied (Suppl. Fig. 2E and F).
Fig. 3. Pharmacological inhibition or genetic disruption of PI3K impairs NPC electrotaxis.
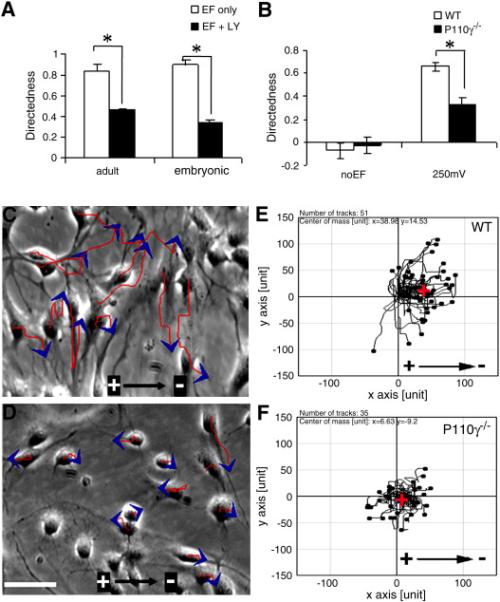
(A) Directedness of eNPCs and aNPCs in the presence or absence of PI3K inhibitor LY294002 (50 μM). (B) Directedness of wild-type and P110γ−/− mouse eNPCs in the presence or absence of EF stimulation. (C–F) Migration of wild-type (C, E) and P110γ−/− mice eNPCs (D, F) in EFs. Red lines and blue arrows represent trajectories and direction of cell movement. Red cross in E and F represents the center of mass of all cells ending positions, which indicates the direction and efficiency of the directional cell migration. *P < 0.05. Scale bar: 50 μm.
PIP3 is a key effector of PI3K in chemotaxis, during which it localizes to the leading edge of the cell and its level increases (Kolsch et al., 2008 and Eberle et al., 1990). PIP3 expression was detected on both eNPCs and aNPCs before and after EF stimulation, and cell fluorescence-integrated intensity was measured as an indicator of PIP3 levels. A marked increase was observed in average cell fluorescence after an EF was applied for both aNPCs (Fig. 4A, B, and H) and eNPCs (Fig. 4C, D, and G). Phosphorylation of Akt was used as another indicator of PI3K activity. In the absence of both EGF and FGF-2, EF-treated eNPCs showed a slight increase of phospho-Akt level compared with no EF control. In contrast, in the presence of both EGF and FGF-2, EF-treated eNPCs showed significantly upregulated phospho-Akt expression compared with no growth factor group (Fig. 4I and Suppl. Fig. 2G). Furthermore, PI3K inhibition with LY294002 showed a marked reduction of phopho-Akt, even in the presence of both EGF/FGF-2 and EF stimulation (Fig. 4I and Suppl. Fig. 2G). These results therefore indicate that the PI3K/Akt pathway is a key component of the signaling cascade of electrotaxis in NPCs.
Fig. 4. PIP3 asymmetric redistribution, co-localization with actin, and Akt phosphorylation after EF exposure.
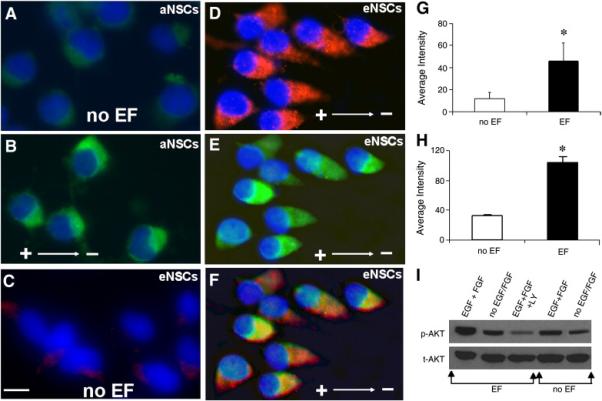
(A–D) PIP3 localization before (A, C) and after (B, D) EF exposure in aNPCs (A, B) and eNPCs (C, D). (E) Actin localization after EF exposure in eNPCs. (F) Merge of D and E, showing co-localization of PIP3 and actin at the leading edge after EF exposure. (G, H) Average fluorescence intensity for PIP3 before and after EF exposure in eNPCs and aNPCs, respectively. (I) Western blotting analysis of Akt phosphorylation (p-AKT) in eNPCs before and after EF exposure. Total Akt (t-AKT) was used as loading control. *P < 0.05. Scale bar: 10 μm.
EFs induce redistribution of signaling molecules and actin cytoskeleton
The asymmetric redistribution of signaling molecules and cytoskeletal structures towards the cathode-facing side of the cell occurred rapidly after EF exposure, with growth factor receptors in particular redistributing markedly (Zhao et al., 1999 and Zhao et al., 2002). In eNPCs exposed to EFs, the EGF receptor (EGFR) redistributed and concentrated cathodally (Fig. 5A). When antibodies specific for a phosphorylation site in EGFR were used, the same redistribution was observed (Fig. 5B), indicating that polarized signaling by EGFR was occurring in eNPCs exposed to EFs. When cells were stained with an antibody against a phosphorylated epitope common to all FGF receptors, the resulting signal was localized to the nucleus and EF exposure markedly increased the intensity of the signal in eNPCs (Fig. 5C-E), suggesting that EFs promote FGF receptor activation. EFs also triggered PIP3 (Fig. 4B and D) and actin (Fig. 4E) asymmetric redistribution towards the cathode, which co-localized precisely in the leading edge of NPCs (Fig. 4F).
Fig. 5. EF-induced asymmetric redistribution of growth factor receptors in eNPCs.

A and B: EGFR (A) and phospho-EGFR (B) asymmetric redistribution after EF exposure in eNPCs. Nuclei were counterstained with DAPI. C and D: phospho-FGFR before (C) and after (D) EF exposure in eNPCs. E: average cell fluorescence for phospho-FGFR before and after EF exposure. EF-induced asymmetric lamellipodia protrusion maintained the formation of the leading edge towards cathode, and reversing EF vector elicited an immediate reversal of the protrusion to accommodate the persistent directional cell migration in EF (F and G). *P < 0.05. Scale bar: 10 μm.
To evaluate how rapidly the asymmetric redistribution occurs after EF stimulation, cells were stained with EGFR, phosphorylated EGFR and actin at various time points of 30 s, 1 and 5 min post EF stimulation. The results showed that an obvious asymmetric redistribution was observed as early as 1 min after EF exposure (Suppl. Fig. 3A-C). Reversing the polarity of the EF vector triggered an immediate reversal of lamellipodia protrusion that maintained the orientation of the leading edge of electrotaxing cells (Fig. 5. F and G, Suppl. Movie 5).
Both eNPCs and aNPCs require growth factors for electrotaxis
Both EGF and FGF-2 have been shown to be important regulators of migration of NPCs, and they are also important for electrotaxis in many cell types. We therefore sought to establish whether these growth factors are required for electrotaxis of eNPCs and aNPCs. In both eNPCs and aNPCs, withdrawal of both growth factors significantly reduced the EF-induced directional migration response (Fig. 6, P < 0.05, Student’s T test), suggesting that both growth factors are necessary for electrotaxis of NPCs.
Fig. 6. Growth factor requirements for eNPC and aNPC electrotaxis.
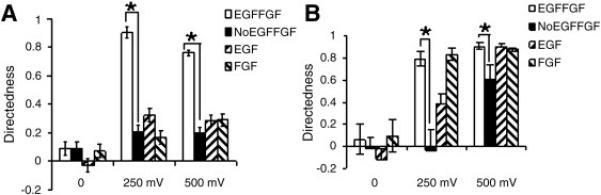
Directedness of electrotaxis in the presence of different growth factor combinations for eNPCs (A) and aNPCs (B). *P < 0.05. Student’s T test.
Interestingly, addition of FGF-2 alone could restore completely the electrotactic response of aNPCs, both at lower and higher EF strengths. EGF addition restored electrotaxis of aNPCs only at the higher EF (Fig. 6B), suggesting potential different requirement of growth factors on the regulation of eNPCs and aNPCs electrotaxis. Growth factor withdrawal greatly reduced cell speed, blunting the EF-induced increase. Separate addition of either EGF or FGF-2 partially restored speed increase in eNPCs, whereas in aNPCs, only separate addition of EGF increased cell speed after EF exposure (Suppl. Fig. 4).
Discussion
We have reported here the importance of the PI3K/Akt pathway, as well as that of different growth factor requirements, for the electrotactic migration of eNPCs and aNPCs. We first confirmed that short-time EF stimulation did not affect cell fate in either eNPCs or aNPCs populations, since most of the cells are nestin-positive after 5 h of applied EFs up to 500 mV/mm in vitro. Both cell types showed remarkable directional migration in EFs of physiological magnitude, demonstrating the importance of EFs as directional cues for migration of NPCs. The identical electrotactic response of NPCs was also recorded on single cells, suggesting electrotaxis applies to single cells directly rather than through cell-cell interaction indirectly. EFs greatly increased cell speed as well, as previously reported in explant cultures of rat embryonic brain (Li et al., 2008). The degree of directedness of NPCs is similar to, or greater than, that of differentiated cell types such as corneal epithelial cells, keratinocytes or neutrophils (Zhao et al., 1996, Pullar et al., 2006 and Zhao et al., 2006). In these cell types, one of the postulated functions of the response to EFs in vivo is enhancing wound healing, as it has been shown that wounded tissues generate endogenous EFs, which can be manipulated to increase the rate of healing by regulating cell migration and division (Song et al., 2002, Reid et al., 2005, McCaig et al., 2005 and Zhao et al., 2006). Whether the in vitro electrotactic response of NPCs can have an in vivo correlate is not clear, although there are pieces of evidence that NPCs are exposed to EFs during development of the CNS (Borgens and Shi, 1995), suggesting that such a correlate might be possible. Organotypic spinal cord slice culture is a very useful model, which not only mimics in vivo environment since the cytoarchitectonic tissue organization is well preserved within these cultures but also allows procedures that are not presently feasible to track cells at a single cell level in vivo using time-lapse recording (Bonnici and Kapfhammer, 2008 and Shichinohe et al., 2008). eNPCs demonstrated highly directed migration towards cathode in a 3D environment of spinal cord slice model as they showed in 2D in vitro.
The molecules and signaling pathways that control electrotaxis are diverse and include calcium and sodium channels (Mycielska and Djamgoz, 2004), cyclic AMP (Pullar et al., 2001) and several kinase cascades (Zhao et al., 2006). Among them, the PI3K/Akt pathway in particular has been linked to the electrotactic response of several cell types. We have extended these results to NPCs, showing that pharmacological inhibition or genetic disruption of this pathway markedly impairs their migration in EFs. Furthermore, EFs increased the activity of this pathway in NPCs, as demonstrated by increased Akt phosphorylation and PIP3 fluorescence after EF exposure. EFs also triggered the redistribution of PIP3 and co-localization with actin at the leading edge, in agreement with previous results (Zhao et al., 2006), supporting the notion that PIP3 plays a role in sensing electric gradients (Huttenlocher and Horwitz, 2007). The activation of the PI3K/Akt pathway by EFs might have additional effects besides promoting NPC migration. For instance, increased Akt activation has been linked to increased proliferation of NPCs (Holland et al., 2000 and Groszer et al., 2001), and EFs have been shown to influence the proliferative response of neural progenitors (McCaig et al., 2005). It is therefore conceivable that EFs could be used to control and coordinate multiple responses of NPCs through their effects on the PI3K/Akt pathway.
In eNPCs, EF-induced increase in Akt phosphorylation required EGF and FGF-2, which was evidenced by a significantly upregulated Akt phosphorylation in the presence of both growth factors, pointing to a mechanistic link between these growth factors, EFs, and PI3K/Akt pathway activation. This further evidenced that withdrawal of both growth factors significantly reduced the directional migration response in NPCs even at the highest EF treatment, suggesting that both EGF and FGF are required in the regulation of NPCs electrotaxis, although it remains elusive that either EGF or FGF supplement was sufficient to maintain electrotactic response of aNPCs at the highest EF. Moreover, EFs induced activation and nuclear translocation of FGF receptors and promoted activated EGFR redistribution to the leading edge. Previous work has shown that EGFR redistribution induced by EFs requires autophosphorylation of the receptor, which, along with the presence of EGF, is also necessary for electrotaxis (Fang et al., 1999 and Zhao et al., 1999), suggesting that EGF and EFs act in cooperation to promote polarized signaling. In the case of FGF receptors, a mechanistic link between FGF-2 binding and activation of the receptor at the plasma membrane and subsequent translocation to the nucleus has been established (Maher, 1996 and Bryant et al., 2005). Our results with FGF receptors suggest that EFs enhance this process, perhaps by increasing the activation of FGF receptors induced by FGF-2 at the plasma membrane. Subsequent to the activation of growth factor receptors, the PI3K/Akt pathway, one of the main targets of growth factor receptor signaling (Hawkins et al., 2006), would in turn become activated.
Taken together, both FGF-2 and EGF mediate activation of the PI3K/Akt pathway in NPCs (Peltier et al., 2007 and Nelson et al., 2008), and our results proved the importance of this activation for electrotaxis, which suggests a model where EFs and growth factors interact to enhance the activation of the PI3K/Akt pathway through a cooperative increase in growth factor receptor signaling.
The PI3K/Akt pathway, EGF and FGF-2 have all been shown to be important regulators of migration of NPCs (Ciccolini et al., 2005, Dayer et al., 2007 and Kendall et al., 2008). Potential clinical applications of these observations have included EGFR and FGF-2 over-expression in neural progenitors to improve efficiency of migration after transplantation (Aguirre et al., 2005 and Dayer et al., 2007) and administration of FGF-2 to promote migration of endogenous precursors into damaged areas of the brain (Jin et al., 2005). Here, we have extended the importance for NPC migration of the PI3K/Akt pathway and EGF and FGF-2 to the phenomenon of electrotaxis. A future step towards the application of EFs in CNS repair therapies would be therefore to assess how different age, region, or species of origin of NPCs impacts on their electrotactic response.
Supplementary Material
EF does not affect the nestin expression of eNPCs. In comparison with the control group (A), a similar proportion of nestin-positive cells was observed within EF stimulated eNPCs group (B) after applying 500 mV/mm EF for 5 h (C). Cells in the absence (E) or presence (F) of EF stimulation also showed identical nestin-positive rate under the FACS analysis, and cells labeled with FITC-conjugated secondary antibody alone are represented as negative control to eliminate the non-specific staining (D). Cells showing directed migration towards cathode (see Suppl Movie 3) were fixed immediately after 5 h of 500 mV/mm EF application (G), followed by in situ nestin staining to confirm that the cells showing electrotaxis were indeed nestin-positive cells (H). I is merged image of G and H. Scale bar: 10 μm.
Trajectory and displacement speed of eNPCs, aNPCs, and NPCs with disrupted PI3K signaling. (A, B) Speed as a function of EF strength of eNPCs (A) and aNPCs (B). (C, D) Speed of eNPCs pre-treated with the PI3K inhibitor LY294002 before and after EF exposure. (E, F) Speed of wild-type and P110γ−/− mouse eNPCs in EFs. (G) Quantitative measurements of Western blotting analysis for p-Akt. *P <0.05, Student's T test.
The asymmetric redistribution of EGFR (A), p-EGFR (B), and actin (C) were detected as early as 1 min after EF exposure. Scale bar: 10 μm.
Trajectory and displacement speed of aNPCs and eNPCs in media with different growth factor combinations. Trajectory speed (A, B) and displacement speed (C, D) in the presence of different growth factor combinations for eNPCs (A, C) and aNPCs (B, D).
eNPC migration in the absence or presence of EFs. eNPCs showed random migration in the absence of EFs (A, B), and highly directed migration towards the cathode with EFs (C, D). B and D are animations of migration paths of a group of cells plotted as if all started from the origin position, without (B) and with EFs (D). Scale bar = 50 μm. Frame interval = 5 min.
aNPC migration in the absence (A, B) or presence (C, D) of EFs. Scale bar = 50 μm. Frame interval = 5 min.
Single cells which were carried out in situ nestin staining after EF stimulation showing directed migration towards the cathode in EF. Scale bar = 10 μm. Frame interval = 3 min.
Reversal of migration direction after reversal of EF polarity. The image is frozen at the moment of EF reversal to highlight it, after which the sequence resumes. Scale bar = 50 μm. Frame interval = 5 min.
EF trigged redistribution was also confirmed by the fact that reversal of the EF vector triggered an immediate reversal of protrusion that maintains the orientation of the leading edge. Scale bar = 10 μm. Frame interval = 6 min.
Time-lapse recorded transplanted eNPCs directed migration in the spinal cord slice which an environment mimicking in vivo condition. eNPCs show highly directed migration towards cathode in spinal cord slice as they presented in vitro. Scale bar = 10 μm. Frame interval = 3 min.
Migration of eNPCs pre-treated with the PI3K inhibitor LY294002 before EF exposure. Scale bar = 50 μm. Frame interval = 5 min.
Migration of wild-type (A, B) and P110γ−/− mouse eNPCs (C, D) in EFs. Scale bar = 50 μm. Frame interval = 5 min.
Research highlights.
EFs control directed migration of neural progenitor cells in 2D and 3D environment.
PI3K/Akt pathway mediates electrotaxis of neural progenitor cells.
EFs trigger the asymmetric redistribution of signals.
Growth factors are partially required for electrotaxis of neural progenitor cells.
Acknowledgments
We are grateful for Dr. C. McCaig for the administrative support and helpful discussion. This work was supported by the Royal Society URF grant UF051616, UF090098 UK, Wellcome Trust grant 082887 and European Research Council StG grant 243261 to B.S., and Alban studentship E07D400602UY to M.A.
M.Z. is supported by grants from California Institute of Regenerative Medicine (RB1-01417), NIH (1R01EY019101), NSF (MCB-0951199), and in part by an Unrestricted Grant from Research to Prevent Blindness to the University of California Davis Department of Ophthalmology and Vision Science.
References
- Aguirre A, Rizvi TA, Ratner N, Gallo V. Overexpression of the epidermal growth factor receptor confers migratory properties to nonmigratory postnatal neural progenitors. J. Neurosci. 2005;25:11092–11106. doi: 10.1523/JNEUROSCI.2981-05.2005. [DOI] [PMC free article] [PubMed] [Google Scholar]
- Borgens RB, Jaffe LF, Cohen MJ. Large and persistent electrical currents enter the transected lamprey spinal cord. Proc Natl Acad Sci USA. 1980;77:1209–1213. doi: 10.1073/pnas.77.2.1209. [DOI] [PMC free article] [PubMed] [Google Scholar]
- Borgens RB, Roederer E, Cohen MJ. Enhanced spinal cord regeneration in lamprey by applied electric fields. Science. 1981;213:611–617. doi: 10.1126/science.7256258. [DOI] [PubMed] [Google Scholar]
- Borgens RB, Shi R. Uncoupling histogenesis from morphogenesis in the vertebrate embryo by collapse of the transneural tube potential. Dev. Dyn. 1995;203:456–467. doi: 10.1002/aja.1002030408. [DOI] [PubMed] [Google Scholar]
- Bryant DM, Wylie FG, Stow JL. Regulation of endocytosis, nuclear translocation, and signaling of fibroblast growth factor receptor 1 by E-cadherin. Mol. Biol. Cell. 2005;16:14–23. doi: 10.1091/mbc.E04-09-0845. [DOI] [PMC free article] [PubMed] [Google Scholar]
- Ciccolini F, Mandl C, Holzl-Wenig G, Kehlenbach A, Hellwig A. Prospective isolation of late development multipotent precursors whose migration is promoted by EGFR. Dev. Biol. 2005;284:112–125. doi: 10.1016/j.ydbio.2005.05.007. [DOI] [PubMed] [Google Scholar]
- Dayer AG, Jenny B, Sauvain MO, Potter G, Salmon P, Zgraggen E, Kanemitsu M, Gascon E, Sizonenko S, Trono D, Kiss JZ. Expression of FGF-2 in neural progenitor cells enhances their potential for cellular brain repair in the rodent cortex. Brain. 2007;130:2962–2976. doi: 10.1093/brain/awm200. [DOI] [PubMed] [Google Scholar]
- Eberle M, Traynor-Kaplan AE, Sklar LA, Norgauer J. Is there a relationship between phosphatidylinositol trisphosphate and F-actin polymerization in human neutrophils? J. Biol. Chem. 1990;265:16725–16728. [PubMed] [Google Scholar]
- Fang KS, Farboud B, Nuccitelli R, Isseroff RR. Migration of human keratinocytes in electric fields requires growth factors and extracellular calcium. J. Invest. Dermatol. 1998;111:751–756. doi: 10.1046/j.1523-1747.1998.00366.x. [DOI] [PubMed] [Google Scholar]
- Fang KS, Ionides E, Oster G, Nuccitelli R, Isseroff RR. Epidermal growth factor receptor relocalization and kinase activity are necessary for directional migration of keratinocytes in DC electric fields. J. Cell. Sci. 1999;112(Pt 12):1967–1978. doi: 10.1242/jcs.112.12.1967. [DOI] [PubMed] [Google Scholar]
- Gage FH, Coates PW, Palmer TD, Kuhn HG, Fisher LJ, Suhonen JO, Peterson DA, Suhr ST, Ray J. Survival and differentiation of adult neuronal progenitor cells transplanted to the adult brain. Proc. Natl. Acad. Sci. U. S. A. 1995;92:11879–11883. doi: 10.1073/pnas.92.25.11879. [DOI] [PMC free article] [PubMed] [Google Scholar]
- Groszer M, Erickson R, Scripture-Adams DD, Lesche R, Trumpp A, Zack JA, Kornblum HI, Liu X, Wu H. Negative regulation of neural stem/progenitor cell proliferation by the Pten tumor suppressor gene in vivo. Science. 2001;294:2186–2189. doi: 10.1126/science.1065518. [DOI] [PubMed] [Google Scholar]
- Hawkins PT, Anderson KE, Davidson K, Stephens LR. Signalling through Class I PI3Ks in mammalian cells. Biochem. Soc. Trans. 2006;34:647–662. doi: 10.1042/BST0340647. [DOI] [PubMed] [Google Scholar]
- Holland EC, Celestino J, Dai C, Schaefer L, Sawaya RE, Fuller GN. Combined activation of Ras and Akt in neural progenitors induces glioblastoma formation in mice. Nat. Genet. 2000;25:55–57. doi: 10.1038/75596. [DOI] [PubMed] [Google Scholar]
- Huttenlocher A, Horwitz AR. Wound healing with electric potential. N. Engl. J. Med. 2007;356:303–304. doi: 10.1056/NEJMcibr066496. [DOI] [PubMed] [Google Scholar]
- Jin K, LaFevre-Bernt M, Sun Y, Chen S, Gafni J, Crippen D, Logvinova A, Ross CA, Greenberg DA, Ellerby LM. FGF-2 promotes neurogenesis and neuroprotection and prolongs survival in a transgenic mouse model of Huntington’s disease. Proc. Natl. Acad. Sci. U. S. A. 2005;102:18189–18194. doi: 10.1073/pnas.0506375102. [DOI] [PMC free article] [PubMed] [Google Scholar]
- Kendall SE, Najbauer J, Johnston HF, Metz MZ, Li S, Bowers M, Garcia E, Kim SU, Barish ME, Aboody KS, Glackin CA. Neural stem cell targeting of glioma is dependent on phosphoinositide 3-kinase signaling. Stem Cells. 2008;26:1575–1586. doi: 10.1634/stemcells.2007-0887. [DOI] [PubMed] [Google Scholar]
- Kolsch V, Charest PG, Firtel RA. The regulation of cell motility and chemotaxis by phospholipid signaling. J. Cell. Sci. 2008;121:551–559. doi: 10.1242/jcs.023333. [DOI] [PMC free article] [PubMed] [Google Scholar]
- Li L, El-Hayek YH, Liu B, Chen Y, Gomez E, Wu X, Ning K, Li L, Chang N, Zhang L, Wang Z, Hu X, Wan Q. Direct-current electrical field guides neuronal stem/progenitor cell migration. Stem Cells. 2008;26:2193–2200. doi: 10.1634/stemcells.2007-1022. [DOI] [PubMed] [Google Scholar]
- Maher PA. Nuclear Translocation of fibroblast growth factor (FGF) receptors in response to FGF-2. J. Cell Biol. 1996;134:529–536. doi: 10.1083/jcb.134.2.529. [DOI] [PMC free article] [PubMed] [Google Scholar]
- McCaig CD, Rajnicek AM, Song B, Zhao M. Controlling cell behavior electrically: current views and future potential. Physiol. Rev. 2005;85:943–978. doi: 10.1152/physrev.00020.2004. [DOI] [PubMed] [Google Scholar]
- Meng XT, Chen D, Dong ZY, Liu JM. Enhanced neural differentiation of neural stem cells and neurite growth by amniotic epithelial cell co-culture. Cell Biol. Int. 2007;31:691–698. doi: 10.1016/j.cellbi.2006.11.038. [DOI] [PubMed] [Google Scholar]
- Mycielska ME, Djamgoz MB. Cellular mechanisms of direct-current electric field effects: galvanotaxis and metastatic disease. J. Cell. Sci. 2004;117:1631–1639. doi: 10.1242/jcs.01125. [DOI] [PubMed] [Google Scholar]
- Nelson AD, Suzuki M, Svendsen CN. A high concentration of epidermal growth factor increases the growth and survival of neurogenic radial glial cells within human neurosphere cultures. Stem Cells. 2008;26:348–355. doi: 10.1634/stemcells.2007-0299. [DOI] [PubMed] [Google Scholar]
- Peltier J, O’Neill A, Schaffer DV. PI3K/Akt and CREB regulate adult neural hippocampal progenitor proliferation and differentiation. Dev. Neurobiol. 2007;67:1348–1361. doi: 10.1002/dneu.20506. [DOI] [PubMed] [Google Scholar]
- Pullar CE, Isseroff RR, Nuccitelli R. Cyclic AMP-dependent protein kinase A plays a role in the directed migration of human keratinocytes in a DC electric field. Cell Motil Cytoskeleton. 2001;50:207–217. doi: 10.1002/cm.10009. [DOI] [PubMed] [Google Scholar]
- Pullar CE, Baier BS, Kariya Y, Russell AJ, Horst BA, Marinkovich MP, Isseroff RR. beta4 integrin and epidermal growth factor coordinately regulate electric field-mediated directional migration via Rac1. Mol. Biol. Cell. 2006;17:4925–4935. doi: 10.1091/mbc.E06-05-0433. [DOI] [PMC free article] [PubMed] [Google Scholar]
- Reid B, Song B, McCaig CD, Zhao M. Wound healing in rat cornea: the role of electric currents. FASEB J. 2005;19:379–386. doi: 10.1096/fj.04-2325com. [DOI] [PMC free article] [PubMed] [Google Scholar]
- Reid B, Nuccitelli R, Zhao M. Non-invasive measurement of bioelectric currents with a vibrating probe. Nat Protoc. 2007;2:661–669. doi: 10.1038/nprot.2007.91. [DOI] [PubMed] [Google Scholar]
- Song B, Zhao M, Forrester JV, McCaig CD. Electrical cues regulate the orientation and frequency of cell division and the rate of wound healing in vivo. Proc. Natl. Acad. Sci. U. S. A. 2002;99:13577–13582. doi: 10.1073/pnas.202235299. [DOI] [PMC free article] [PubMed] [Google Scholar]
- Wang E, Zhao M, Forrester JV, McCaig CD. Bi-directional migration of lens epithelial cells in a physiological electrical field. Exp. Eye Res. 2003;76:29–37. doi: 10.1016/s0014-4835(02)00257-9. [DOI] [PubMed] [Google Scholar]
- Yao L, Shanley L, McCaig C, Zhao M. Small applied electric fields guide migration of hippocampal neurons. J. Cell. Physiol. 2008;216:527–535. doi: 10.1002/jcp.21431. [DOI] [PubMed] [Google Scholar]
- Zhao M, Pu J, Forrester JV, McCaig CD. Membrane lipids, EGF receptors, and intracellular signals colocalize and are polarized in epithelial cells moving directionally in a physiological electric field. FASEB J. 2002;16:857–859. doi: 10.1096/fj.01-0811fje. [DOI] [PubMed] [Google Scholar]
- Zhao M, Dick A, Forrester JV, McCaig CD. Electric field-directed cell motility involves up-regulated expression and asymmetric redistribution of the epidermal growth factor receptors and is enhanced by fibronectin and laminin. Mol. Biol. Cell. 1999;10:1259–1276. doi: 10.1091/mbc.10.4.1259. [DOI] [PMC free article] [PubMed] [Google Scholar]
- Zhao M, Agius-Fernandez A, Forrester JV, McCaig CD. Orientation and directed migration of cultured corneal epithelial cells in small electric fields are serum dependent. J. Cell. Sci. 1996;109(Pt 6):1405–1414. doi: 10.1242/jcs.109.6.1405. [DOI] [PubMed] [Google Scholar]
- Zhao M, Song B, Pu J, Wada T, Reid B, Tai G, Wang F, Guo A, Walczysko P, Gu Y, Sasaki T, Suzuki A, Forrester JV, Bourne HR, Devreotes PN, McCaig CD, Penninger JM. Electrical signals control wound healing through phosphatidylinositol-3-OH kinase-gamma and PTEN. Nature. 2006;442:457–460. doi: 10.1038/nature04925. [DOI] [PubMed] [Google Scholar]
Associated Data
This section collects any data citations, data availability statements, or supplementary materials included in this article.
Supplementary Materials
EF does not affect the nestin expression of eNPCs. In comparison with the control group (A), a similar proportion of nestin-positive cells was observed within EF stimulated eNPCs group (B) after applying 500 mV/mm EF for 5 h (C). Cells in the absence (E) or presence (F) of EF stimulation also showed identical nestin-positive rate under the FACS analysis, and cells labeled with FITC-conjugated secondary antibody alone are represented as negative control to eliminate the non-specific staining (D). Cells showing directed migration towards cathode (see Suppl Movie 3) were fixed immediately after 5 h of 500 mV/mm EF application (G), followed by in situ nestin staining to confirm that the cells showing electrotaxis were indeed nestin-positive cells (H). I is merged image of G and H. Scale bar: 10 μm.
Trajectory and displacement speed of eNPCs, aNPCs, and NPCs with disrupted PI3K signaling. (A, B) Speed as a function of EF strength of eNPCs (A) and aNPCs (B). (C, D) Speed of eNPCs pre-treated with the PI3K inhibitor LY294002 before and after EF exposure. (E, F) Speed of wild-type and P110γ−/− mouse eNPCs in EFs. (G) Quantitative measurements of Western blotting analysis for p-Akt. *P <0.05, Student's T test.
The asymmetric redistribution of EGFR (A), p-EGFR (B), and actin (C) were detected as early as 1 min after EF exposure. Scale bar: 10 μm.
Trajectory and displacement speed of aNPCs and eNPCs in media with different growth factor combinations. Trajectory speed (A, B) and displacement speed (C, D) in the presence of different growth factor combinations for eNPCs (A, C) and aNPCs (B, D).
eNPC migration in the absence or presence of EFs. eNPCs showed random migration in the absence of EFs (A, B), and highly directed migration towards the cathode with EFs (C, D). B and D are animations of migration paths of a group of cells plotted as if all started from the origin position, without (B) and with EFs (D). Scale bar = 50 μm. Frame interval = 5 min.
aNPC migration in the absence (A, B) or presence (C, D) of EFs. Scale bar = 50 μm. Frame interval = 5 min.
Single cells which were carried out in situ nestin staining after EF stimulation showing directed migration towards the cathode in EF. Scale bar = 10 μm. Frame interval = 3 min.
Reversal of migration direction after reversal of EF polarity. The image is frozen at the moment of EF reversal to highlight it, after which the sequence resumes. Scale bar = 50 μm. Frame interval = 5 min.
EF trigged redistribution was also confirmed by the fact that reversal of the EF vector triggered an immediate reversal of protrusion that maintains the orientation of the leading edge. Scale bar = 10 μm. Frame interval = 6 min.
Time-lapse recorded transplanted eNPCs directed migration in the spinal cord slice which an environment mimicking in vivo condition. eNPCs show highly directed migration towards cathode in spinal cord slice as they presented in vitro. Scale bar = 10 μm. Frame interval = 3 min.
Migration of eNPCs pre-treated with the PI3K inhibitor LY294002 before EF exposure. Scale bar = 50 μm. Frame interval = 5 min.
Migration of wild-type (A, B) and P110γ−/− mouse eNPCs (C, D) in EFs. Scale bar = 50 μm. Frame interval = 5 min.