Abstract
Tetraploid black locust (Robinia pseudoacacia L.) is adaptable to salt stress. Here, we compared morphological, physiological, ultrastructural, and proteomic traits of leaves in tetraploid black locust and its diploid relatives under salt stress. The results showed that diploid (2×) plants suffered from greater negative effects than those of tetraploid (4×) plants. After salt treatment, plant growth was inhibited, photosynthesis was reduced, reactive oxygen species, malondialdehyde content, and relative electrolyte leakage increased, and defense-related enzyme activities decreased in 2× compared to those in 4×. In addition, salt stress resulted in distorted chloroplasts, swollen thylakoid membranes, accumulation of plastoglobules, and increased starch grains in 2× compared to those in 4×. However, 4× developed diverse responses under salt stress. A comparative proteomic analysis revealed that 41 and 37 proteins were differentially expressed in 2× and 4×, respectively. These proteins were mainly involved in photosynthesis, stress and defense, energy, metabolism, transcription/translation, and transportation. Distinct patterns of protein changes between 2× and 4× were analyzed. Collectively, our results suggest that the plants showed significantly different responses to salt stress based on ploidy level of the plant. The 4× possessed a better salt protection mechanism than that of 2×, suggesting salt tolerance in the polyploid plant.
Keywords: salt stress, Robinia pseudoacacia L., diploid, tetraploid, physiology, proteomics
1. Introduction
Soil salinity is a major environmental stressor that severely limits crop growth and harvest worldwide [1]. In general, salinity stress induces deleterious cellular changes, including water deficits, ion homeostasis, ionic toxicity, membrane alterations, and free radical production [2,3]. Many plants grow slowly or die under salt stress. Plants have evolved complex mechanisms to adapt to salt stress based on modifications in metabolites, gene expression and proteins. To date, many genes responding to salt stress in plants have been identified [4]. However, these genes do not offer insight into the quantity and quality of the final gene products, i.e., the proteins that are regulated at the translational level [5]. Proteomics is a necessary and crucial component to genomic approaches and a powerful tool that facilitates the analysis of biochemical pathways and the complex response mechanisms of plants to the stress caused by salt, cold, and drought [6,7]. Earlier reports based on proteomics have mainly focused on the responses of diploid (2×) plants, and the proteomic knowledge of the response to salt stress by polyploids is very limited.
Polyploidy arises from the doubling of chromosomes of a single species (autopolyploidy) or the hybrids between two species (allopolyploidy). Polyploidy usually changes anatomical and morphological characteristics such as an increase in leaf thickness and pubescence [8,9]. Moreover, polyploidy also changes physiological functions or gene expression [10–12]. Accordingly, these changes may affect a lot the phenotype and the response to stress [13–18]. Due to the interest in a homogenous genetic background, some studies have tried to compare polyploids and their diploid relatives for tolerance to environmental stressors. Polyploids clearly exhibit higher tolerance to drought, heat, cold, salt, viruses, fungi, and pest stressors compared with their diploid relatives [19–22]. Therefore, polyploidy has been regarded as an efficient way to improve environmental stress tolerance in plants and has played important roles in agriculture and forestry [23]. However, the molecular and physiological basis of stress tolerance by polyploids is not well understood.
Tetraploid (4×) black locust (Robinia pseudoacacia L.), which is native to Korea, is a preferred tree species in the timber forest due to its rapid growth and good wood texture. Moreover, it can be used as fine feed for domestic fowl and livestock because its fleshy leaves are rich in vitamins and minerals. Importantly, tetraploid black locust is a pioneer tree species due to it wide ranging adaptability to adverse environments such as salt, drought, cold, and pests. Accordingly, tetraploid black locust has high ecological and economic value.
In this study, we report on the physiological and proteomic responses to salt stress in 2× and 4× black locust. The objectives of this study were (1) to determine growth and physiological traits under salt stress in 2× and 4× black locust (2) to improve the understanding of the molecular mechanism of differential salt tolerance in different ploidy species, and (3) to aid in the rational engineering of plants with enhanced salt tolerance.
2. Results and Discussion
2.1. Plant Growth and Physiological Response of Leaves of 2× and 4× Plants to Salt Stress
Diploid plants began to wilt after 10 days and some plants died after 15 days under salt stress, as shown in Figure 1. However, 4× plants did not show significant changes even at the end of the 15 days experiment (Figure 1). In addition, salt treatment significantly inhibited plant growth (relative height growth rate (HGR) and the relative stem basal diameter growth rate (BGR)), but the difference in relative growth rate (RGR) was not significant between 2× and 4× (Figure 2A–C). In contrast, after a 10 days salt treatment, relative water content (RWC) decreased in both 2× and 4×, whereas RWC in 2× was much higher than that in 4× after 10 days of salt stress (Figure 2D).
Figure 1.
Morphological changes in Robinia pseudoacacia diploid (2×) and tetraploid (4×) plants growth after salt treatment (500 mM NaCl). Diploid (A) and tetraploid (4×) (B) plants were grown in a soil and sand mixture (2:1) after 1, 5, 10, and 15 days of salt treatment.
Figure 2.
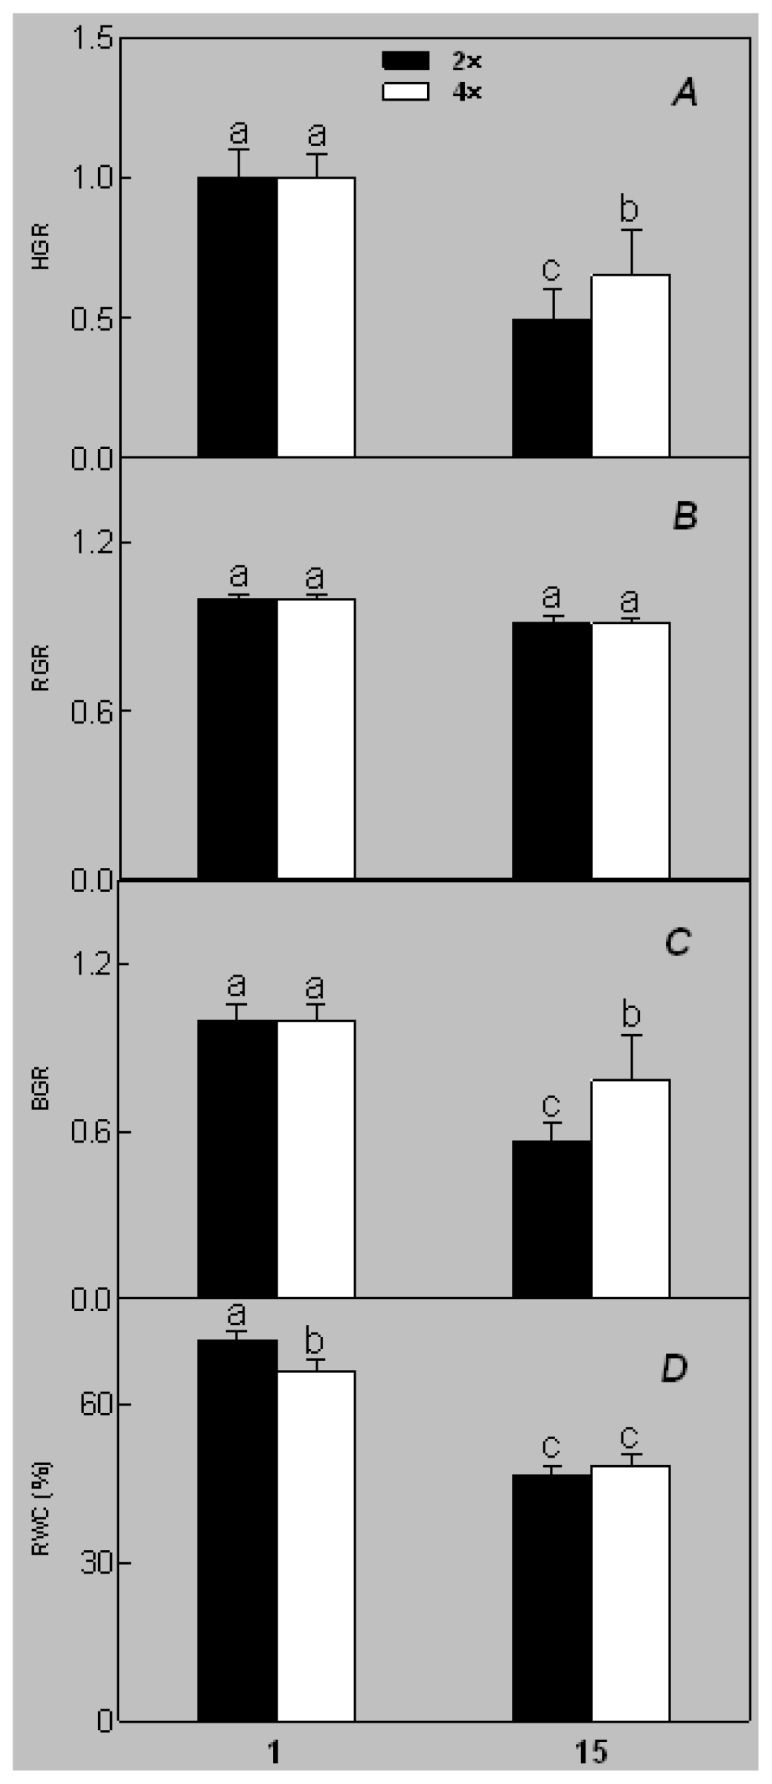
Effects of salt stress on relative height growth rate (HGR) (A), relative range growth rate (RGR) (B), relative basal diameter growth rate (BGR) (C), and relative water content (RWC) (D) of leaves in Robinia pseudoacacia diploid (2×) (black bars) and tetraploid (4×) (white bars) plants growing under salt stress. Values followed by different letters are significantly different from each other at p < 0.05 according to Duncan’s method. Each data point represents the mean ± standard error of three replicates.
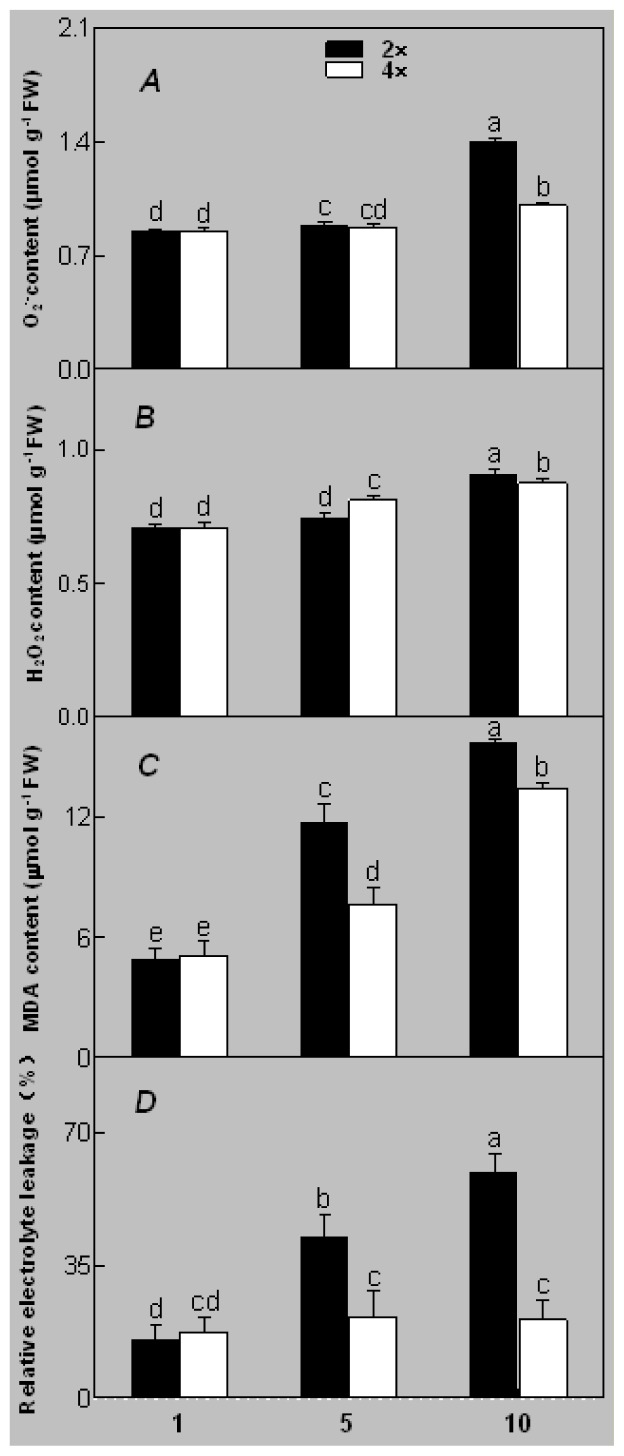
Salinity increased O2− and H2O2 contents in both 2× and 4× plants (Figure 3A,B). However, 2× showed higher O2− and H2O2 contents than did 4× at the end of 10 days of the experiment. Additionally, malondialdehyde (MDA) content and relative electrolyte leakage (REL) increased in 2× and 4× after salt treatment, and 2× showed much higher levels than that of 4× (Figure 3C,D).
Figure 3.
Effects of salt stress on O2− content (A), H2O2 content (B), and malondialdehyde (MDA) content (C) and relative electrolyte leakage (REL) (D) in the leaves of Robinia pseudoacacia diploid (2×) (black bars) and tetraploid (4×) (white bars) plants growing under salt stress. Values followed by different letters are significantly different from each other at p < 0.05 according to Duncan’s method. Each data point represents the mean ± standard error of three replicates.
At day 1 after the NaCl treatment, concentrations of Cl−, K+, and Na+ were higher in 4× than those in 2× plants. The K+/Na+ ratios were similar in both 2× and 4× (Figure 4A–D). After salt treatment, Na+, and Cl− increased in 2×; however, no significant changes were detected in 4× (Figure 4A,B). In addition, NaCl treatment caused no significant changes in K+ concentration in 2×. However, it only caused a slight increase in the K+ level in 4× (Figure 4C). The K+/Na+ ratio exhibited a significant decrease in 2× when exposed to salinity but they changed little in 4× (Figure 4D).
Figure 4.

Effects of salt stress on the concentrations of Na+ (A), Cl− (B), K+ (C), and the K+/Na+ ratio (D) in the leaves of Robinia pseudoacacia diploid (2×) (black bars) and tetraploid (4×) (white bars) plants growing after salt treatment. Values followed by different letters are significantly different from each other at p < 0.05 according to Duncan’s method. Each data point represents the mean ± standard error of three replicates.
During different treatments, net CO2 assimilation rate (Pn) and stomatal conductance (Gs) were higher in 4× than those in 2× (Figure 5A,B). In 2×, Pn and Gs declined when plants were exposed to salinity. However, Pn and Gs in 4× plants were not significantly affected by salinity. Additionally, intercellular CO2 concentration (Ci) of 2× and 4× did not decrease significantly under salt treatment (Figure 5C).
Figure 5.
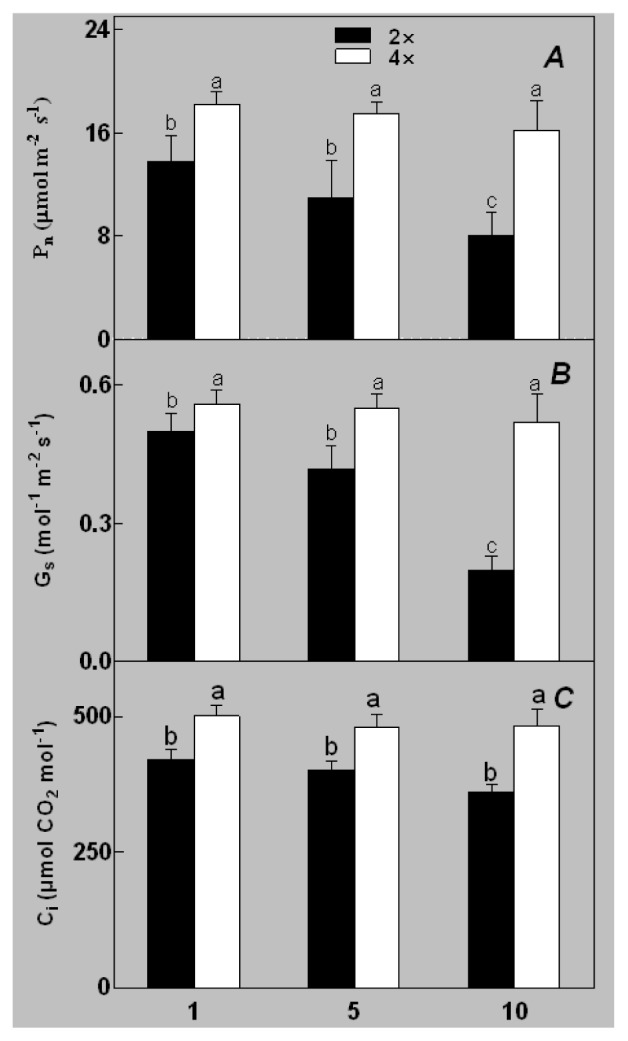
Effects of salt stress on net CO2 assimilation rate (Pn) (A), stomatal conductance (Gs) (B), and intercellular CO2 concentration (Ci) (C) in the leaves of Robinia pseudoacacia diploid (2×) (black bars) and tetraploid (4×) (white bars) plants growing under salt stress. Values followed by different letters are significantly different from each other at p < 0.05 according to Duncan’s method. Each data point represents the mean ± standard error of three replicates.
Superoxide dismutase (SOD) activity decreased in 2× and 4× after salt treatment, but 4× showed higher SOD activity than that of 2× (Figure 6A). The activities of peroxidase (POD), ascorbate peroxidase (APX), and glutathione reductase (GR) increased under salt stress in 4× but not in 2× (Figure 6B–D). In particular, 4× plants showed significantly higher APX and GR activities than those of 2× when subjected to salinity (Figure 6C,D).
Figure 6.
Effects of salt stress on the activities of superoxide dismutase (SOD) (A), peroxidase (POD) (B), ascorbate peroxidase (APX) (C), and glutathione reductase (GR) (D) in the leaves of Robinia pseudoacacia diploid (2×) (black bars) and tetraploid (4×) (white bars) plants growing after salt treatment. Values followed by different letters are significantly different from each other at p < 0.05 according to Duncan’s method. Each data point represents the mean ± standard error of three replicates.
The results for the physiological responses of plant growth to salt stress were different (Figures 1–8). Salt stress inhibited plant growth and decreased net photosynthetic rate and stomatal conductance in 2×. However, the decreases in these parameters were less in 4× than those in 2×. These results agree with our earlier research showing that 4× plants are relatively salt-tolerant compared to that of 2× plants [24]. Similar results were reported by another group [25]. In Figure 5, our results showed that Pn and Gs for 4× were not sensitive in response to salt stress after RWC decreases are detectable. It may be a reason that the salt stress caused less pronounced inhibition of photosynthesis in 4× than in 2×. In other words, 4× plants have higher water use efficiency under salt stress. Thus, 4× can keep photosynthesis stability under low RWC to adapt salt stress. At the same time, RWC is not only factor influencing Pn. The decrease in growth and stomatal conductance may result from reduced leaf water content. Gs plays an important role in the change in Pn. Little change in Ci was observed compared with that of Gs (Figure 3). This indicates that photosynthesis under salt stress may be affected by other factors such as the availability of ATP and Rubisco activity [26]. The changes between Pn, Gs, and Ci in 2× and 4× plants were different, which was further supported by the proteomics results. The expression levels of 19 and 16 proteins including Rubisco large subunit, rubisco activase and ATP synthase CF1 alpha subunit increased in 2× and 4× after salt treatment, respectively. MDA and REL are important indicators of the damage caused by salt stress [27]. The present results show that salinity significantly increased MDA content and REL in 2× more than those in 4×, indicating more damage to membranes in 2× plants.
Figure 7.
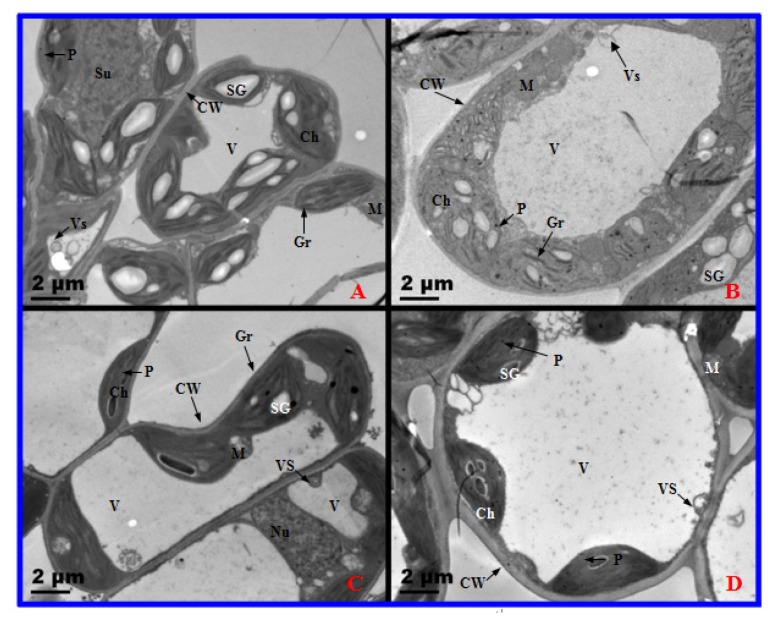
Transmission electron micrographs of diploid (2×) and tetraploid (4×) Robinia pseudoacacia mesophyll cells after one day and 10 days of salt treatment. (A) 0 day, 2×; (B) 0 day, 4×; (C) 10 days, 2×; (D) 10 days, 4×. CW, cell wall; Ch, chloroplast; M, mitochondrion; Nu, nucleolus; P, plastoglobule; SG, starch granule; Gr, granum; V, vacuole; Vs, small vesicle.
Figure 8.
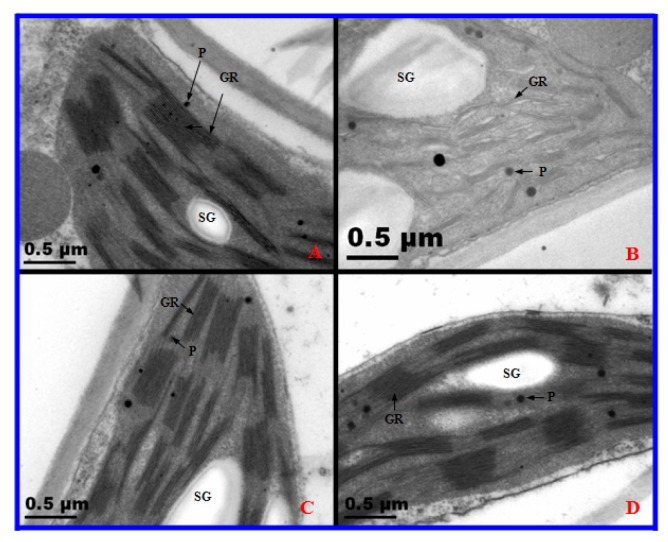
Transmission electron microscopy observations of chloroplasts in diploid (2×) and tetraploid (4×) Robinia pseudoacacia after one day and 10 days of salt treatment. (A) 0 day, 2×; (B) 10 days, 2×; (C) 0 day, 4×; (D) 10 days, 4×. Gr, granum; thylakoid (Th); P, plastoglobule; SG, starch grain.
Salt stress induces the accumulation of reactive oxygen species (ROS) such as H2O2 and O2−. Excess accumulation of ROS causes oxidative damage to membrane lipids, nucleic acids, and proteins [28]. H2O2 and O2− accumulated in leaves of 2× and 4× plants after salt treatment. In general, plants reduce or scavenge ROS through antioxidant enzymes such as SOD, POD, APX, and GR. Interestingly, the activities of the antioxidant enzymes (POD, APX and GR) in 4× plants increased under salt stress. All antioxidant enzymes play an important role adjusting the cellular redox state [29]. In contrast, these enzymes (POD, APX and GR) decreased in 2×. Antioxidant enzyme activities increase in most salt-tolerant plants [30]. However, SOD activity declined gradually in both 2× and 4× during salt treatment. Conversely, 4× plants showed higher SOD activity than that of 2×, indicating that 4× has a more efficient enzymatic antioxidant system against salt stress and adjusting to ROS than those of 2× plants.
2.2. Ultrastructural Responses of 2× and 4× Plants to Salt Stress
The ultrastructure of the mesophyll cells of both 2× and 4× plants were similar after one day of salt treatment (Figure 7A,C). No significant differences were found in the chloroplasts (Cs)/thylakoid (Th) of the mesophyll cells of 2× and 4× plants after one day of salt treatment (Figure 8A,C). Nevertheless, the ultrastructure of 2× mesophyll cells changed noticeably after 10 days of salt treatment (Figure 7B). In 2×, stress caused by severe salinity resulted in distorted Cs, swollen Th, and an accumulation in plastoglobules after 10 days of salt treatment. In addition, the number of starch grains increased (Figure 8B). However, the ultrastructural morphological injuries were not apparent in 4× salt-stressed plants (Figures 7D and 8D).
Salinity stress affects cell ultrastructure in many plant species. Photosynthesis occurs in chloroplasts; hence, it is the most severely impacted organelle under salt stress. Salinity induces severe disorganization in chloroplasts, leading to distorted chloroplasts and dilated thylakoid membranes in mesophyll cells of A. littoralis [31]. However, in this study, chloroplasts of 2× became swollen, plastoglobules and starch granules accumulated, and thylakoids exhibited disorganization after salt treatment (Figures 7 and 8). In addition, 2× plants showed a decline in Pn, Gs, Ci, growth rate, and an increase in REL. These results reveal that salt stress destroyed the structure and function of mesophyll cells. Some reports have shown that disorganized chloroplasts are the main source of reactive oxygen and are involved in leaf senescence [32]. Therefore, 2× displayed accelerated senescence under salt stress. However, less serious injury was observed in chloroplasts of salt-stressed 4× than that in salt-stressed 2× at the same treatment stage, which again suggests that 2× suffered from greater negative effects than that of 4× when grown under high salinity conditions. Therefore, 4× can keep stable photosynthesis by organized cell ultrastructure.
2.3. Identification of Differentially Expressed Proteins after Salt Treatment by Two-Dimensional Electrophoresis (2-DE)
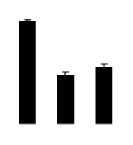
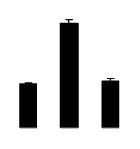
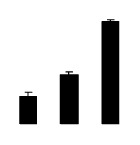
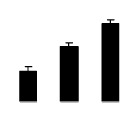
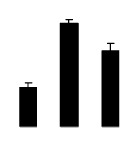
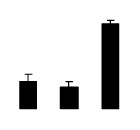
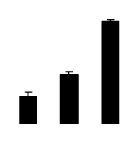
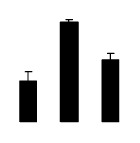
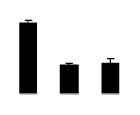
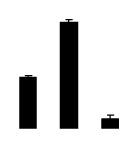
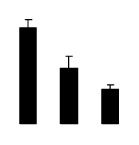
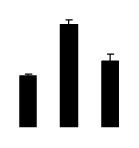
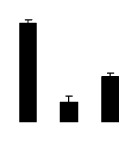
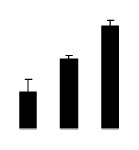
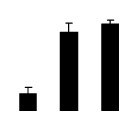
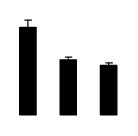
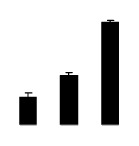
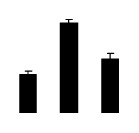
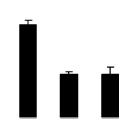
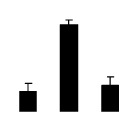
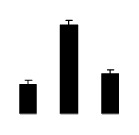
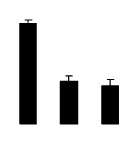
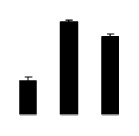
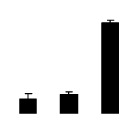
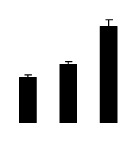
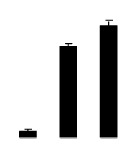
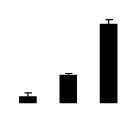
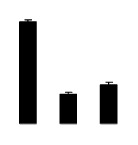
To investigate the changes in protein profiles under salt stress, total protein from the leaves of control and salt-treated plants was extracted and analyzed by 2-DE. Approximately 800 protein spots were detected in 2× and 4× plants, respectively. Master 2-D gel maps are shown in Figures 9 and 10. All protein spots were quantitatively analyzed, but only the protein spots that showed two-fold or more expression (p < 0.05) changes under the salt treatments were submitted for protein identification. All 41 protein spots from 2× gels and 37 protein spots from 4× gels were detected as differentially expressed spots (Figures 9 and 10; Tables 1 and 2). Twenty-eight proteins were up-regulated in 2× plants. Of which 13 proteins increased gradually in abundance in salt-treated plants, whereas 13 proteins increased in expression after 5 days of salt treatment and then decreased after 10 day of salt treatment. Two proteins decreased and then increased under salt stress compared to that in controls. Twenty-five proteins were up-regulated in 4× plants. Among them, 21 proteins increased gradually compared to controls and only four increased and then decreased with salt treatment.
Figure 9.
Coomassie Brilliant Blue (CBB)-stained two-dimensional electrophoresis gels of proteins from Robinia pseudoacacia diploid (2×) leaves. Proteins were separated on a 13 cm IPG strip (pH 4–7 linear gradient) using isoelectric focusing, followed by sodium dodecyl sulfate polyacrylamide gel electrophoresis on a 12.5% gel. (A) 1-day NaCl-treated leaves; (B) 5-day NaCl-treated leaves; (C) 10-day NaCl-treated leaves. Blue and red numbers indicate proteins that increased and decreased between control and stressed samples, respectively. The proteins are listed in Table 1.
Figure 10.
Coomassie Brilliant Blue (CBB)-stained two-dimensional electrophoresis gels of proteins from Robinia pseudoacacia tetraploid (4×) leaves. Proteins were separated on 13 cm IPG strip (pH 4–7 linear gradient) using isoelectric focusing, followed by sodium dodecyl sulfate polyacrylamide gel electrophoresis on a 12.5% gel. (A) 1-day NaCl-treated leaves; (B) 5-day NaCl-treated leaves; (C) 10-day NaCl-treated leaves. Blue and red numbers indicate proteins that increased and decreased between control and stressed samples, respectively. The proteins are listed in Table 2.
Table 1.
Protein identities and their relative changes in leaves of tetraploid Robinia pseudoacacia after salt stress.
| Spot No. a | Protein Name | Species | gi Number b | Theoretical MW(Da)/pI c | Experimental MW(Da)/pI d | Score e | M f | C (%) g | V% ± SE h (1/5/10 days) |
|---|---|---|---|---|---|---|---|---|---|
| Energy | |||||||||
| 494 | phosphoglycerate kinase | N. benthamiana | 313585890 | 50.05/7.66 | 58.00/6.34 | 172 | 10 | 19 |

|
| 537 | phosphoglycerate kinase | R. pseudoacacia | 2257598 | 23.67/6.49 | 45.66/6.32 | 479 | 34 | 100 |
|
| Metabolism | |||||||||
| 498 | putative plastidic glutamine synthetase | O. sativa (japonica group) | 115461066 | 47.56/5.96 | 51.16/5.52 | 98 | 13 | 25 |
|
| 508 | chalcone synthase | R. pseudoacacia | 194740616 | 32.58/5.75 | 50.19/5.09 | 115 | 13 | 46 |
|
| 789 | aconitate hydratase domain protein | A. cellulolyticus CD2 | 303239527 | 19.84/4.86 | 28.47/4.45 | 91 | 11 | 58 |

|
| 536 | pyruvate kinase | C. reinhardtii | 159485206 | 23.201/6.2 | 40.20/6.22 | 86 | 23 | 15 |

|
| Photosynthesis | |||||||||
| 506 | Rubisco large subunit | G. subaequalis | 24634972 | 52.37/6.34 | 50.37/5.13 | 215 | 31 | 45 |

|
| 538 | Rubisco large subunit | Caesalpinia sp. SH-2010 | 306481385 | 43.78/7.38 | 45.71/6.67 | 310 | 32 | 49 |
|
| 554 | Rubisco large subunit | Parkia multijuga | 148590322 | 51.78/6.23 | 34.27/6.41 | 190 | 19 | 27 |

|
| 557 | Rubisco large subunit | Merremia hastata | 21634009 | 47.96/6.42 | 32.77/6.30 | 216 | 18 | 25 |
|
| 575 | Rubisco large subunit | Dendrobium aphyllum | 300250366 | 22.77/6.2 | 22.67/5.39 | 217 | 13 | 54 |

|
| 582 | Rubisco large subunit | Loxocarya gigas | 5737828 | 49.48/6.43 | 21.50/5.29 | 258 | 11 | 26 |
|
| 584 | Rubisco large subunit | Ipomoea purpurea | 157325538 | 53.35/6.41 | 37.47/6. 26 | 182 | 18 | 31 |
|
| 593 | Rubisco large subunit | Millettia lenneoides | 18032763 | 51.53/6.04 | 24.01/6.22 | 239 | 18 | 24 |

|
| 603 | Rubisco large subunit | R. pseudoacacia | 2343004 | 49.20/6.13 | 19.78/5.88 | 336 | 31 | 54 |
|
| 610 | Rubisco large subunit | Haematoxylum brasiletto | 66735773 | 18.40/6.05 | 17.95/5.17 | 179 | 14 | 46 |
|
| 612 | Rubisco large subunit | Marila laxiflora | 49823207 | 21.44/5.91 | 18.190/4.98 | 282 | 12 | 35 |

|
| 615 | Rubisco large subunit | R.pseudoacacia | 340511916 | 50.20/6.14 | 18.69/5.28 | 305 | 32 | 53 |
|
| 621 | Rubisco large subunit | Prunus salicina | 15987094 | 51.31/6.99 | 16.61/4.30 | 147 | 14 | 20 |
|
| 622 | Rubisco large subunit | Cecropia palmata | 6983898 | 52.00/6.23 | 16.72/4.54 | 126 | 13 | 16 |

|
| 623 | Rubisco large subunit | R. pseudoacacia | 2342974 | 52.01/6.14 | 15.83/5.07 | 116 | 15 | 28 |
|
| 624 | Rubisco large subunit | Stigmaphyllon paralias | 14599610 | 52.24/6.23 | 15.23/4.41 | 175 | 21 | 31 |
|
| 626 | Rubisco large subunit | Codonopsis dicentrifolia | 194400582 | 50.82/6.19 | 15.03/4.96 | 118 | 15 | 30 |
|
| 702 | Rubisco large subunit | Millettia lenneoides | 18032763 | 51.53/6.04 | 22.37/5.72 | 271 | 23 | 47 |
|
| 721 | Rubisco large subunit | Parthenocissus himalayana | 16973408 | 51.68/6.34 | 31.78/4.26 | 196 | 15 | 40 |

|
| 795 | Rubisco large subunit | R. pseudoacacia | 67079090 | 25.32/6.23 | 16.84/5.84 | 354 | 25 | 55 |
|
| 567 | Ribulose-bisphosphate carboxylase | Mangifera indica | 7261036 | 24.43/6.71 | 27.20/6.56 | 227 | 19 | 64 |

|
| 597 | Ribulose-bisphosphate carboxylase | Centrosema sp. SH-2010 | 306481395 | 49.81/6.44 | 22794/6.23 | 167 | 18 | 27 |
|
| 548 | Ribulose-biphosphate carboxylase oxygenase | Liparia genistoides | 146188483 | 27.28/6.36 | 37.36/6.06 | 263 | 25 | 60 |
|
| 533 | photosystem II protein 33kD | Spinacia oleracea | 224916 | 26.65/5.01 | 38.28/5.34 | 294 | 22 | 78 |
|
| 578 | polypeptide of the oxygen evolving complex of photosystem II | Sonneratia apetala | 146454492 | 24.99/5.61 | 24.59/5.03 | 95 | 6 | 26 |
|
| 475 | ATP synthase CF1 alpha subunit | R. communis | 339516150 | 55.52/5.22 | 70.28/5.03 | 340 | 26 | 31 |
|
| 476 | putative ATP synthase beta subunit | O. sativa (japonica group) | 56784991 | 45.94/5.33 | 69.32/5.49 | 106 | 22 | 51 |
|
| Transportation | |||||||||
| 480 | aspartyl/glutamyl-tRNA(asn/gln) amidotransferase subunit b | Stigmatella aurantiaca DW4/3-1 | 310819540 | 53.54/5.56 | 59.82/6.02 | 74 | 11 | 23 |

|
| Transcription/translation related | |||||||||
| 625 | maturase-like protein | Coursetia weberbaueri | 23664381 | 60.78/9.42 | 15.06/4.94 | 193 | 18 | 39 |

|
| Stress and defense | |||||||||
| 455 | heat shock protein 70 | Cucumis sativus | 1143427 | 75.37/5.15 | 100.32/4.83 | 332 | 21 | 25 |
|
| 478 | agglutinin I polypeptide B | R. pseudoacacia | 4033451 | 31.19/6.14 | 64.35/5.50 | 117 | 14 | 69 |
|
| 482 | agglutinin I polypeptide B | R. pseudoacacia | 4033451 | 31.19/6.14 | 60.65/6.19 | 488 | 19 | 69 |
|
| 525 | plastidic aldolase | N. paniculata | 4827253 | 43.07/6.38 | 46.90/6.47 | 202 | 25 | 48 |

|
| 800 | phenylalanine ammonia lyase | R. pseudoacacia | 194740604 | 78.41/6.31 | 58.78/5.46 | 274 | 31 | 55 |

|
| Unclear classification | |||||||||
| 611 | predicted protein | Micromonas sp. RCC299 | 171910308 | 31.90/5.47 | 18.68/5.22 | 280 | 31 | 62 |

|
Assigned spot number as indicated in Figure 9.
Accession numbers according to the NCBIInr database.
Theoretical (c) and experimental (d) masses (kDa) and pIs of identified proteins.
Mascot protein score reported after searching against the NCBInr database. Experimental values were calculated by Image Master 2D Platinum software. Theoretical values were retrieved from the protein database.
The number of unique peptides identified for each protein.
Sequence coverage.
Mean of relative protein abundance and standard error. Three treatments including 1, 5, and 10 days after 500 mM NaCl treatment were performed.
Table 2.
Protein identities and their relative changes in leaves of tetraploid Robinia pseudoacacia under salt stress.
| Spot No. a | Protein Name | Species | gi Number b | Theoretical MW(Da)/pI c | Experimental MW(Da)/pI d | Score e | M f | C (%) g | V% ± SE h (1/5/10 days) |
|---|---|---|---|---|---|---|---|---|---|
| Energy | |||||||||
| 60 | phosphoglycerate kinase | N. benthamiana | 313585890 | 50.05/7.66 | 98.76/6.24 | 169 | 13 | 23 |

|
| 476 | mitochondrial F1-ATPase beta subunit | Dimocarpus longan | 269914683 | 59.87/6.18 | 22.47/4.62 | 274 | 23 | 38 |
|
| Metabolism | |||||||||
| 229 | chalcone synthase | R. pseudoacacia | 194740620 | 36.76/6.22 | 27.61/6.24 | 608 | 29 | 32 |

|
| 486 | chalcone synthase | R. pseudoacacia | 194740616 | 32.58/5.75 | 68.39/5.71 | 175 | 15 | 48 |

|
| 70 | enolase | Glycine max | 42521309 | 47.69/5.31 | 92.57/5.73 | 130 | 12 | 20 |

|
| Photosynthesis | |||||||||
| 79 | Rubisco large subunit | R. pseudoacacia | 340511916 | 50.71/6.14 | 98.81/6.59 | 299 | 34 | 62 |
|
| 90 | Rubisco large subunit | Daviesia rhizomata | 18032753 | 51.67/6.14 | 67.60/6.28 | 418 | 37 | 63 |
|
| 164 | Rubisco large subunit | Gironniera subaequalis | 24634972 | 52.37/6.34 | 44.69/6.22 | 340 | 35 | 47 |

|
| 180 | Rubisco large subunit | Wisteria sp. | 2343020 | 51.49/6.13 | 39.61/6.19 | 294 | 20 | 32 |

|
| 185 | Rubisco large subunit | Canavalia rosea | 18157259 | 52.11/6.14 | 39.79/6.24 | 209 | 17 | 30 |

|
| 267 | Rubisco large subunit | R. pseudoacacia | 2343004 | 49.23/6.13 | 22.59/6.28 | 156 | 20 | 47 |

|
| 301 | Rubisco large subunit | Mascagnia stannea | 14599586 | 51.57/6.14 | 19.08/4.81 | 347 | 29 | 56 |
|
| 302 | Rubisco large subunit | Mascagnia stannea | 14599586 | 51.57/6.14 | 18.99/4.64 | 308 | 31 | 54 |

|
| 448 | Rubisco large subunit | Floerkea proserpinacoides | 38147280 | 51.57/5.87 | 24.53/4.89 | 120 | 14 | 23 |
|
| 449 | Rubisco large subunit | Aspicarpa sericea | 331690047 | 49.79/6.13 | 22.68/4.81 | 175 | 16 | 27 |

|
| 453 | Rubisco large subunit | Wisteria sp. | 2343020 | 51.49/6.13 | 27.71/6.32 | 311 | 26 | 42 |

|
| 473 | Rubisco large subunit | Centrosema sp. SH-2010 | 306481395 | 49.81/6.44 | 22.49/6.20 | 265 | 27 | 31 |

|
| 474 | Rubisco large subunit | Sassafras albidum | 283558279 | 20.64/6.05 | 21.07/6.24 | 132 | 14 | 32 |
|
| 477 | Rubisco large subunit | Diospyros pentamera | 221078519 | 51.98/6.14 | 21.06/4.35 | 179 | 15 | 20 |
|
| 479 | Rubisco large subunit | Mucuna macrocarpa | 18157295 | 52.11/6.14 | 44.05/6.82 | 284 | 33 | 43 |
|
| 272 | Rubisco large subunit | Pachynema junceum | 9909908 | 19.07/5.33 | 20.07/5.68 | 226 | 14 | 36 |
|
| 283 | Rubisco large subunit | Pachynema junceum | 9909908 | 19.19/5.33 | 19.14/5.18 | 199 | 14 | 36 |

|
| 481 | Rubisco activase | Glycine max | 290766481 | 52.64/5.54 | 98.57/5.11 | 211 | 29 | 43 |

|
| 487 | Rubisco activase | Glycine max | 290766485 | 48.64/6.28 | 53.18/5.47 | 172 | 14 | 21 |

|
| 129 | Rubisco activase | Zantedeschia aethiopica | 13430334 | 37.25/6.7 | 55.76/6.03 | 157 | 18 | 35 |

|
| 68 | ATP synthase CF1 alpha subunit | R. communis | 339516150 | 55.52/5.22 | 93.78/5.40 | 472 | 28 | 36 |
|
| 475 | ATP synthase CF1 alpha subunit | Vigna radiata | 289066833 | 55.68/5.21 | 21.06/6.24 | 366 | 28 | 35 |

|
| 120 | Phosphoribulokinase (PPK) | Pisum sativum | 1885326 | 39.00/5.41 | 58.67/5.57 | 129 | 10 | 25 |

|
| Transportation | |||||||||
| 46 | Rubisco subunit binding-protein beta subunit | R. communis | 255564820 | 64.15/5.65 | 100.08/5.40 | 127 | 13 | 23 |

|
| 248 | General secretion pathway protein D precursor, putative | R. communis | 255619353 | 30.81/4.67 | 27.01/5.53 | 174 | 17 | 54 |
|
| Transcription/translation related | |||||||||
| 77 | maturase-like protein | Olneya tesota | 23477700 | 60.67/9.45 | 91.49/6.01 | 409 | 27 | 52 |
|
| Stress and defense | |||||||||
| 76 | Chain A, legume lectin sf the bark of robinia pseudoacacia | R. pseudoacacia | 15826665 | 25.58/4.48 | 99.77/6.42 | 121 | 13 | 57 |

|
| 128 | sedoheptulose-1,7-bisphosphatase(SBPase) | Cucumis sativus | 229597543 | 42.08/5.96 | 55.09/5.22 | 99 | 11 | 23 |

|
| 169 | phenylalanine ammonia lyase | R. pseudoacacia | 194740606 | 34.40/5.4 | 44.64/6.59 | 300 | 21 | 72 |

|
| 195 | ascorbate peroxidase | Medicago sativa | 16304410 | 20.14/5.33 | 32.49/5.26 | 110 | 6 | 27 |

|
| Unclear classification | |||||||||
| 482 | PREDICTED: ADP-ribosylation factor 1-like | Amphimedon queenslandica | 340369230 | 20.47/6.15 | 49.38/5.26 | 89 | 2 | 4 |

|
| 288 | Em protein | R. pseudoacacia | 1754977 | 12.22/6.21 | 28.51/5.30 | 356 | 22 | 98 |

|
Assigned spot number as indicated in Figure 10.
Accession numbers according to NCBIInr database.
Theoretical (c) and experimental (d) mass (kDa) and pI of identified proteins.
Mascot protein score reported after searching against the NCBInr database. Experimental values were calculated by Image Master 2D Platinum Software. Theoretical values were retrieved from the protein database.
The number of unique peptides identified for each protein.
Sequence coverage.
Mean of relative protein abundance and standard error. Three treatments including 1, 5 and 10 days after 500 mM NaCl treatment were performed.
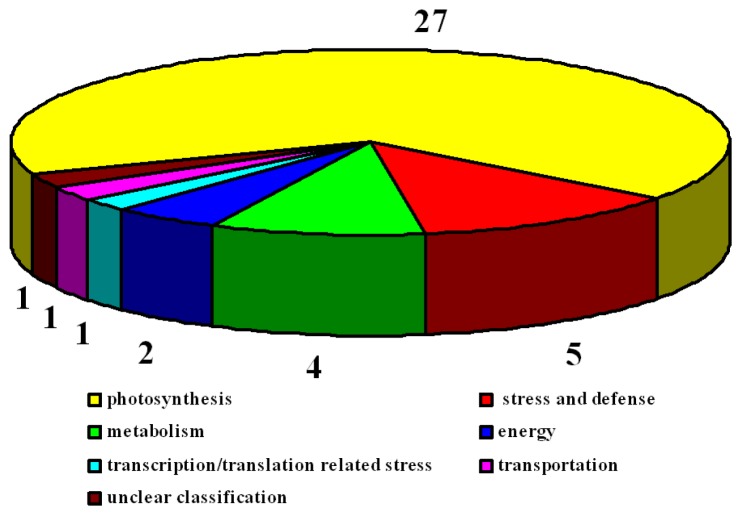
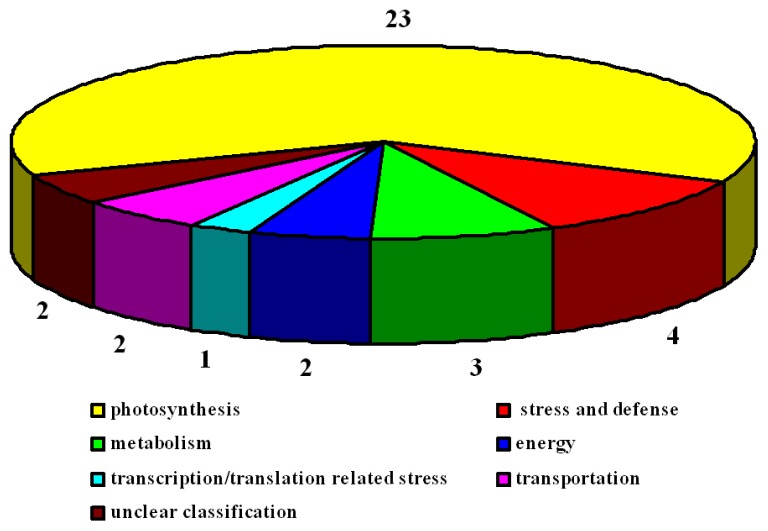
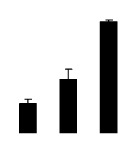
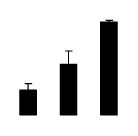
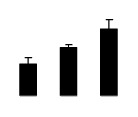
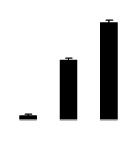
To further examine the differentially expressed proteins, all 78 protein spots were excised, digested, and submitted for protein identification. Based on the data from BLASTP, Gene Ontology, and some literature, the identified proteins covered a wide range of molecular functions (Tables 1 and 2). In 2×, 41 identified proteins were classified into seven categories (Figure 11). The largest group of proteins was associated with photosynthesis (27), followed by stress and defense (5), metabolism (4), energy (2), transcription/translation related (1), transportation (1), and unclear classification (1). In 4×, 39 identified proteins were also classified into seven groups (Figure 12). Most of the proteins were involved in photosynthesis (23), followed by stress and defense (4), metabolism (3), energy (2), transportation (2), transcription/translation related (1), and unclear classification (2).
Figure 11.
Functional categorization of proteins in Robinia pseudoacacia diploid (2×) plants under salt stress. Digits indicate the protein number of each functional category.
Figure 12.
Functional categorization of proteins in R. pseudoacacia tetraploid (4×) plants under salt stress. Digits indicate the protein number of each functional category.
2.3.1. Photosynthesis-Related Proteins
Salt stress is a major environmental factor that limits the efficiency of photosynthesis. In our study, nearly half the proteins (27 in 2× and 23 in 4×) were photosynthesis-related proteins. Among them, a number of proteins (20 in 2× and 17 in 4×) were assigned to the Rubisco large subunit from different plant species but are visualized at positions with very different pIs and molecular weights (Tables 1 and 2). There results were not surprising because Rubisco is the most abundant protein in leaves. In addition, proteins in multiple spots can be translated from alternatively spliced mRNAs [33,34]. Two ribulose-bisphosphate carboxylase were only detectable in the treated 2×, and three Rubisco activases were only detectable in the treated 4×, suggesting that they responded specifically to salt stress. Among them, the two Rubisco activases increased in 4× after salt treatment. Previous reports also showed that the main role of this activase as an ATPase protein is maintenance of the catalytic activity of Rubisco by removing inhibitory sugars from the active site of uncarbamylated and carbamylated Rubisco [35,36]. Thus, increased Rubisico activase activity may have lead to increased photosynthetic rate (Pn) and increased growth rate. This result substantiated that 4× can tolerate high salt stress.
Photosystem II (PSII), as the core complex in photosynthesis, mediates oxygen evolution activity. PSII proteins (spot 578) in 2× were down-regulated under salt stress, suggesting that PSII activity was inhibited. These results were similar to previous observations [37]. In addition, two ribulose-bisphosphate carboxylase (RuBPCase) were down-regulated after salt treatment. RuBPCase is responsible for the primary step in CO2 fixation. Down-regulation of RuBPCase leads to a reduction in photosynthetic capacity. But, changes in these enzymes were not identified in 4× under salt stress. A possible reason is that 2× and 4× used different strategies to combat salt stress. Particularly, ATP synthase CF1 alpha subunit showed increased levels in 4× but decreased levels in 2× at 10 days of salt treatment. The increase in ATP synthase CF1 alpha subunit increases photosynthesis rate and down-regulates the Calvin cycle enzyme phosphoglycerate kinase [38]. Clearly, 4× had a greater capability to tackle salt stress by accumulating more photosynthesis-related proteins.
2.3.2. Stress and Defense Proteins
Salt stress can lead to ion imbalance, hyperosmotic stress, and oxidative damage. Thus, plants induce various stress response proteins, many of which are crucial components of the plants self-defense network. Five and four proteins had altered translation levels in response to salinity stress in 2× and 4×, respectively. Here, they were only visible in the treated 2× and 4× plants. Agglutinin I polypeptide B and phenylalanine ammonia lyase were significantly up-regulated after salt treatment in 2×, whereas heat shock protein 70 and plastidic aldolase decreased under salt stress (Table 1). In 4×, four proteins involved in the defense reaction, including legume lectin of the bark, sedoheptulose-1,7-bisphosphatase, phenylalanine ammonia lyase, and APX remarkably accumulated under salt stress (Table 2). The accumulation of proteins associated with defense could help 4× survive the high salt conditions. Our previous study showed that 4× plants have higher APX activity than that of 2× under salt stress. APX can detoxify H2O2 to H2O and plays an important role resisting salt stress in plants [39]. These results were not surprising because APX plays an important role in salt stress tolerance.
Lectins are carbohydrate-binding proteins expressed in plants upon exposure to biotic or abiotic stressors such as drought, salinity, heat, hormone treatment, pathogen attack, or insect herbivory. In the present study, the abundance of agglutinin I polypeptide B in 2× and chain A, a legume lectin of the bark in 4×, increased after salt treatment. Lectins reduce the detrimental effects of salinity-induced oxidative stress in wheat seedlings, which is consistent with other findings [40]. Clearly, this suggests a very important role of lectins in plant salt tolerance.
2.3.3. Energy Proteins
When plants are exposed to high levels of salt, extra energy may be consumed to prevent damage. Phosphoglycerate kinase (PGK) and mitochondrial F1-ATPase beta subunits increased in 4× under salinity stress (Table 2). Some reports have revealed that PGK levels are enhanced by various stress conditions in several species [41]. PGK catalyzes the formation of ATP to ADP, which is essential for carbon fixation in plants. Enhancement of PGK would provide more ATP and ensure sufficient energy for plants to resist salt stress. In addition, the mitochondrial F1-ATPase beta subunit was up-regulated in 4× by salt treatment. Such up-regulation in the of F1-ATPase beta subunit protein level in response to salt treatment is likely to affect the tricarboxylic acid cycle, electron transport, and increase ATP synthesis. This may be one of the important mechanisms by which salt treatment reduces the extent of salinity-induced oxidative stress.
The same PGK (spot 494) was down-regulated in 2× under salt stress. However, another PGK was up-regulated. This was inconsistent with what was found in 4×. This different response to salt stress between the two plants is interesting. However, the PGK protein was found in two spots, which is presumably due to post-transcriptional modification or proteolytic degradation of proteins in vivo and in vitro.
2.3.4. Metabolic Proteins
Aconitate hydratase and pyruvate kinase are essential respiratory metabolism enzymes in plants. The abundance of aconitate hydratase and pyruvate kinase suggests that the tricarboxylic acid (TCA) and glycolysis increase under salinity stress. Enhancement of TCA and glycolysis would produce more ATP. Increases in aconitate hydratase and pyruvate kinase involved in respiratory metabolism showed the capacity of 2× plants to recover from salt stress. In contrast, no proteins associated with TCA or glycolysis changed significantly under salt stress in 4× plants. Besides, we found that the levels of chalcone synthase (CHS) and enolase changed remarkably in 4× under salt stress. A large number of investigations have shown that CHS and enolase are induced by various environmental stressors. Therefore, it was considered that 4× plants used another pathway to resist salt stress, or 4× as a halophyte had a high capacity to prevent damage resulting from oxidative stress.
In this study, to keep genetic stability, we propagated plants by cutting. Generally, cutting propagation can produce genetically identical progeny compared with hybrids propagation. Thus, cutting reproduction strongly influences genetic variation. Now, other methods such as flow cytometry and chromosome counting have been used for ploidy estimation (11).
3. Experimental Section
3.1. Plant Materials and Growth Conditions
All materials are introduced directly from South Korea to China by Beijing Forestry University. The diploid and tetraploid plants are from a germplasm. Thus, they have the same genetic origin. Thirty uniform plants (2-years-old) from 2× and 4× black locust were collected from Beijing Forestry University in Beijing, China and planted in plastic pots (18 cm in diameter and 18 cm in depth) filled with 2:1 (v/v) mixture of soil and sand. The experiments were carried out at Harbin Experimental Forest Farm of Northeast Forestry University in June 2011. Potted plants were grown in the greenhouse (day/night air temperature, 28/22 °C, photoperiod 12 h, and approximately 65%–85% relative humidity) for 1 month. Previous research showed that 4× tolerate high salt stress (500 mM NaCl) for a short time. Thus, in this study, we treated plants with 500 mM NaCl for 15 days. After 1, 5, 10, and 15 days of treatment, the leaves were harvested, immediately frozen in liquid nitrogen, and stored at −80 °C prior to physiological and proteomic experiments. At least three independent biological experiments for each treatment were replicated.
3.2. Morphological and Biomass Measurements
The morphological traits of all plants were observed and photographed at 1, 5, 10, and 15 days of treatment. At the beginning and end of the salt treatments, height, range, and stem basal diameter of plants and leaf water content were recorded. The HGR, RGR, and the relative growth rate of stem basal diameter (BGR) were calculated using the following formulas: HGR = (h′2 − h′1)/(h2 − h1), where h′1 is the height of salt-stressed plant at the beginning, h′2 is the height of salt-stressed plants at the end, h1 is the height of control plants at the beginning, h2 is the height of control plant at the end. RGR = (r′2 − r′1)/(r2 − r1), where r′1 is the range of stressed plants at the beginning, r′2 is the range of stressed plants at the end, r1 is the range of control plants at the beginning, r2 is the range of control plants at the end. BGR = (b′2 − b′1)/(b2 − b1), where b′1 is the stem basal diameter of stressed plants at the beginning, b′2 is the stem basal diameter of stressed plants at the end, b1 is the stem basal diameter of control plants at the beginning, b2 is the stem basal diameter of control plants at the end. At 9:30 AM, the fully expanded leaves were collected to measure relative water content (RWC) of leaves using the following formula: RWC (%) = (FW − DW)/(TW − DW) × 100, where FW is fresh weight, TW is turgid weight after rehydrating the samples for 24 h, and DW is dry weight after oven-drying the samples at 85 °C for 24 h.
3.3. Ion Content Analysis
Leaves were dried at 80 °C and digested in nitric acid (1% HNO3 (v/v)) using the method of Wolf (1982) to measure Na+ and K+[42]. Na+ and K+ were analyzed by flame emission using atomic absorption spectrophotometry (PerkinElmer Analyst 800, Waltham, MA, USA). Cl− was quantified by a modified silver titration method described by Chen et al. (2001) [43].
3.4. Determination of Superoxide Radical, Hydrogen Peroxide, Lipid Peroxidation and Relative Electrolyte Leakage
Leaves (0.5 g) were ground at 4 °C and then homogenized in 5 mL 50 mM potassium phosphate buffer (pH 7.8) containing 0.1 mM EDTA, 1% (w/v) PVP, 0.1 mM PMSF, and 0.2% (v/v) Triton X-100. The mixture was centrifuged at 12,000× g for 15 min at 4 °C. One millilitre the supernatant was mixed with a mixture of 1 mL hydroxylamine hydrochloride for 1 h, 1 mL β-aminobenzene sulfonic acid, and 1 mL α-naphthylamine, and then the solution was incubated at 25 °C for 20 min. The concentration of superoxide radical was determined by measuring the absorbance of the mixture at 530 nm using a NaNO2 standard curve. Hydrogen peroxide (H2O2) content was determined by measuring the absorbance of the H2O2 titanium complex at 410 nm using known concentrations of H2O2 as the standard curve. Lipid peroxidation was estimated as MDA content using a modified method. Leaves (0.2 g) were homogenized in 5 mL of 5% of trichloroacetic acid (TCA) and centrifuged at 12,000× g for 15 min. Two ml of supernatant was added to a test tube containing the mixture of 2 mL of 20% TCA, 0.01% butylated hydroxytoluene, and 0.6% thiobarbituric acid. The mixture was heated in boiling water for 30 min, and then quickly cooled on ice. After centrifugation at 12,000× g for 10 min, the absorbance of the supernatant was determined at 450, 532 and 600 nm.
Twenty leaf discs (1.0 cm2) from the third to fifth fully expanded leaves were vacuum-infiltrated in 10 mL deionized water for 30 min and maintained in water for 6 h. Using a portable conductivity detector (LC116, Mettler Toledo Instruments Co., Ltd., Shanghai, China), the conductivity of the bathing solution (C1) was determined. Then, the leaf discs and the bathing solution were boiled for 10 min and thoroughly cooled to room temperature, and the conductivity of the resulting solution (C2) was determined. The REL was calculated (REL (%) = (C1/C2) × 100).
3.5. Photosynthesis Analysis
Net photosynthetic rate (Pn), Gs, and intercellular CO2 concentration (Ci) were measured at 0, 5, and 10 days of salt treatment from 9:00 to 11:30 in the morning with a portable photosynthesis measuring system LI-COR 6400 (LI-COR Inc., Lincoln, NE, USA).
3.6. Antioxidant Enzyme Activity Analysis
SOD (EC1.15.1.1) activity was measured following the method of Roth and Gilbert (1984) [44]. The reaction mixture contained 20 μL enzyme extract, 50 mM sodium phosphate buffer (pH 7.8), 100 μM EDTA, and 10 mM pyrogallol. Enzyme activity was detected at 420 nm by spectrophotometer. POD (EC1.11.1.7) activity was measured according to the method of Nickel and Cunningham (1969) [45]. The reaction mixture contained 25 mM PBS (pH 7.0), 0.05% guaiacol, 10 mM H2O2, and enzyme extract. POD activity was measured at 470 nm. GR (EC1.6.4.2) activity was assayed using the method of Nordhoff et al. (1993) [46]. GR activity was determined by NADPH oxidation at 340 nm. The reaction mixture contained 10 μL enzyme extract, 100 mM potassium phosphate buffer (pH 7.8), 0.2 mM NADPH, 2 mM EDTA, and 0.5 mM glutathione. The reaction was initiated by adding NADPH at 25 °C. The APX (EC1.11.1.11) activity assay was carried out using the method of Nakano and Asada (1981) [47]. The reaction mixture contained 50 mM sodium phosphate buffer (pH 7) including 0.2 mM EDTA, 0.5 mM ascorbic acid, 50 mg of BSA, and crude enzyme extract. The reaction was started by adding H2O2 at a final concentration of 0.1 mM.
3.7. Ultrastructural Leaf Analysis
Fresh leaf segments (about 1.5 cm in length and 0.5 cm in width) were fixed in 2.5% glutaral pentanedial (v/v) at 4 °C for 2 h, washed twice in 0.1 M PBS (sodium phosphate buffer, pH 6.8) at 4 °C. Then, they were postfixed in 2% osmium tetraoxide (OsO4) for 2 h, sequentially dehydrated in 50%, 70%, 90%, and 100% acetone, and embedded in Epon 812 for 2 h. Ultra-thin sections (70 nm) were sliced, stained with uranyl acetate and lead citrate, and then mounted on copper grids for viewing on the H-600 IV TEM (Hitachi, Tokyo, Japan) at an accelerating voltage of 60 kV.
3.8. Extraction of Total Leaf Protein
Total leaf protein of plants at different treatment times (0, 5, and 10 days) was extracted using the method of Hurkman and Tanaka (1986) [48]. Fresh leaf samples were ground in liquid nitrogen using a mortar and pestle to make a fine powder, and then suspended in 10% ice-cold TCA in acetone containing 0.07% β-mercaptoethanol. The suspension was allowed to precipitate overnight at −20 °C and was centrifuged at 15,000× g for 50 min at 4 °C. The supernatant was removed, the precipitate was washed three times with ice-cold acetone containing 0.07% β-mercaptoethanol for 1 h at −20 °C, and the protein pellet was air-dried and stored at −80 °C. The protein powder was solubilized in lysis buffer (7 M urea, 2 M thiourea, 4% w/v CHAPS, 40 mM DTT, 2% v/v pH 4–7 IPG buffer, and 4% w/v PMSF), and the supernatant was collected by centrifugation at 15,000× g for 50 min at 4 °C. The protein content was assayed using bovine serum albumin as the standard according to the method of Bradford (1976) [49].
3.9. 2-DE Image Analysis and Gel Staining
2-DE was carried out according to the method of Bjellqvist et al. (1982). A mixture of 300 μg protein sample in 350 μL of rehydration buffer containing 7 M urea, 2 M thiourea, 2% w/v CHAPS, 40 mM DTT, and 0.5% v/v IPG buffers, pH 4–7 (GE Healthcare Bio-Sciences Corp., Piscataway, NJ, USA), and 0.01% bromophenol blue was prepared. The mixture was loaded onto IPG strips (13 cm, linear pH 4–7, GE Healthcare Bio-Sciences, Uppsala, Sweden). After overnight rehydration of the IPG strips at 20 °C, isoelectric focusing was carried out on an Ettan IPGphorII (GE Healthcare, Bio-Sciences, Uppsala, Sweden) at 20 °C. Isoelectric focusing was performed using the following procedure: 30 V for 2 h, 100 V for 1 h, 500 V for 1 h, 1000 V for 1 h, gradient 8000 V for 0.5 h, and 8,000 V rapid focus for 6 h. After focusing, the strips were equilibrated by reduction with DTT and carboxymethylation with iodoacetamide. The second dimension was performed on 12.5% (w/v) polyacrylamide gels at 15 mA per gel for 30 min followed by 30 mA until the bromophenol blue ran off the bottom of the gel. Gels were stained with Coomassie Brilliant Blue R-250 and destained the next day.
Gel images were scanned using an ImageScanner III (GE Healthcare, Bio-Sciences, Uppsala, Sweden). Images were analyzed with ImageMaster 2D Platinum 7.0 software (Amersham Biosciences, Piscataway, NJ, USA, 2011). The average volume percent values were calculated from three technical replicates to represent the final volume percent values of each biological replicate. The experimental molecular mass and PI of the protein spots were determined by 2-DE standards and interpolation of missing values on the IPG strips. Spots were quantified based on total density of the gels by the percentage volume. Significantly different spots, which were determined as p < 0.05 and a change of more than two-fold in abundance, were considered to be differentially accumulated proteins, and they had to be consistently present in three replications.
3.10. In-Gel Digestion and Matrix-Assisted Time of Flight Mass Spectroscopy (MALDI-TOF-MS) Analysis
Selected protein spots were excised, washed with 50% (v/v) acetonitrile in 0.1 M NH4HCO3, and dried at room temperature. Proteins were reduced with 1 mM DTT and 2 mM NH4HCO3 at 55 °C for 1 h and alkylated with 55 mM iodoacetamide in 25 mM NH4HCO3 in the dark at room temperature for 45 min. The gel pieces were thoroughly washed with 25 mM NH4HCO3, 50% ACN, 100% ACN, and dried. The proteins were digested in 10 mL modified trypsin (Promega, Madison, WI, USA) solution (1 ng mL−1 in 25 mM ammonium bicarbonate) during an overnight incubation at 37 °C. Digests were immediately spotted onto 600 mm Anchorchips (Bruker Daltonics, Bremen, Germany). Spotting was achieved by pipetting 1 mL of analyte onto the MALDI target plate in duplicate and then adding 0.05 mL of 20 mg mL−1 α-CHCA in 0.1% TFA/33% (v/v) ACN, which contained 2 mM ammonium phosphate. All samples were analyzed in the positive-ion reflectron mode on a TOF Ultraflex II mass spectrometer (Bruker Daltonics, Billerica, United states). Each acquired mass spectra (m/z range 700–4000, resolution 15,000–20,000) was processed using FlexAnalysis v2.4 software (Bruker Daltonics, Bremen, Gemeny, 2004). Proteins were identified with Mascot software (http://www.matrixscience.com) based on the mass signals to search for proteins in the SwissProt, NCBInr, and MSDB databases.
3.11. Statistical Analyses
Statistical analyses were performed with SPSS 17.0 software (SPSS Inc., Chicago, IL, USA, 2009). All parameters are presented as mean ± standard error and were obtained from at least three replicates and analyzed using Duncan’s multiple range test or Student’s t-test. A p-value < 0.05 was considered significant.
4. Conclusions
Tetraploid black locust has high ecological and economic value. Until now, little was known about the implications of ploidy level in black locust on the physiological and proteomic responses under salt stress. In this study, the physiological and proteomic responses of 2× and 4× black locust were detected under salt stress during different times. Our results demonstrated that 2× plants suffered from greater negative effects than those of 4× plants according to their morphological and physiological characteristics under salt stress. In addition, 2-DE was used to analyze ploidy differences of the black locust leaf proteome under salt stress. Therefore, 4× plants have higher levels of several ROS scavenging enzymes and accumulate photosynthesis-related enzymes, defense protein and energy proteins to cope with salt stress compared with 2×. These results contribute to selection of some specific proteins during ploidy process. In addition, the results suggested that 4× had a greater capability to defend against salt stress by accumulating more related proteins. Our results provide more information to further understand the molecular and physiological basis of stress tolerance in polyploid plants.
Acknowledgments
This study was supported the Fund for Fostering Talents in Basic Science of the National Natural Science Foundation of China (No. J1210053), the National Natural Science Foundation of China (31170568).
Abbreviations
- APX
ascorbate peroxidase
- BGR
the relative growth rate of stem basal diameter
- BSA
bovine serum albumin
- CHS
chalcone synthase
- 2-DE
Two-dimensional electrophoresis
- HGR
The relative growth rate of height
- H2O2
hydrogen peroxide
- Hsp70
heat shock protein 70
- MDA
Malondialdehyde
- PGK
phosphoglycerate kinase
- PPK
phosphoribulokinase
- RGR
the relative growth rate of range
- ROS
Reactive Oxygen Species
- RuBPCase
ribulose-bisphosphate carboxylase
- RWC
relative water content
- SBPase
sedoheptulose-1,7-bisphosphatase
- TCA
tricarboxylic acid
Conflicts of Interest
The authors declare no conflict of interest.
References
- 1.Horie T., Schroeder J.I. Sodium transporters in plants. Diverse genes and physiological functions. Plant Physiol. 2004;136:2457–2462. doi: 10.1104/pp.104.046664. [DOI] [PMC free article] [PubMed] [Google Scholar]
- 2.Zhu J.K. Plant salt tolerance. Trends Plant Sci. 2001;6:66–71. doi: 10.1016/s1360-1385(00)01838-0. [DOI] [PubMed] [Google Scholar]
- 3.Srivastava A.K., Ramaswamy N.K., Mukopadhyaya R., Chiramal J.M.G., D’Souza S.F. Thiourea modulates the expression and activity profile of mtATPase under salinity stress in seeds of Brassica juncea. Ann. Bot. 2009;103:403–410. doi: 10.1093/aob/mcn229. [DOI] [PMC free article] [PubMed] [Google Scholar]
- 4.Yang A., Dai X., Zhang W.H. A R2R3-type MYB gene, OsMYB2, is involved in salt, cold, and dehydration tolerance in rice. J. Exp. Bot. 2012;63:2541–2556. doi: 10.1093/jxb/err431. [DOI] [PMC free article] [PubMed] [Google Scholar]
- 5.Breyne P., Zabeau M. Genome-wide expression analysis of plant cell cycle modulated genes. Curr. Opin. Plant Biol. 2001;4:136–142. doi: 10.1016/s1369-5266(00)00149-7. [DOI] [PubMed] [Google Scholar]
- 6.Salekdeh G.H., Siopongco J., Wade L.J., Ghareyazie B., Bennett J. Proteomic analysis of rice leaves during drought stress and recovery. Proteomics. 2002;2:1131–1145. doi: 10.1002/1615-9861(200209)2:9<1131::AID-PROT1131>3.0.CO;2-1. [DOI] [PubMed] [Google Scholar]
- 7.Zhang H., Han B., Wang T., Chen S., Li H., Zhang Y., Dai S. Mechanisms of plant salt response: Insights from proteomics. J. Proteome Res. 2012;11:49–67. doi: 10.1021/pr200861w. [DOI] [PubMed] [Google Scholar]
- 8.Romero-Aranda R., Bondada B.R., Syvertsen J.P., Grosser J.W. Leaf characteristics and net gas exchange of diploid and autotetraploid citrus. Ann. Bot. 1997;79:153–160. [Google Scholar]
- 9.Wang Q.L., Yu M.D., Lu C., Wu C.R., Jing C.R. Study on breeding and photosynthetic characteristics of new polyploidy variety for leaf and fruit-producing mulberry (Morus L) Sci. Agric. Sin. 2011;44:562–569. [Google Scholar]
- 10.Masterson J. Stomatal size in fossil plants: Evidence for polyploidy in majority of angiosperms. Science. 1994;264:421–424. doi: 10.1126/science.264.5157.421. [DOI] [PubMed] [Google Scholar]
- 11.Stupar R.M., Bhaskar P., Yandell B., Rensink W.A., Hart A.L., Ouyang S., Veilleux R.E., Busse J.S., Erhardt R.J., Buell C.R., et al. Phenotypic and transcriptomic changes associated with potato autopolyploidization. Genetics. 2007;176:2055–2067. doi: 10.1534/genetics.107.074286. [DOI] [PMC free article] [PubMed] [Google Scholar]
- 12.Riddle N.C., Jiang H., An L., Doerge R.W., Birchler J.A. Gene expression analysis at the intersection of ploidy and hybridity in maize. Theor. Appl. Genet. 2010;120:341–353. doi: 10.1007/s00122-009-1113-3. [DOI] [PubMed] [Google Scholar]
- 13.Ramsey J. Polyploidy and ecological adaptation in wild yarrow. Proc. Natl. Acad. Sci. USA. 2011;108:6697–6669. doi: 10.1073/pnas.1016631108. [DOI] [PMC free article] [PubMed] [Google Scholar]
- 14.Li F.Z., Ning X.M., Qiu X.M., Su C.F., Yao J.Q., Tian L.W. Genetic mapping of the dark brown fiber Lc1 gene in tetraploid cotton. Sci. Agric. Sin. 2012;45:4109–4114. [Google Scholar]
- 15.Allario T., Brumos J., Colmenero-Flores J.M., Tadeo F., Froelicher Y., Talon M., Navarro L., Ollitrault P., Morillon R. Large changes in anatomy and physiology between diploid Rangpur lime (Citrus limonia) and its autotetraploid are not associated with large changes in leaf gene expression. J. Exp. Bot. 2013;62:2507–2519. doi: 10.1093/jxb/erq467. [DOI] [PubMed] [Google Scholar]
- 16.Podda A., Checcucci G., Mouhaya W., Centeno D., Rofidal V., del Carratore R., Luro F., Morillon R., Ollitrault P., Maserti B.E. Salt-stress induced changes in the leaf proteome of diploid and tetraploid mandarins with contrasting Na+ and Cl− accumulation behaviour. J. Plant Physiol. 2013;170:1101–1112. doi: 10.1016/j.jplph.2013.03.006. [DOI] [PubMed] [Google Scholar]
- 17.Beest M., le Roux J.J., Richardson D.M., Brysting A.K., Suda J., Kubešová M., Pyšek P. The more the better? The role of polyploidy in facilitating plant invasions. Ann. Bot. 2012;109:19–45. doi: 10.1093/aob/mcr277. [DOI] [PMC free article] [PubMed] [Google Scholar]
- 18.Lu C., Cui B., Huang L., Sun P., Zhang G., Li Y. Phenotypic observation and analysis of inflorescence variation of Autotetraploid Robinia pseudoacacia. Sci. Silvae Sin. 2012;48:63–68. [Google Scholar]
- 19.Al H.A., Monneveaux P., Nachit M.M. Direct and indirect selection for drought tolerance in alien tetraploid wheat durum wheat crosses. Euphytica. 1998;100:287–294. [Google Scholar]
- 20.Fock I., Collonnier C., Purwito A., Luisetti J., Souvannavong V., Vedel F., Servaes A., Ambroise A., Kodja H., Ducreux G., et al. Resistance to bacterial wilt in somatic hybrids between Solanum tuberosum and Solanum phureja. Plant Sci. 2000;160:165–176. doi: 10.1016/s0168-9452(00)00375-7. [DOI] [PubMed] [Google Scholar]
- 21.Huang S., Sirikhachornkit A., Su X., Faris J., Gill B.S., Haselkorn R., Gornicki P. Genes encoding plastid acetyl-CoA carboxylase and 3-phosphoglycerate kinase of the Triticum/Aegilops complex and the evolutionary history of polyploid wheat. Proc. Natl. Acad. Sci. USA. 2002;99:8133–8138. doi: 10.1073/pnas.072223799. [DOI] [PMC free article] [PubMed] [Google Scholar]
- 22.Zhang X.Y., Hu C.G., Yao J.L. Tetraploidization of diploid Dioscorea results in activation of the antioxidant defense system and increased heat tolerance. J. Plant Physiol. 2010;167:88–94. doi: 10.1016/j.jplph.2009.07.006. [DOI] [PubMed] [Google Scholar]
- 23.Xiong Y.C., Li F.M., Zhang T. Performance of wheat crops with different chromosome ploidy: Root-sourced signals, drought tolerance, and yield performance. Planta. 2006;224:710–718. doi: 10.1007/s00425-006-0252-x. [DOI] [PubMed] [Google Scholar]
- 24.Meng F.J., Huang F.L. Changes of function and ultrastructure of mitochondria in Robinia pseudoacacia leaves under salt stress. Nonwood For. Res. 2010;28:18–23. [Google Scholar]
- 25.Saleh B., Allario T., Dambier D., Ollitrault P., Morillon R. Tetraploid citrus rootstocks are more tolerant to salt stress than diploid. C. R. Biol. 2008;331:703–710. doi: 10.1016/j.crvi.2008.06.007. [DOI] [PubMed] [Google Scholar]
- 26.Xiao X., Yang F., Zhang S., Korpelainen H., Li C. Physiological and proteomic responses of two contrasting Populus cathayana populations to drought stress. Physiol. Plant. 2009;136:150–168. doi: 10.1111/j.1399-3054.2009.01222.x. [DOI] [PubMed] [Google Scholar]
- 27.Verslues P.E., Agarwal M., Katiyar-Agarwal S., Zhu J., Zhu J.K. Methods and concepts in quantifying resistance to drought, salt and freezing, abiotic stresses that affect plant water status. Plant J. 2006;45:523–539. doi: 10.1111/j.1365-313X.2005.02593.x. [DOI] [PubMed] [Google Scholar]
- 28.Apel K., Hirt H. Reactive oxygen species: Metabolism, oxidative stress, and signal transduction. Annu. Rev. Plant Biol. 2004;55:373–399. doi: 10.1146/annurev.arplant.55.031903.141701. [DOI] [PubMed] [Google Scholar]
- 29.Tuna A.L., Kaya C., Dikilitas M., Higgs D. The combined effects of gibberellid acid and salinity on some antioxidant enzyme activities, plant growth parameters and nutritional status in maize plants. Environ. Exp. Bot. 2008;62:1–9. [Google Scholar]
- 30.Ashraf M. Biotechnological approach of improving plant salt tolerance using antioxidants as markers. Biotechnol. Adv. 2009;27:84–93. doi: 10.1016/j.biotechadv.2008.09.003. [DOI] [PubMed] [Google Scholar]
- 31.Barhoumi Z., Djebali W., Chaïbi W., Abdelly C., Smaoui A. Salt impact on photosynthesis and leaf ultrastructure of Aeluropus littoralis. J. Plant Res. 2007;120:529–537. doi: 10.1007/s10265-007-0094-z. [DOI] [PubMed] [Google Scholar]
- 32.Zapata J.M., Guéra A., Esteban-Carrasco A., Martín M., Sabater B. Chloroplasts regulate leaf senescence: Delayed senescence in transgenic ndhF-defective tobacco. Cell Death Differ. 2005;12:1277–1284. doi: 10.1038/sj.cdd.4401657. [DOI] [PubMed] [Google Scholar]
- 33.Ishikawa T., Yoshimura K., Tamoi M., Takeda T., Shigeoka S. Alternative mRNA splicing of 3′-terminal exons generates ascorbate peroxidase isoenzymes in spinach (Spinacia oleracea) chloroplasts. Biochem. J. 1997;328:795–800. doi: 10.1042/bj3280795. [DOI] [PMC free article] [PubMed] [Google Scholar]
- 34.Ndimba B.K., Chivasa S., Simon W.J., Slabas A.R. Identification of Arabidopsis salt and osmotic stress responsive proteins using two-dimensional difference gel electrophoresis and mass spectrometry. Proteomics. 2005;5:4185–4196. doi: 10.1002/pmic.200401282. [DOI] [PubMed] [Google Scholar]
- 35.Portis J.A.R. Rubisco activase: Rubisco’s catalytic chaperone. Photosynth. Res. 2003;751:11–27. doi: 10.1023/A:1022458108678. [DOI] [PubMed] [Google Scholar]
- 36.Parker R., Flowers T.J., Moore A.L., Harpham N.V.J. An accurate and reproducible method for proteome profiling of the effects of salt stress in the rice leaf lamina. J. Exp. Bot. 2006;57:1109–1118. doi: 10.1093/jxb/erj134. [DOI] [PubMed] [Google Scholar]
- 37.Sudhir P.R., Pogoryelov D., Kovacs L., Garab G., Murthy S.D. The effects of salt stress on photosynthetic electron transport and thylakoid membrane proteins in the cyanobacterium Spirulina platensis. J. Biochem. Mol. Biol. 2005;38:481–485. doi: 10.5483/bmbrep.2005.38.4.481. [DOI] [PubMed] [Google Scholar]
- 38.Ma H., Song L., Shu Y., Wang S., Niu J., Wang Z., Yu T., Gu W., Ma H., Baker N.R. Comparative proteomic analysis of seedling leaves of different salt tolerant soybean genotypes. J. Proteomics. 2012;75:1529–1546. doi: 10.1016/j.jprot.2011.11.026. [DOI] [PubMed] [Google Scholar]
- 39.Davletova S., Rizhsky L., Liang H., Sheng A., Oliver D.J., Coutu J., Shulaev V., Schlauch K., Mittler R. Cytosolic ascorbate peroxidase 1 is a central component of the reactive oxygen gene network of Arabidopsisi. Plant Cell. 2005;17:268–281. doi: 10.1105/tpc.104.026971. [DOI] [PMC free article] [PubMed] [Google Scholar]
- 40.Shakirova F.M., Bezrukova M.V., Khairullin R.M. The increase in lectin level in wheat shoots under the action of salt stress. Izv. Russ. Acad. Sci. 1993;1:142–145. [Google Scholar]
- 41.Kosová K., Vítámvás P., Prášil L.T., Renaut J. Plant proteome changes under abiotic stress-contribution of proteomics studies to understanding plant stress response. J. Proteomics. 2011;74:1301–1322. doi: 10.1016/j.jprot.2011.02.006. [DOI] [PubMed] [Google Scholar]
- 42.Wolf B. A comprehensive system of leaf analyses and its use fore diagnosing crop nutrient status. Commun. Soil Sci. Plant Anal. 1982;13:1035–1059. [Google Scholar]
- 43.Chen S., Li J., Wang S., Hüttermann A., Altman A. Salt, nutrient uptake and transport, and ABA of Populus euphratica; a hybrid in response to increasing soil NaCl. Trees. 2001;15:186–194. [Google Scholar]
- 44.Roth E.F., Gilbert J.H.S. Pyrogallol assay for SOD: Absence of a glutathione artifact. Anal. Biochem. 1984;137:50–53. doi: 10.1016/0003-2697(84)90344-0. [DOI] [PubMed] [Google Scholar]
- 45.Nickel R.S., Cunningham B.A. Improved peroxidase assay method using leuco 2,3,6-trichloroindophenol and application to comparative measurements of peroxidase catalysis. Anal. Biochem. 1969;27:292–299. doi: 10.1016/0003-2697(69)90035-9. [DOI] [PubMed] [Google Scholar]
- 46.Nordhoff A., Bucheler U.S., Werner D., Schirmer R.H. Folding of the four domains and dimerization are impaired by the Gly446→Glu exchange in human glutathione reductase. implications for the design of antiparasitic drugs. Biochemistry. 1993;32:4060–4066. doi: 10.1021/bi00066a029. [DOI] [PubMed] [Google Scholar]
- 47.Nakano Y., Asad K. Hydrogen peroxide is scavenged by ascorbate-specific peroxidase in spinach chloroplast. Plant Cell Physiol. 1981;22:867–880. [Google Scholar]
- 48.Hurkman W.J., Tanaka C.K. Solubilization of plant membrane proteins for analysis by two-dimensional gel electrophoresis. Plant Physiol. 1986;81:802–806. doi: 10.1104/pp.81.3.802. [DOI] [PMC free article] [PubMed] [Google Scholar]
- 49.Bradford M. A rapid and sensitive method for the quantification of microgram quantities of protein utilizing the principle of protein-due binding. Ann. Biochem. 1976;72:248–254. doi: 10.1006/abio.1976.9999. [DOI] [PubMed] [Google Scholar]


