

Summary
About 30 full‐scale partial nitritation/anammox plants are established, treating mostly sewage sludge reject water, landfill leachate or food processing digestate. Although two‐stage and one‐stage processes each have their advantages, the one‐stage configuration is mostly applied, termed here as oxygen‐limited autotrophic nitrification/denitrification (OLAND), and is the focus of this review. The OLAND application domain is gradually expanding, with technical‐scale plants on source‐separated domestic wastewater, pre‐treated manure and sewage, and liquors from organic waste bioenergy plants. A ‘microbial resource management’ (MRM) OLAND framework was elaborated, showing how the OLAND engineer/operator (1: input) can design/steer the microbial community (2: biocatalyst) to obtain optimal functionality (3: output). In the physicochemical toolbox (1), design guidelines are provided, as well as advantages of different reactor technologies. Particularly the desirable aeration regime, feeding regime and shear forces are not clear yet. The development of OLAND trickling filters, membrane bioreactors and systems with immobilized biomass is awaited. The biocatalyst box (2) considers ‘Who’: biodiversity and its dynamic patterns, ‘What’: physiology, and ‘Where’: architecture creating substrate gradients. Particularly community dynamics and extracellular polymeric substances (EPS) still require insights. Performant OLAND (3) comprises fast start‐up (storage possibility; fast growth of anammox bacteria), process stability (endured biomass retention; stress resilience), reasonable overall costs, high nitrogen removal efficiency and a low environmental footprint. Three important OLAND challenges are elaborated in detailed frameworks, demonstrating how to maximize nitrogen removal efficiency, minimize NO and N2O emissions and obtain through OLAND a plant‐wide net energy gain from sewage treatment.
Introduction
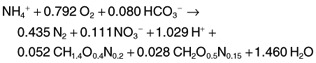
The discovery of anoxic ammonium‐oxidizing bacteria (AnAOB) around 15 years ago has led to the development of several partial nitritation/anammox processes for biological nitrogen removal, including the one‐stage oxygen‐limited autotrophic nitrification/denitrification (OLAND) process (Kuai and Verstraete, 1998; Pynaert et al., 2003; Vlaeminck et al., 2010). In OLAND, the first reaction consists of the aerobic oxidation of about half of the ammonium to nitrite (partial nitritation), performed by aerobic ammonium‐oxidizing bacteria (AerAOB). The second reaction, performed by the AnAOB, is the anoxic oxidation of the residual ammonium with nitrite to mainly dinitrogen gas and some nitrate (anammox). Combing the nitritation (Barnes and Bliss, 1983) and anammox (Strous et al., 1998) stoichiometries, yields the overall OLAND stoichiometry (Eq. 1), with the first and second biomass term respectively displaying the growth of AerAOB and AnAOB.
 |
1 |
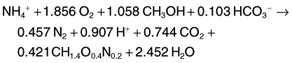
In comparison, the stoichiometry of the conventional biological process for nitrogen removal, i.e. nitritation and nitratation (nitrification; Barnes and Bliss, 1983) and denitrification, with for instance methanol (Mateju et al., 1992), exhibits the following reaction:
 |
2 |
Overall, OLAND consumes 100% less organic carbon, produces about 90% less sludge and consumes almost 60% less oxygen compared with nitrification/denitrification (Mulder, 2003). As such, the treatment of wastewaters with a low biodegradable chemical oxygen demand (bCOD) to N ratio (< 2–3) saves 30–40% of the overall costs (Fux and Siegrist, 2004). Depending on the wastewater characteristics and reactor operation, additional nitrogen conversions can take place, including aerobic nitrite oxidation to nitrate (nitratation) by nitrite‐oxidizing bacteria (NOB) and reduction of nitrate or nitrite with organic carbon to nitrogen gas (heterotrophic denitrification). The latter requires at least 4.1 g bCOD g−1 NO3‐‐N and 2.7 g bCOD g−1 NO2‐‐N using wastewater organics (Mateju et al., 1992). Recent information on the diversity of pathways, enzymes and phylogeny of the mentioned microbial key players can be found in Vlaeminck and colleagues (2011).
Currently about 30 partial nitritation‐anammox applications are operating at full scale. In four of these, partial nitritation and anammox are spatially separated (van der Star et al., 2007; Desloover et al., 2011; Tokutomi et al., 2011), while in all others, a one‐stage process is executed for sewage sludge reject water treatment at 17 locations (Beier and Schneider, 2008; Joss et al., 2009; Wett et al., 2010a; T. Hülsen, oral comm.), for landfill leachate treatment at five locations (Hippen et al., 2001; Denecke et al., 2007; Rekers et al., 2008) and for industrial wastewaters at four locations (Abma et al., 2010; T. Hülsen, oral comm.). Some debate exists on the preference between one‐stage versus two‐stage configuration. Distinct advantages of the two‐stage process include: (i) the partial nitritation and the anammox step can be optimized individually, including nitratation suppression in the first stage, (ii) the risk is lower for AnAOB to be overgrown by denitrifiers in case of higher bCOD/N ratio in the influent (Lackner et al., 2008), since most bCOD will be degraded in the preceding stage, (iii) smaller quantities of AnAOB‐enriched inoculum are required for a fast start‐up (Jaroszynski and Oleszkiewicz, 2011), and (iv) the risk of oxygen inhibition for AnAOB is lower, provided no oxygen enters the anammox stage (Jaroszynski and Oleszkiewicz, 2011). Distinct advantages of the one‐stage process include: (i) investment costs are significantly lower, (ii) the process control is less complex, (iii) the risk of inhibiting AnAOB with nitrite is lower, and (iv) data so far indicate that the N2O emissions from the one‐stage process are 0.4–1.3% of the nitrogen load (Joss et al., 2009; Kampschreur et al., 2009b; Weissenbacher et al., 2010), whereas two‐stage emissions amount to 2.3–6.6% (Kampschreur et al., 2008; Desloover et al., 2011). Given the prevalence of full‐scale realizations of the one‐stage process, this is the focus of this review.
Despite of many operational full‐scale one‐stage plants, several OLAND aspects are still unknown. Therefore, a novel conceptual framework is presented in this review providing insights into the key points for successful OLAND operation and revealing challenges for further research and development. Human resource management (HRM) engages a high‐performing employee for a particular dedicated job, and ensures his/her continued performance by offering an attractive package of rewards and conditions. Analogous to HRM, Verstraete and colleagues (2007) proposed to apply microbial resource management (MRM) in environmental biotechnology, in order to reveal strategies to obtain and maintain a highly performant microbial community. To properly manage complex microbial systems, the engineer needs well‐documented concepts, reliable tools and a set of default values.
MRM framework for OLAND
The OLAND engineering question is to remove nitrogen from wastewater which has a low bCOD/N ratio (≤ 2–3) and which displays a temporal variability in physicochemical composition and flow rate. Given the abovementioned cost‐efficiency of OLAND compared with conventional nitrification/denitrification, its application to a broad range of wastewater types can entail overall benefits with regard to cost and energy savings (Fig. 1, box 0). Besides the established plants on sewage sludge digestate, landfill leachate and specific industrial wastewaters, technical‐scale installations were established for the treatment of source‐separated domestic wastewater, i.e. black water digestate (Meulman et al., 2010; Verstraete and Vlaeminck, 2011). Further, at lab scale, OLAND treatment has been demonstrated for digested manure (Villegas et al., 2011), urine (Udert et al., 2008) and sewage‐like nitrogen concentrations (De Clippeleir et al., 2011a). Additionally, the feed‐in tariffs for renewable energy from biomass are appreciable, and for instance up to 0.30 EUR kWh−1 of electricity is recovered in the European Union (Europe's Energy Portal, 2011). This provides an incentive to build dedicated anaerobic (co‐)digestion plants recovering energy from various organic waste streams (Holm‐Nielsen et al., 2009). OLAND development in this area is expected since its application can further maximize energy recovery by a post‐digestion stage while minimizing energy consumption for nitrogen treatment.
Figure 1.
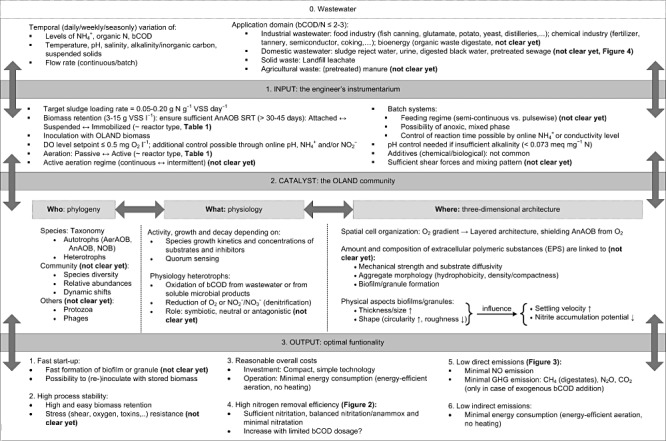
Microbial resource management view on the OLAND process. AerAOB and AnAOB, aerobic and anoxic ammonium‐oxidizing bacteria; NOB, nitrite‐oxidizing bacteria; GHG, greenhouse gas; bCOD, biodegradable chemical oxygen demand; GHG, greenhouse gas; DO, dissolved oxygen; VSS, volatile suspended solids.
The developed MRM framework links the OLAND process input (1), its biocatalyst (2) and its output (3). The physicochemical toolbox (1: Input) of the OLAND engineer consists of a number of operational choices (Fig. 1, box 1). Most of these parameters are relatively fixed and have to be considered while designing the reactor and its control possibilities. Other parameters represent a degree of freedom and can be decided during start‐up or at steady‐state operation. Each of the engineering tools can have an impact on the OLAND microbial community (II: biocatalyst). The complex multitude of microbial community characteristics can comprehensively be subdivided in three areas, which are strongly interlinked (Fig. 1, box 2): who is there, what are they doing and where are they doing it. With the physicochemical toolbox, the OLAND engineer tries to achieve the best biocatalyst properties, in order to obtain optimal functionality (III: Output) of the OLAND process (Fig. 1, box 3). For this aspect, six process objectives can be distinguished: fast start‐up, high process stability, reasonable overall costs, high nitrogen removal efficiency, low NO and N2O emissions, and a low energy balance.
Input
Many fixed parameters depend on the choice of reactor type. The reactor type first determines the way biomass is retained in the system. Indeed, since the doubling time of AnAOB is in the order of 1–2 weeks (Strous et al., 1998), the sludge retention time has to exceed this high value. This can be achieved in reactor types relying on attached biomass, i.e. biofilms, suspended biomass such as flocs and/or granules, or immobilized biomass in a gel matrix (e.g. polyethylene glycol, polyvinyl alcohol, alginate, . . .). Table 1 gives the advantages and challenges for each reactor technology in a qualitative way, which should always be interpreted according to case‐specific requirements. It should be noted that trickling filters (Schmid et al., 2000), immobilized biomass (Yan and Hu, 2009; Zhu et al., 2009) and membrane bioreactors (Wyffels et al., 2004) were used for separate partial nitritation and anammox, but not yet in a one‐stage autotrophic removal process. Immobilization for instance creates diffusion limitations for oxygen, providing anoxic zones for AnAOB, and might be an excellent start‐up strategy ensuring biomass retention and activity. Encapsulation of OLAND biofilm in alginate was shown to decrease the AnAOB activity by 60%, yet after 30 days of biomass growth of alginate granules in a sequencing batch reactor (SBR), the original activity was restored.
Table 1.
Qualitative comparison of OLAND reactor configurations (advantages indicated in bold).
| Biomass growth | Attached (biofilm) | Immobilized | Suspended (flocs and/or granules) | |||||
|---|---|---|---|---|---|---|---|---|
| Reactor configuration | Trickling filter | RBCa | Bed reactor | Upflow/SBR | MBR | Gas‐lift or upflow | SBR | CSTR with settlerb |
| Fixed/moving | Fixed/moving | |||||||
| Overall costs | Low | Low | Medium | Medium | High | Medium | Medium | Medium |
| Area requirement | Medium | High | Medium | Low/Medium | Medium | Low | Medium | High |
| Aeration | Passive | Passive | Active | Active | Active | Active | Active | Active |
| Ease of DO control | Low | Mediumc | Medium/High | High | High | High | High | High |
| Sludge content | Medium | Medium | Medium | Medium | High | High | Low | Low |
| Ease of biomass retention | Medium | Medium | Medium | Medium | High | Low | Low | Low |
| Inoculation feasibilityd | Medium | Low/Medium | Medium/High | High | High | High | High | High |
| Low HRT feasibilitye | Yes | Yes | Yes | Yes | No | Yes | No | No |
| Risk for mechanical failure | Medium | High | Low | Low | Medium | Low | Low | Low |
| Risk for clogging | High | Low | High/Low | Low | High | Low | Low | Low |
| Operational flexibility | Low | Low | Low/Medium | Medium/High | Medium | Medium | Highf | Medium |
| Operational complexity | Low | Low | Medium | Medium/High | High | Medium | High | Medium |
Biofilm can grow on rotating discs (fixed), or on carrier material brought in rotating porous cages (moving).
Similar configuration as conventionally used for activated sludge.
The bulk DO level can be controlled by the rotation speed (Meulman et al., 2010) and by the immersion level of the discs (Courtens et al., 2011).
Assuming sufficient availability of enriched inoculum, attached to carrier material if applicable.
Important for wastewaters with low nitrogen level. For SBR and CSTR, this largely increases required settling time or settler volume, whereas for MBR this largely increases the amount of membranes required.
Cycle duration can be adjusted to meet effluent requirements (Siegrist et al., 2008), allowing to respond to changes in wastewater composition.
RBC, rotating biological contactor; SBR, sequencing batch reactor; CSTR, continuous stirred‐tank reactor.
Biomass retention is most delicate for suspended growth systems (Table 1), and depends on the settleability of the biomass. In a settler (CSTR, continuous stirred‐tank reactor) or settling phase (SBR, sequencing batch reactor), sludge settling is a separate step, permitting some optimization. For SBRs, only occasionally, sludge settling problems have been reported due to small N2 bubbles not detaching from the flocs (Joss et al., 2009). Adjustments of the settling phase and occasional addition of flocculant as needed could solve this problem. In general, larger and thus heavier sludge aggregates have a lower nitritation and a higher anammox activity (Vlaeminck et al., 2010), and hence a lower risk for nitrite accumulation. Wett and colleagues (2010b) took advantage of this fact by installing a cyclone on a SBR, retaining large AnAOB‐rich aggregates in the reactor, while discarding the small AerAOB‐rich aggregates. SBRs without this type of selective biomass retention, however, can also operate without nitrite accumulation at the long term (Joss et al., 2009). For gas‐lift and upflow reactors, biomass retention is of utmost importance, because they depend on the continued presence of well settling granules (Abma et al., 2010). Distinguishing granules from large flocs remains to some extent subjective, with granules defined for instance by Lemaire and colleagues (2008) as compact and dense aggregates with an approximately spherical external appearance that do not coagulate under decreased hydrodynamic shear conditions and which settle significantly faster than flocs. Overall, a sludge retention time (SRT) of at least 30–45 days is recommended (Wett et al., 2010a; Desloover et al., 2011; A. Joss, unpublished).
Reviewing literature, the size of the reactor can be dimensioned based on the biomass content in the range of 3–15 g volatile suspended solids (VSS) l−1 and a sludge loading rate of in the range of 0.05–0.20 mg N g−1 VSS day−1.
An important ‘hardware’ choice is based on the desired level of reactor monitoring and control. Given the delicate steady‐state equilibrium between nitritation and anammox, with minimal nitratation, control of the dissolved oxygen (DO) level is of primary importance. The DO can be kept at one setpoint (e.g. 0.5 mg O2 l−1) or within a certain range (e.g. 0.3–0.8 mg O2 l−1), with either continuous or intermittent aeration. Furthermore, anoxic reaction periods (c. 0 mg O2 l−1) can be built in when mixing and aeration are independent (Table 1), allowing removal of occasional nitrite and/or nitrate accumulation. An additional option is to control the start and stop of intermittent aeration with pH values, which is typically a function of ammonia oxidation (Wett, 2006). The effect of different aeration regimes has not been examined extensively so far. Joss and colleagues (2009) compared aeration in continuous and intermittent mode, i.e. 75% of the time aerated, at full scale and DO setpoint of about 0.5 mg O2 l−1. Continuous aeration was preferred, since this did not result in nitrite accumulation and since the aerators were not continuously switched off and on, allowing also better process monitoring thanks to higher signal/noise levels. Zubrowska‐Sudol and colleagues (2011) tested four aeration regimes in batch (100%, 66%, 50% and 33% of the time aerated), at three DO levels (2, 3, 4 mg O2 l−1), showing for each DO level that 66% aeration obtained the highest nitrogen removal rate but also the highest nitrite accumulation.
Monitoring and control of the nitrogen removal has been reported via indirect measurement of the conductivity (Joss et al., 2009), or via direct nitrogen measurement with ion‐selective ammonium probe (Joss et al., 2009), regulating the duration of the SBR operation cycle. Further, automated colorimetric ammonium and nitrite analyses of grab samples every 10–15 min are an additional control mechanism for the DO level (Abma et al., 2010).
In case the treated wastewater contains no sufficient alkalinity, additional pH control might be necessary. It should be noted, however, that the alkalinity requirements for OLAND and nitrification/denitrification are similar, i.e. 0.073 and 0.065 meq mg−1 N removed respectively (Eqs 1 and 2). Temperature is another parameter of importance, which is discussed below (Section Output).
In semi‐continuous or batch‐fed reactors such as SBR, the choice of feeding regime is mostly chosen a priori, and can have an effect on process performance. Design choices include the timing of feeding (pulse versus continuous), and the percentage volume exchanged per cycle. These will determine the concentration range of substrates and intermediates ‘experienced’ by the sludge. Few studies addressed this aspect specifically, but the findings of De Clippeleir and colleagues (2009) and Schaubroeck and colleagues (2012) indicate that short operational cycles require relatively slow feeding and low volumetric exchange ratio per cycle for successful start‐up.
The shear forces and mixing patterns in the reactor will be influenced by the aeration regime, applied air flow rates, bubble sizes, positions of the blowers, shape of the reactor and by the additional power input in case of additional mixing. For suspended growth systems, the effect of shear and mixing on biomass architecture, and hence activity and stability, was recently hypothesized (Vlaeminck et al., 2010). Research is awaited to deliver a range of desirable shear forces.
Due to slow enrichment of the AnAOB, extremely long start‐up periods of 2.5–3.5 years recently demonstrated the reality of this problem (Wett, 2006; van der Star et al., 2007). More recently, considerable quantities of OLAND biomass have become available from operating reactors, which can be used as inocula for quick reactor start‐up (Wett, 2006; Rekers et al., 2008; Joss et al., 2009; Abma et al., 2010). Inoculation is assisted by the possibility to store active OLAND biomass. Over a storage of OLAND biomass 5 months, AnAOB maintained 55%, 30% and 32% of their original activity, depending on the storage conditions at 4°C without nitrate, 4°C with nitrate and 20°C with nitrate respectively (Vlaeminck et al., 2007). For safety, it is recommended to supply nitrate, ensuring the suppression of toxic sulfide formation. It is obvious that inoculation of a new reactor is facilitated provided sludge of a similar ‘growth mode’ is available, e.g. a moving‐bed biofilm reactor (MBBR) requires biofilm grown on carrier materials. Note also in case of absent inoculum but suitable physicochemical conditions, a fast start‐up is possible, as shown by Jeanningros and colleagues (2010) in 4 months after inoculation with activated sludge.
A degree of freedom exists in the addition of chemicals, such as trace elements, flocculants or others, but these are not strictly required according to practically all literature reports. In case of significant reactor activity loss, for instance due to AnAOB nitrite inhibition, repeated spiking with hydrazine (N2H4; 1.4–2.0 mg N l−1) and/or hydroxylamine (NH2OH; 0.7–3.1 mg N l−1) can be considered (Strous et al., 1999; Bettazzi et al., 2010). Alternatively, reinoculation with previously harvested sludge can also be an option to restore the process. Recently, two interesting, yet costly approaches were reported: (i) the continuous reinoculation with AnAOB, as proposed for the treatment of toxic pharmaceutical wastewater (Tang et al., 2011), and (ii) the spiking with quorum sensing molecules to enhance anammox activity during start‐up (De Clippeleir et al., 2011b).
Catalyst
A microbial community comprises, by definition, different microbial populations, which are groups of microorganisms of the same species. These species can be identified due to a specific base sequence in their genes. However, given the physiological versatility of many prokaryotes, species identification and community structure generally do not provide much information on the function or physiology of the species (Lee et al., 1999). There are only some exceptions in which phylogeny and function are linked, including the autotrophs involved in biological nitrogen removal. In most OLAND applications, AerAOB mostly belong to the β‐Proteobacteria subphylum, genus Nitrosomonas, AnAOB to the Planctomycetes phylum, genera ‘Candidatus Kuenenia and Brocadia’, and NOB, if any, to the Nitrospirae phylum, genus Nitrospira (Vlaeminck et al., 2010 and references therein). More work remains to be done to characterize the heterotrophs present in the OLAND process; however, preliminary evidence suggests the possibility of a symbiotic relationship between specific heterotrophic and autotrophic groups (S.E. Vlaeminck, H. De Clippeleir and W. Verstraete, unpubl. results). Recently, microbial ‘communication’ was found to play a role in the anammox step. De Clippeleir and colleagues (2011b) showed that long‐chain acylhomoserine lactones were present in an OLAND biofilm and AnAOB granules, increasing the anammox reaction at low biomass concentrations.
In OLAND, the presence of the required populations in the required community structure is not sufficient to guarantee process functionality. In addition, an oxygen gradient is needed in space or time to create the required anoxic microniche for the AnAOB. In perfectly mixed and continuously aerated systems, the presence of anoxic zones relies on the three‐dimensional cell organization, in which the AerAOB on the surface protect the AnAOB in the lower layers from oxygen while also providing them with nitrite. The resultant aggregate is a multilayered, three‐dimensionally symmetrical granule (Vlaeminck et al., 2010). This strictly layered structure was less pronounced in OLAND biofilms grown in low shear environments, with AerAOB also prevailing in putatively anoxic zones (Pynaert et al., 2003; Vlaeminck et al., 2009b). Furthermore, suspended reactor systems with heterogeneous mixing or intermittent aeration do not rely on a specific microbial organization to create oxygen gradients.
The structural basis of any microbial three‐dimensional structure is the biogenic EPS matrix, gluing individual cells to form multicellular aggregates (biofilms, flocs or granules). Vlaeminck and colleagues (2010) showed that EPS occupied at least 50% of the granule space in AerAOB and AnAOB zones. Both the EPS amount and composition have important implications. Besides the fundamental structural role, EPS determines the aggregate density and the diffusivity of the substrates. Further, the EPS composition is interlinked with the aggregate morphology and can trigger biofilm or granule formation. It is expected that future contributions on understanding EPS in OLAND will significantly improve our understanding of biofilm and granule formation.
As a result of a selective settling pressure in suspended OLAND reactors, single cells are washed out and only attached biofilm or suspended flocs and granules can maintain themselves in the system. For this biomass, size and shape have physical and biological consequences. First, the denser, larger and/or more circular an aggregate is, the faster it will settle. Second, the anoxic volume of larger aggregates or thicker biofilms occupies a larger portion of the biomass, since the oxygen penetration depth is expected to be the same. This results in a lower risk for nitrite accumulation for larger aggregates (Nielsen et al., 2005; Vlaeminck et al., 2009a; 2010).
Output
Both from an economical and from an environmental point of view, it is desirable that an OLAND reactor has a short start‐up period. As discussed above, inoculation from existing reactors or stored biomass allows for a fast start‐up nowadays. It is also expected that future insights in chemical or physical triggering mechanisms for biofilm or granule formation could enhance reactor start‐up.
Another objective of optimal OLAND functionality is high process stability. High biomass retention is a prerequisite to achieve this. In attached growth systems, the biofilm should be well attached to the carrier material. In suspended growth systems, high settling capacity allows easy separation in the three‐phase separator of an upflow reactor, or fast separation during the settling phase in a SBR, allowing for a longer reaction phase and thus higher nitrogen removal rates. A second aspect of process stability is stress resistance, for instance to high oxygen levels, strong shear forces or episodic exposure to toxicants. Assuming anammox as the most fragile step, symmetrically structured granules would be most resistant to stress situations, since the AerAOB shield will prevent direct exposure of the AnAOB to bulk oxygen concentrations or toxins. Greater understanding of the effect of architecture structure on stress resistance is therefore likely to be of practical value.
Obviously, low nitrogen removal costs are desirable. A precise comparison of the overall costs of the different reactor technologies is practically impossible, yet Table 1 offers a tentative cost estimate. OLAND operational costs are dominated by personnel costs (Fux and Siegrist, 2004). Similarly, for regular sewage treatment these vary heavily depending on the country, constituting between 30% and 70% of the operational costs (Kemper et al., 1994; Zessner et al., 2010). Energy consumption constitutes the other main operational cost, predominantly dependent on the type of aeration: active aeration in sequencing batch reactors requires about 1.2 kWh kg−1 N (Wett et al., 2010a), whereas passive aeration in rotating biological contactors (RBC) requires down to 0.4 kWh kg−1 N (Mathure and Patwardhan, 2005). Costs should of course be scored against the requirements. If for instance an effluent is required which is free of suspended particles, the overall high costs of an OLAND MBR might be quite acceptable.
A high nitrogen removal efficiency is likely the main OLAND output objective, and is elaborated in detail in Section Maximizing nitrogen removal efficiency.
Besides the emission to the environment comprised in the effluent and produced sludge, direct and indirect gaseous emissions form an important part of a sustainable process. Direct emissions include CH4, NO and N2O, and are treated in detail below (Section Minimizing harmful gas emissions). Indirect emissions are derived from the consumption of electrical or heat energy, which are in our fossil‐based energy economy proportionally related to CO2 emissions. The electricity use is mainly dependent on the type of aeration, as discussed higher. Concerning heating, most reactors are currently operated between 25°C and 30°C, yet since mostly mesophilic effluents are treated (typically 30–35°C), no heating is applied. Absence of large wastewater buffer and thermal isolation of the reactor should be sufficient to maintain the temperature, and the metabolic heat of the OLAND treatment even rises the temperature by several degrees (Schmid et al., 2003), in combination with the heat from compressed air, in case of active aeration. So far, long‐term OLAND or anammox activity has been reported below 20°C (Hippen et al., 2001; Dosta et al., 2008; Isaka et al., 2008), but the focus in these studies was not on maximum nitrogen removal. It is anticipated that OLAND treatment of colder waste streams (10–20°C) is possible also at high performance, as elaborated below (Section OLAND enabling energy‐positive sewage treatment).
MRM framework elaborated for three OLAND challenges
Maximizing nitrogen removal efficiency
The maximum nitrogen removal efficiency that can be obtained in a balanced OLAND system without additional denitrification is 89% (Eq. 1). Lower removal efficiencies are mainly caused by hampered nitritation resulting in residual ammonium, by an imbalance between nitritation and anammox resulting in nitrite accumulation, or by increased nitratation resulting in a higher nitrate production. For most OLAND applications treating high‐strength nitrogenous wastewaters, a post‐treatment is obligatory to meet discharge limits. For sewage sludge reject water treatments (Fux and Siegrist, 2004) or source‐separated black/grey‐water systems (Verstraete and Vlaeminck, 2011), the OLAND effluent is sent to the diluted treatment stream for polishing. For industrial applications, the effluent can be sent to a sewage treatment plant (Abma et al., 2010), or can be polished by additional separate stage nitrification and denitrification (Desloover et al., 2011; Tokutomi et al., 2011). The latter techniques are also used to polish OLAND‐treated landfill leachate, and can be complemented with an activated‐carbon stage (Hippen et al., 2001; Denecke et al., 2007). A possibility which has not been explored so far, is the inclusion of an anoxic reaction phase in the OLAND reactor to denitrify the nitrate produced with either autochtonous or added COD to further increase the removal efficiency. Given the low COD/N required to remove the remaining 11% of the nitrogen load, it is anticipated that denitrifying bacteria would not outgrow the AnAOB.
AerAOB activity should be high enough to deliver nitrite to the AnAOB, otherwise residual ammonium prevails (Fig. 2). An increase in AerAOB activity can be obtained by adjustment of the oxygen supply and level, yet care should be taken not to use DO levels above 0.5 mg O2 l−1, since this will favour the development of NOB (Wett, 2006; Joss et al., 2009). It should be noted that in systems with larger aggregates (granules), higher DO setpoints can be applied (Volcke et al., 2010). Under more extreme conditions, high free ammonia (8–120 mg N l−1) could decrease AerAOB activity at high ammonium concentrations, high pH and elevated temperatures, or high nitrous acid concentrations (0.2–2.8 mg N l−1) could be inhibitory at high nitrite concentrations, low pH and low temperatures (Anthonisen et al., 1976; Fig. 2). However, these conditions are not likely for OLAND reactors.
Figure 2.
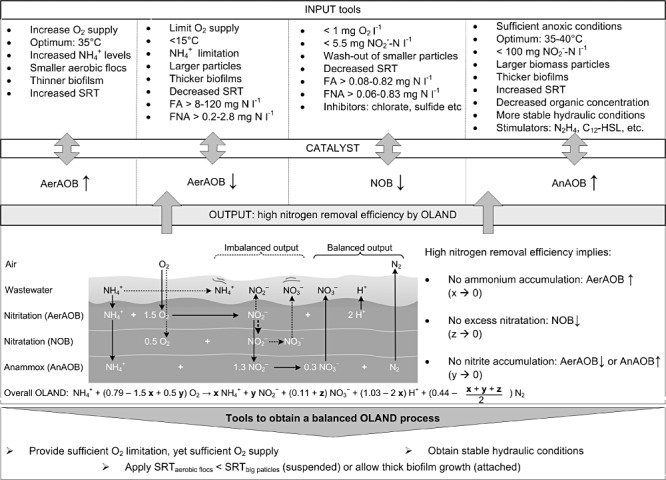
OLAND MRM framework highlighting tools to obtain high nitrogen removal efficiency. FA, free ammonia; FNA, free nitrous acid; SRT, sludge retention time.
If the AnAOB are not able to consume the formed nitrite or AerAOB leave not enough ammonium to combine with nitrite, nitrite accumulation will occur, which in a more extreme case (> 100–250 mg NO2‐‐N l−1, Strous et al., 1999; Egli et al., 2001; Dapena‐Mora et al., 2007) can inhibit AnAOB. Besides lowering the AerAOB activity by operational parameters such as a lower oxygen supply and level, one of the main factors to discounter the difference in growth rate between AerAOB and AnAOB is the separation of the sludge retention of small flocs, containing mainly AerAOB, and larger biomass particles, containing mainly AnAOB (Vlaeminck et al., 2010). Different selection methods are available to decrease the aerobic activity, depending on the applied reactor technology. In SBR systems, selection is based on the selective removal of smaller particles, which have a lower density and hence lower settling velocity. Higher critical particle settling velocities can be imposed by applying a lower settling time and/or a higher volumetric exchange ratio (De Clippeleir et al., 2009). Typical critical settling velocities applied in SBR systems are 0.3–3 m h−1 (Wett, 2006; De Clippeleir et al., 2009; Joss et al., 2009). In granular upflow systems, removal of smaller, nitrifying granules at the top of the sludge bed led to higher biomass‐specific conversion rates (Winkler et al., 2011). In floccular systems, the use of hydrocyclones has been initiated to selectively maintain AnAOB‐containing granules (Wett et al., 2010a). As the AnAOB are the slowest growers in the OLAND system, they should be maximally maintained in the system and stimulated as much as possible. It has been shown in several studies that the AnAOB are sensitive for oxygen (Strous et al., 1997; Egli et al., 2001). The presence of anoxic zones can also be promoted by the use of suspended carrier material in a MBBR (Beier and Schneider, 2008) or by biomass immobilization in a gel matrix (Section Input). Moreover, depending on the reactor technology applied, anoxic reactor zones can be created in space or time. It should be noted that methanol, commonly used as exogenous carbon source for denitrification, is detrimental for anammox (Güven et al., 2005; Dapena‐Mora et al., 2007). Besides prevention of anammox inhibition, anammox can also be stimulated with components such as hydrazine, and dodecanoyl homoserine lactone (De Clippeleir et al., 2011b). Moreover, it was shown in lab‐scale SBR tests that only sufficient AnAOB activity could be obtained in OLAND reactors when stable semi‐continuous hydraulic conditions were applied (De Clippeleir et al., 2009; Schaubroeck et al., 2012). The latter is in congruence with successful full‐scale SBR systems, which apply low volumetric loading rates and semi‐continuous feeding (Wett, 2006; Joss et al., 2009). Note that stable hydraulic conditions also minimize the accumulation of substrates or intermediates, probably resulting in lower NO and N2O emissions (Section Minimizing harmful gas emissions).
Nitrate accumulation due to NOB should be avoided at all time. For high‐strength wastewaters followed by a post‐treatment, NOB can be suppressed in the OLAND system at high free ammonia concentrations (> 5 mg N l−1) and low oxygen concentrations (Vlaeminck et al., 2009b). In the latter case, the AerAOB will have a competitive advantage over the NOB for substrate and space. In the case of diluted wastewater systems which have to reach effluent quality standards, free ammonia levels will not be sufficient anymore to suppress NOB and other methods should be searched especially for application at low temperatures (Section OLAND enabling energy‐positive sewage treatment). One option is the addition of compounds such as sulfide at concentrations of 20–80 mg S l−1 (Erguder et al., 2008) or chlorate at concentrations of 83–830 mg l−1 (Belser and Mays, 1980), which have been shown to inhibit NOB activity. However, as long‐term addition of these compounds could result in adaptation and could also affect AerAOB or AnAOB, this should be avoided as much as possible. Although Nitrospira lacks the common protection mechanisms for reactive oxygen species (Lücker et al., 2010), the addition of peroxide (up to 1.0 g H2O2 l−1) had no influence on the nitratation rate of a nitrifying culture with Nitrospira. In contrast, already at 0.5 g H2O2 l−1, the nitritation rate was significantly inhibited, rendering peroxide addition as a useful strategy to suppress nitratation (T. Vanslambrouck, unpublished). A close interaction between AerAOB and AnAOB could also play a role in avoiding nitratation, as the affinity of the AnAOB for nitrite is higher than the affinity of NOB for nitrite (Lackner et al., 2008). It should be however noted that until now, only limited knowledge exists about the genus/species dependence of these inhibition factors and it is therefore not always straightforward to avoid nitratation.
In general, it is suggested that to obtain a balanced OLAND system with maximum nitrogen removal efficiency, sufficient DO limitation, separation between the SRT of small aerobic flocs and larger anoxic particles as well as stable hydraulic conditions are desired (Fig. 2).
Minimizing harmful gas emissions
In terms of gaseous emissions, sustainability mainly includes minimal emissions of nitric oxide (NO), an ozone degrader, and nitrous oxide (N2O) and methane (CH4), two potent greenhouse gases (GHG).
Methane can be expected in the OLAND influent when treating anaerobic digestates (dissolved at 11 g m−3 at 35°C), and small quantities might be in a non‐aerated phase if all oxygen and nitrate are consumed (Desloover et al., 2011). Aeration causes stripping of this methane. Although this can have a non‐negligible contribution to the overall carbon footprint of the process (Desloover et al., 2011), it is difficult to prevent the emission of dissolved influent methane, unless bubbleless aeration would be used for OLAND, as for instance in a membrane aerated biofilm reactor (Pellicer‐Nacher et al., 2010).
In contrast to methane, the formation of N2O and NO occurs in situ (Fig. 3). As mentioned above, for three monitored full‐scale OLAND‐type of systems, 0.4–1.3% of the nitrogen load was emitted as N2O (Joss et al., 2009; Kampschreur et al., 2009b; Weissenbacher et al., 2010). These values can be considered acceptable, since they do not significantly exceed the N2O emission values from nitrification/denitrification (Kampschreur et al., 2009b). NO emissions are normally ranging from negligible to 0.01% of N load (Joss et al., 2009; Kampschreur et al., 2009b; Weissenbacher et al., 2010), but NO is due to its low water solubility easily emitted when formed. The formation of N2O and NO is complex and often difficult to predict due to the interplay of many parameters and contributors (Fig. 3).
Figure 3.
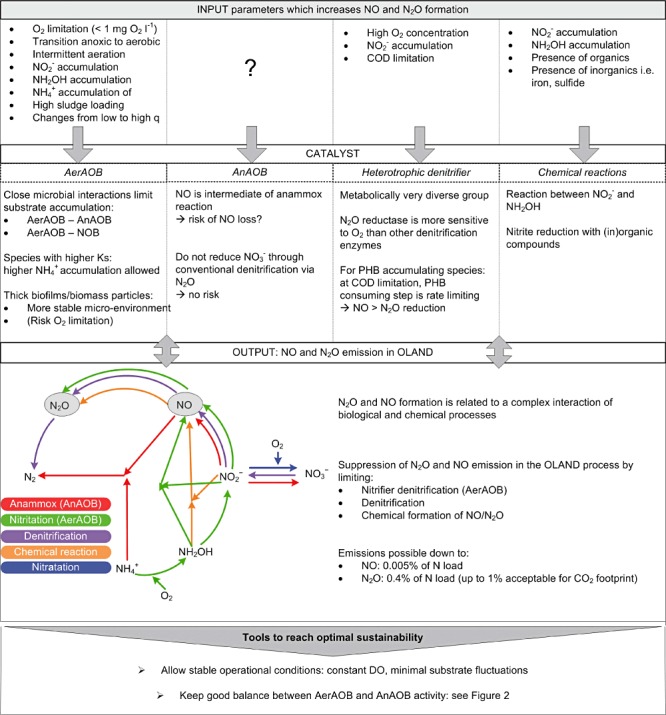
OLAND MRM framework elaborated for the risk of N2O and NO emissions in OLAND systems. q: specific microbial activity.
AerAOB are probably the predominant responsibles for N2O/NO emissions in OLAND, through so‐called ‘nitrifier denitrification’. The dominant energy generation method by AerAOB is via aerobic metabolic pathways (Chain et al., 2003). However, under oxygen limitation or anoxic conditions AerAOB, including Nitrosomonas europaea and N. eutropha, can use NO2‐ or N2O4 as electron acceptors and NH3 or H2 as electron donors to produce NO and N2O, but no N2 (Ritchie and Nicholas, 1972; Poth and Focht, 1985; Schmidt et al., 2004). The oxygen level and regime (i) have profound effects on N2O/NO emissions. At oxygen concentrations below 1 mg O2 l−1, N2O productions up to 10% of the nitrogen load were observed (Goreau et al., 1980). While NO can be produced under both aerobic and complete anoxic conditions (Ritchie and Nicholas, 1972; Yu et al., 2010), N2O formation by AerAOB was only detected at aerobic or microaerophilic conditions. The N2O production by AerAOB mainly occurs at the transition from anoxic to aerobic conditions and is coupled to the presence of accumulated ammonium (Yu et al., 2010). Besides oxygen, nitrite concentrations (ii) play an important role in AerAOB NO and N2O emission (Kampschreur et al., 2009a). Nitrite accumulation is a common malfunctioning in OLAND reactors (Section Maximizing nitrogen removal efficiency), and significantly increases AerAOB N2O emissions (Colliver and Stephenson, 2000). High N2O production is additionally linked to high specific activity or alternatively high metabolic rates (iii) during periods with high nitrogen flux through the catabolic pathways (Yu et al., 2010). Imbalanced enzyme expression in AerAOB performing close to their maximum specific activity (Yu et al., 2010), would suggest that, according to the Monod kinetics, working with an AerAOB community with lower substrate affinities (higher Ks) would yield a bigger risk of N2O emission at lower substrate accumulations. Therefore, process configurations that work under constant specific activity values, which are linked to uniform DO and ammonium concentrations in the reactor, are expected to produce less N2O. In this aspect, discontinuous technologies such as SBR systems have more potential for N2O formation due to more frequent transitions. Slow and long feeding during the reaction phase would result in more stable nitrogen concentrations in the liquid phase (Wett, 2006) and could therefore potentially lower the risk of N2O formation.
Although ammonium‐oxidizing archaea (AOA) have recently been shown to produce N2O (Santoro et al., 2012), so far no AOA have been detected in OLAND systems, rendering their contribution to N2O emissions likely nihil.
Chemical formation of NO/N2O is another, potentially important pathway. An important factor is the accumulation of the AerAOB intermediate hydroxylamine. If this compound accumulates, it can either biochemically by AerAOB (Yu et al., 2010) or purely chemically (van Cleemput, 1998) react with nitrite and form NO and N2O. Moreover, chemical nitrite reduction at neutral pH can occur with ferrous iron (van Cleemput, 1998), sulfide (Grossi, 2009) or organic compounds (van Cleemput, 1998) and will also result in the formation of NO and N2O.
It should be noted that N2O/NO emissions can also be lowered by a decrease of stripping. It was described that NO and N2O emissions increased with the air flow rate because the concentration of both gases remained constant in the gas phase. Therefore NO and N2O emissions can be minimized by minimizing the airflow rate under optimal conditions (Kampschreur et al., 2008) or by using bubbleless aeration in a MABR (Pellicer‐Nacher et al., 2010).
Although denitrification is limited in OLAND systems, typical OLAND conditions promote NO/N2O emissions by denitrifiers. A high nitrite concentration during denitrification suppresses the denitrification rate and therefore leads to NO and N2O accumulation (von Schulthess et al., 1995). Also COD limitation during denitrification is a known cause for NO or N2O accumulation (von Schulthess and Gujer, 1996; Chung and Chung, 2000). Moreover, as oxygen inhibits both the synthesis and activity of denitrifying enzymes and N2O reductase is the most oxygen‐sensitive denitrifying enzyme (Otte et al., 1996), the low DO values typical for OLAND can lead to N2O emission by denitrifiers.
Although NO is a likely one of the AnAOB intermediates (Strous et al., 2006), it is unlikely that AnAOB leak NO, and therefore AnAOB probably do not contribute to NO emissions. Due to the absence of N2O reductase in the AnAOB genome, N2O production is not expected during anammox.
Overall, stable conditions allowing for constant specific microbial activities and avoiding accumulation of nitrite and ammonium likely lead to lower NO and N2O emissions from OLAND systems (Fig. 3). However, the oxygen‐limited conditions needed to avoid NOB activity or caused by well settling sludge remain a risk factor. Note that preliminary measurements of intermittent versus continuous aeration could not point out lower N2O emissions for the latter (Joss et al., 2009). It is expected that future long‐term, on‐line measurements will reveal the best aeration level and regime to minimize NO/N2O emissions.
OLAND enabling energy‐positive sewage treatment
Until now, the OLAND process has been successfully applied for medium and high‐strength nitrogen wastewaters (> 0.2 g N l−1) such as landfill leachate and digestates from sewage sludge, specific industrial streams and concentrated black water. For centralized domestic wastewater treatment, the inclusion of OLAND to treat sludge digestates in the side stream of a conventional wastewater treatment plant (WWTP) lowered the overall plant energy requirements with about 50% (Siegrist et al., 2008). Furthermore, Wett and colleagues (2007) demonstrated energy autarky by including OLAND in the sidestream of a two‐stage activated‐sludge (AS) process (‘AB Verfahren’). In the mainstream, the first AS unit (stage A) has a very high loading rate (SRT ≈ 0.5 day), and the second AS unit (stage B) has a low loading rate (SRT ≈ 10 days). Besides these energy saving options with OLAND in a side stream, a novel treatment scheme was recently proposed, bringing OLAND to the main treatment stream substituting the previous B stage (Wett et al., 2010a; Verstraete and Vlaeminck, 2011). This even allows the electrical energy recovery and savings to exceed the electrical energy input. Moreover, instead of a biological concentration of the sewage, an enhanced physicochemical concentration step can be applied, involving enhanced sedimentation, dissolved air flotation and/or membrane filtration, separating more than 75% of the COD load from the main stream (Verstraete et al., 2009).
A first difference between treatment of the main or side stream is the lower nitrogen concentration to be treated by OLAND (Fig. 4). Domestic wastewater after advanced concentration will still contain most of the nitrogen while around 75% of the COD is removed and sent to the digester, resulting in main stream wastewater with around 30–100 mg N l−1 and 113–300 mg COD l−1 (Metcalf and Eddy, 2003; Tchobanoglous et al., 2003; Henze et al., 2008). Taking into account the affinity constant of the AerAOB and AnAOB for ammonium i.e. 2.4 and 0.07 mg N l−1 respectively and the AnAOB affinity constant for nitrite of 0.05 mg NO2‐N l−1 (Lackner et al., 2008), these low concentrations as such should not be a problem. However, these low substrate conditions could imply that the microbial community will have to work at lower metabolic and lower growth rates compared with side stream processes which allow higher concentrations in the reactor.
Figure 4.
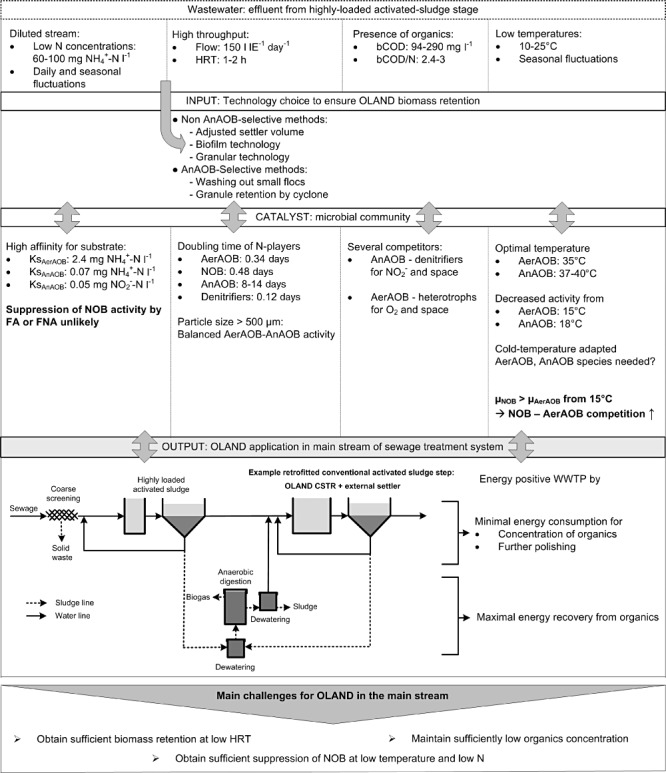
OLAND MRM framework elaborated to elucidate challenges for application of OLAND in the main stream of a sewage treatment plant.
To obtain high nitrogen removal rates at low concentrations, low hydraulic residence times (HRT) are needed for main stream treatment, in the order of hours and hence about 24 times lower than for side stream treatment (Joss et al., 2009; Weissenbacher et al., 2010). Given the slow biomass growth of the AnAOB, good biomass retention is a prerequisite for OLAND activity under low HRT. Sufficient AnAOB retention can be obtained by separating the retention of small aerobic and larger anoxic particles, which selectively will favour the AnAOB retention (see challenge 1). On the other hand, by increasing the external settler volume, applying a granular technology (Abma et al., 2010) or using biofilm‐based technology (De Clippeleir et al., 2011a), the total SRT can be increased.
Besides the survival of the AnAOB under low hydraulic retention times, an important challenge is to obtain a good microbial balance and activity at low temperature. Some studies already described the effect of lower temperatures on the separate activity of AnAOB, AerAOB and NOB. However, limited information exists about the microbial balance of these three groups under OLAND conditions at low temperature. Although AerAOB activity decreased with 50% at a temperature interval from 27°C to 15°C, limited aerobic ammonium oxidation could be observed at 5°C (Guo et al., 2010). For AnAOB the critical temperature at which it was difficult to obtain AnAOB activity was 18°C (Dosta et al., 2008), although several AnAOB species are found in nature at −1°C to 15°C (Dalsgaard et al., 2005). It is not clear whether other AnAOB species, more related to the cold‐temperature marine genus ‘Candidatus Scalindua’, will take over from the WWTP types ‘Candidatus Kuenenia and Brocadia’ at colder temperatures. For inoculation purposes it is important to elucidate if the same AerAOB and AnAOB species do the job at cold temperatures or other species take over. In the latter case, the first start‐ups will be slower again due to the absence of appropriate inoculation sources. The possible loss of both AerAOB and AnAOB activities compared with higher temperatures will result in the accumulation of nitrite and a decrease in oxygen uptake (Wett et al., 2010b). It will therefore be important to adjust the oxygen regime to impose oxygen‐limited conditions to the AerAOB and by this avoid inhibition of AnAOB by nitrite. However, due to the decreased total activity, longer HRT or higher biomass concentrations will be necessary to obtain the same volumetric nitrogen removal rates. Beside the microbial balance between AerAOB and AnAOB, the lower temperature will have an effect on the NOB–AnAOB balance. At temperatures lower than 15°C, the growth rate of NOB will become higher than the growth rate of AerAOB (Hellinga et al., 1998) and it will therefore not be possible to wash out NOB based on overall or even selective sludge retention. The main challenge in this application will therefore be the suppression of NOB at low temperature and low nitrogen concentration (low free ammonia and low nitrous acid).
The last point of attention concerning new inputs in this application domain is the presence of organics, i.e. moderate levels of bCOD (90–240 mg l−1) in the wastewater. Depending on the raw sewage strength, COD/N ratios between 2.4 and 3 are expected after the concentration step, which is on the edge of the described limit for successful OLAND (Lackner et al., 2008). On one hand, the presence of organics will facilitate DO control at low DO levels due to heterotrophic aerobic activity. On the other hand, competition between heterotrophic denitrification and anammox will take place for nitrite. These processes have already been demonstrated to successfully coexist at a COD/N ratio of 2.2 (Desloover et al., 2011). It is anticipated that higher nitrogen sewage levels together with the higher sewage temperature which will facilitate OLAND treatment in the main stream, will exist in the main stream due to further dilution preventions (Henze, 1997; Brombach et al., 2005).
Finally, according to this MRM approach (Fig. 4), to be able to apply OLAND in the main stream of the WWTP, the challenges of biomass retention at low HRT and NOB suppression at low temperature should be first encountered.
Acknowledgments
S.E.V. was supported as a postdoctoral fellow from the Research Foundation Flanders (FWO‐Vlaanderen) and H.D.C. was recipient of a PhD grant from the Institute for the Promotion of Innovation by Science and Technology in Flanders (IWT‐Vlaanderen, No. SB‐81068). The authors gratefully thank Tim Hülsen (Paques bv, Balk, the Netherlands) for the inspiring discussions, and Tijs Vanslambrouck and Adriano Joss for providing data.
References
- Abma W.R., Driessen W., Haarhuis R., van Loosdrecht M.C.M. Upgrading of sewage treatment plant by sustainable and cost‐effective separate treatment of industrial wastewater. Water Sci Technol. 2010;61:1715–1722. doi: 10.2166/wst.2010.977. [DOI] [PubMed] [Google Scholar]
- Anthonisen A.C., Loehr R.C., Prakasam T.B.S., Srinath E.G. Inhibition of nitrification by ammonia and nitrous acid. J Water Pollut Control Fed. 1976;48:835–852. [PubMed] [Google Scholar]
- Barnes D., Bliss P.J. E. & F.N. Spon; 1983. [Google Scholar]
- Beier M., Schneider Y. 2008.
- Belser L.W., Mays E.L. Specific inhibition of nitrite oxidation by chlorate and its use in assessing nitrification in soils and sediments. Appl Environ Microbiol. 1980;39:505–510. doi: 10.1128/aem.39.3.505-510.1980. [DOI] [PMC free article] [PubMed] [Google Scholar]
- Bettazzi E., Caffaz S., Vannini C., Lubello C. Nitrite inhibition and intermediates effects on Anammox bacteria: a batch‐scale experimental study. Process Biochem. 2010;45:573–580. [Google Scholar]
- Brombach H., Weiss G., Fuchs S. A new database on urban runoff pollution: comparison of separate and combined sewer systems. Water Sci Technol. 2005;51:119–128. [PubMed] [Google Scholar]
- Chain P., Lamerdin J., Larimer F., Regala W., Lao V., Land M. Complete genome sequence of the ammonia‐oxidizing bacterium and obligate chemolithoautotroph Nitrosomonas europaea. J Bacteriol. 2003;185:2759–2773. doi: 10.1128/JB.185.9.2759-2773.2003. et al. [DOI] [PMC free article] [PubMed] [Google Scholar]
- Chung Y.C., Chung M.S. BNP test to evaluate the influence of C/N ratio on N2O production in biological denitrification. Water Sci Technol. 2000;42:23–27. [Google Scholar]
- van Cleemput O. Subsoils: chemo‐ and biological denitrification, N2O and N2 emissions. Nutr Cycling Agroecosyst. 1998;52:187–194. [Google Scholar]
- Colliver B.B., Stephenson T. Production of nitrogen oxide and dinitrogen oxide by autotrophic nitrifiers. Biotechnol Adv. 2000;18:219–232. doi: 10.1016/s0734-9750(00)00035-5. [DOI] [PubMed] [Google Scholar]
- Courtens E., De Clippeleir H., Vlaeminck S.E., Boon N., Verstraete W. 2011. , and ) Simple strategies to control the oxygen budget of an OLAND rotating biological contactor. In 1st international symposium on Microbial resource management in biotechnology: Concepts & applications. Gent, Belgium. [PubMed]
- Dalsgaard T., Thamdrup B., Canfield D.E. Anaerobic ammonium oxidation (anammox) in the marine environment. Res Microbiol. 2005;156:457–464. doi: 10.1016/j.resmic.2005.01.011. [DOI] [PubMed] [Google Scholar]
- Dapena‐Mora A., Fernandez I., Campos J.L., Mosquera‐Corral A., Mendez R., Jetten M.S.M. Evaluation of activity and inhibition effects on Anammox process by batch tests based on the nitrogen gas production. Enzyme Microb Technol. 2007;40:859–865. [Google Scholar]
- De Clippeleir H., Vlaeminck S.E., Carballa M., Verstraete W. A low volumetric exchange ratio allows high autotrophic nitrogen removal in a sequencing batch reactor. Bioresour Technol. 2009;100:5010–5015. doi: 10.1016/j.biortech.2009.05.031. [DOI] [PubMed] [Google Scholar]
- De Clippeleir H., Yan X.G., Verstraete W., Vlaeminck S.E. OLAND is feasible to treat sewage‐like nitrogen concentrations at low hydraulic residence times. Appl Microbiol Biotechnol. 2011a;90:1537–1545. doi: 10.1007/s00253-011-3222-6. [DOI] [PubMed] [Google Scholar]
- De Clippeleir H., Defoirdt T., Vanhaecke L., Vlaeminck S.E., Carballa M., Verstraete W., Boon N. Long‐chain acylhomoserine lactones increase the anoxic ammonium oxidation rate in an OLAND biofilm. Appl Microbiol Biotechnol. 2011b;90:1511–1519. doi: 10.1007/s00253-011-3177-7. [DOI] [PubMed] [Google Scholar]
- Denecke M., Rekers V., Walter U. Einsparpotenziale bei der biologischen Reinigung von Deponiesickerwasser (Cost saving potentials in the biological treatment of landfill leachate) Muell Abfall. 2007;39:4–7. [Google Scholar]
- Desloover J., De Clippeleir H., Boeckx P., Du Laing G., Colsen J., Verstraete W., Vlaeminck S.E. Floc‐based sequential partial nitritation and anammox at full scale with contrasting N2O emissions. Water Res. 2011;45:2811–2821. doi: 10.1016/j.watres.2011.02.028. [DOI] [PubMed] [Google Scholar]
- Dosta J., Fernandez I., Vazquez‐Padin J.R., Mosquera‐Corral A., Campos J.L., Mata‐Alvarez J., Mendez R. Short‐ and long‐term effects of temperature on the Anammox process. J Hazard Mater. 2008;154:688–693. doi: 10.1016/j.jhazmat.2007.10.082. [DOI] [PubMed] [Google Scholar]
- Egli K., Fanger U., Alvarez P.J.J., Siegrist H., van der Meer J.R., Zehnder A.J.B. Enrichment and characterization of an anammox bacterium from a rotating biological contactor treating ammonium‐rich leachate. Arch Microbiol. 2001;175:198–207. doi: 10.1007/s002030100255. [DOI] [PubMed] [Google Scholar]
- Erguder T.H., Boon N., Vlaeminck S.E., Verstraete W. Partial nitrification achieved by pulse sulfide doses in a sequential batch reactor. Environ Sci Technol. 2008;42:8715–8720. doi: 10.1021/es801391u. [DOI] [PubMed] [Google Scholar]
- Europe's Energy Portal. 2011. ) Feed‐in tariffs [WWW document]. URL http://www.energy.eu/#feedin. Accessed 19 August 2010.
- Fux C., Siegrist H. Nitrogen removal from sludge digester liquids by nitrification/denitrification or partial nitritation/anammox: environmental and economical considerations. Water Sci Technol. 2004;50:19–26. [PubMed] [Google Scholar]
- Goreau T.J., Kaplan W.A., Wofsy S.C., McElroy M.B., Valois F.W., Watson S.W. Production of NO2‐ and N2O by nitrifying bacteria at reduced concentrations of oxygen. Appl Environ Microbiol. 1980;40:526–532. doi: 10.1128/aem.40.3.526-532.1980. [DOI] [PMC free article] [PubMed] [Google Scholar]
- Grossi L. Hydrogen sulfide induces nitric oxide release from nitrite. Bioorg Med Chem Lett. 2009;19:6092–6094. doi: 10.1016/j.bmcl.2009.09.030. [DOI] [PubMed] [Google Scholar]
- Guo J.H.G.J.H., Peng Y.Z., Huang H.J., Wang S.Y., Ge S.J., Zhang J.R., Wang Z.W. Short‐ and long‐term effects of temperature on partial nitrification in a sequencing batch reactor treating domestic wastewater. J Hazard Mater. 2010;179:471–479. doi: 10.1016/j.jhazmat.2010.03.027. [DOI] [PubMed] [Google Scholar]
- Güven D., Dapena A., Kartal B., Schmid M.C., Maas B., van de Pas‐Schoonen K. Propionate oxidation by and methanol inhibition of anaerobic ammonium‐oxidizing bacteria. Appl Environ Microbiol. 2005;71:1066–1071. doi: 10.1128/AEM.71.2.1066-1071.2005. et al. [DOI] [PMC free article] [PubMed] [Google Scholar]
- Hellinga C., Schellen A., Mulder J.W., van Loosdrecht M.C.M., Heijnen J.J. The SHARON process: an innovative method for nitrogen removal from ammonium‐rich waste water. Water Sci Technol. 1998;37:135–142. [Google Scholar]
- Henze M. Waste design for households with respect to water, organics and nutrients. Water Sci Technol. 1997;35:113–120. [Google Scholar]
- Henze M., Van Loosdrecht M.C.M., Ekama G.A., Brdjanovic D. IWA publishing; 2008. [Google Scholar]
- Hippen A., Helmer C., Kunst S., Rosenwinkel K.H., Seyfried C.F. Six years' practical experience with aerobic/anoxic deammonification in biofilm systems. Water Sci Technol. 2001;44:39–48. [PubMed] [Google Scholar]
- Holm‐Nielsen J.B., Al Seadi T., Oleskowicz‐Popiel P. The future of anaerobic digestion and biogas utilization. Bioresour Technol. 2009;100:5478–5484. doi: 10.1016/j.biortech.2008.12.046. [DOI] [PubMed] [Google Scholar]
- Isaka K., Date Y., Kimura Y., Sumino T., Tsuneda S. Nitrogen removal performance using anaerobic ammonium oxidation at low temperatures. FEMS Microbiol Lett. 2008;282:32–38. doi: 10.1111/j.1574-6968.2008.01095.x. [DOI] [PubMed] [Google Scholar]
- Jaroszynski L.W., Oleszkiewicz J.A. Autotrophic ammonium removal from reject water: partial nitrification and anammox in one‐reactor versus two‐reactor systems. Environ Technol. 2011;32:289–294. doi: 10.1080/09593330.2010.497500. [DOI] [PubMed] [Google Scholar]
- Jeanningros Y., Vlaeminck S.E., Kaldate A., Verstraete W., Graveleau L. Fast start‐up of a pilot‐scale deammonification sequencing batch reactor from an activated sludge inoculum. Water Sci Technol. 2010;61:1393–1400. doi: 10.2166/wst.2010.019. [DOI] [PubMed] [Google Scholar]
- Joss A., Salzgeber D., Eugster J., Konig R., Rottermann K., Burger S. Full‐scale nitrogen removal from digester liquid with partial nitritation and anammox in one SBR. Environ Sci Technol. 2009;43:5301–5306. doi: 10.1021/es900107w. et al. [DOI] [PubMed] [Google Scholar]
- Kampschreur M.J., van der Star W.R.L., Wielders H.A., Mulder J.W., Jetten M.S.M., van Loosdrecht M.C.M. Dynamics of nitric oxide and nitrous oxide emission during full‐scale reject water treatment. Water Res. 2008;42:812–826. doi: 10.1016/j.watres.2007.08.022. [DOI] [PubMed] [Google Scholar]
- Kampschreur M.J., Temmink H., Kleerebezem R., Jetten M.S.M., van Loosdrecht M.C.M. Nitrous oxide emission during wastewater treatment. Water Res. 2009a;43:4093–4103. doi: 10.1016/j.watres.2009.03.001. [DOI] [PubMed] [Google Scholar]
- Kampschreur M.J., Poldermans R., Kleerebezem R., van der Star W.R.L., Haarhuis R., Abma W.R. Emission of nitrous oxide and nitric oxide from a full‐scale single‐stage nitritation‐anammox reactor. Water Sci Technol. 2009b;60:3211–3217. doi: 10.2166/wst.2009.608. et al. [DOI] [PubMed] [Google Scholar]
- Kemper K., Yepes G., Garn M. The World Bank: Transportation, Water and Urban Development Department; 1994. [Google Scholar]
- Kuai L.P., Verstraete W. Ammonium removal by the oxygen‐limited autotrophic nitrification‐denitrification system. Appl Environ Microbiol. 1998;64:4500–4506. doi: 10.1128/aem.64.11.4500-4506.1998. [DOI] [PMC free article] [PubMed] [Google Scholar]
- Lackner S., Terada A., Smets B.F. Heterotrophic activity compromises autotrophic nitrogen removal in membrane‐aerated biofilms: results of a modeling study. Water Res. 2008;42:1102–1112. doi: 10.1016/j.watres.2007.08.025. [DOI] [PubMed] [Google Scholar]
- Lee N., Nielsen P.H., Andreasen K.H., Juretschko S., Nielsen J.L., Schleifer K.H., Wagner M. Combination of fluorescent in situ hybridization and microautoradiography – a new tool for structure‐function analyses in microbial ecology. Appl Environ Microbiol. 1999;65:1289–1297. doi: 10.1128/aem.65.3.1289-1297.1999. [DOI] [PMC free article] [PubMed] [Google Scholar]
- Lemaire R., Webb R.I., Yuan Z.G. Micro‐scale observations of the structure of aerobic microbial granules used for the treatment of nutrient‐rich industrial wastewater. ISME J. 2008;2:528–541. doi: 10.1038/ismej.2008.12. [DOI] [PubMed] [Google Scholar]
- Lücker S., Wagner M., Maixner F., Pelletier E., Koch H., Vacherie B. A Nitrospira metagenome illuminates the physiology and evolution of globally important nitrite‐oxidizing bacteria. Proc Natl Acad Sci USA. 2010;107:13479–13484. doi: 10.1073/pnas.1003860107. et al. [DOI] [PMC free article] [PubMed] [Google Scholar]
- Mateju V., Cizinska S., Krejci J., Janoch T. Biological water denitrification – a review. Enzyme Microb Technol. 1992;14:170–183. [Google Scholar]
- Mathure P., Patwardhan A. Comparison of mass transfer efficiency in horizontal rotating packed beds and rotating biological contactors. J Chem Technol Biotechnol. 2005;80:413–419. [Google Scholar]
- Metcalf, Eddy . McGraw‐Hill; 2003. [Google Scholar]
- Meulman B., Elzinga N., Gorter K., Zeeman G., Buisman C.J.N., Vlaeminck S.E., Verstraete W. 2010. , and ) Pilot‐scale demonstration of sustainable C and N removal from concentrated black water. In IWA World Water Congress & Exhibition. Montréal, Canada.
- Mulder A. The quest for sustainable nitrogen removal technologies. Water Sci Technol. 2003;48:67–75. [PubMed] [Google Scholar]
- Nielsen M., Bollmann A., Sliekers O., Jetten M., Schmid M., Strous M. Kinetics, diffusional limitation and microscale distribution of chemistry and organisms in a CANON reactor. FEMS Microbiol Ecol. 2005;51:247–256. doi: 10.1016/j.femsec.2004.09.003. et al. [DOI] [PubMed] [Google Scholar]
- Otte S., Grobben N.G., Robertson L.A., Jetten M.S.M., Kuenen J.G. Nitrous oxide production by Alcaligenes faecalis under transient and dynamic aerobic and anaerobic conditions. Appl Environ Microbiol. 1996;62:2421–2426. doi: 10.1128/aem.62.7.2421-2426.1996. [DOI] [PMC free article] [PubMed] [Google Scholar]
- Pellicer‐Nacher C., Sun S.P., Lackner S., Terada A., Schreiber F., Zhou Q., Smets B.F. Sequential aeration of membrane‐aerated biofilm reactors for high‐rate autotrophic nitrogen removal: experimental demonstration. Environ Sci Technol. 2010;44:7628–7634. doi: 10.1021/es1013467. [DOI] [PubMed] [Google Scholar]
- Poth M., Focht D.D. 15N kinetic analysis of N2O production by Nitrosomonas europaea: an examination of nitrifier denitrification. Appl Environ Microbiol. 1985;49:1134–1141. doi: 10.1128/aem.49.5.1134-1141.1985. [DOI] [PMC free article] [PubMed] [Google Scholar]
- Pynaert K., Smets B.F., Wyffels S., Beheydt D., Siciliano S.D., Verstraete W. Characterization of an autotrophic nitrogen‐removing biofilm from a highly loaded lab‐scale rotating biological contactor. Appl Environ Microbiol. 2003;69:3626–3635. doi: 10.1128/AEM.69.6.3626-3635.2003. [DOI] [PMC free article] [PubMed] [Google Scholar]
- Rekers V., Denecke M., Walter U. 2008. , and ) Betriebserfahrungen mit der anaeroben Deammonifikation von Deponiesickerwasser (Operational experiences with the anaerobic deammonification of landfill leachate). In Depotech 2008. Leoben, Austria: Institut für nachhaltige Abfallwirtschaft und Entsorgungstechnik.
- Ritchie G.A.F., Nicholas D.J.D. Identification of the sources of nitrous oxide produced by oxidative and reductive processes in Nitrosomonas europaea. Biochem J. 1972;126:1181–1191. doi: 10.1042/bj1261181. [DOI] [PMC free article] [PubMed] [Google Scholar]
- Santoro A.E., Buchwald C., McIlvin M.R., Casciotti K.L. Isotopic signature of N2O produced by marine ammonia‐oxidizing archaea. Science. 2012;333:1282–1285. doi: 10.1126/science.1208239. [DOI] [PubMed] [Google Scholar]
- Schaubroeck T., Bagchi S., De Clippeleir H., Boon N., Carballa M., Verstraete W., Vlaeminck S.E. 2012. , and ) Successful hydraulic strategies to start up OLAND sequencing batch reactors at lab scale. Microb Biotechnol (in press). doi:10.1111/j.1751‐7915.2011.00326.x.
- Schmid M., Twachtmann U., Klein M., Strous M., Juretschko S., Jetten M. Molecular evidence for genus level diversity of bacteria capable of catalyzing anaerobic ammonium oxidation. Syst Appl Microbiol. 2000;23:93–106. doi: 10.1016/S0723-2020(00)80050-8. et al. [DOI] [PubMed] [Google Scholar]
- Schmid M., Walsh K., Webb R., Rijpstra W.I.C., van de Pas‐Schoonen K., Verbruggen M.J. Candidatus ‘Scalindua brodae’, sp nov., Candidatus ‘Scalindua wagneri’, sp nov., two new species of anaerobic ammonium oxidizing bacteria. Syst Appl Microbiol. 2003;26:529–538. doi: 10.1078/072320203770865837. et al. [DOI] [PubMed] [Google Scholar]
- Schmidt I., van Spanning R.J.M., Jetten M.S.M. Denitrification and ammonia oxidation by Nitrosomonas europaea wild‐type, and NirK‐ and NorB‐deficient mutants. Microbiology-Sgm. 2004;150:4107–4114. doi: 10.1099/mic.0.27382-0. [DOI] [PubMed] [Google Scholar]
- von Schulthess R., Gujer W. Release of nitrous oxide (N2O) from denitrifying activated sludge: verification and application of a mathematical model. Water Res. 1996;30:521–530. [Google Scholar]
- von Schulthess R., Kühni M., Gujer W. Release of nitric and nitrous oxides from denitrifying activated sludge. Water Res. 1995;29:215–226. [Google Scholar]
- Siegrist H., Salzgeber D., Eugster J., Joss A. Anammox brings WWTP closer to energy autarky due to increased biogas production and reduced aeration energy for N‐removal. Water Sci Technol. 2008;57:383–388. doi: 10.2166/wst.2008.048. [DOI] [PubMed] [Google Scholar]
- van der Star W.R.L., Abma W.R., Blommers D., Mulder J.W., Tokutomi T., Strous M. Startup of reactors for anoxic ammonium oxidation: experiences from the first full‐scale anammox reactor in Rotterdam. Water Res. 2007;41:4149–4163. doi: 10.1016/j.watres.2007.03.044. et al. [DOI] [PubMed] [Google Scholar]
- Strous M., van Gerven E., Kuenen J.G., Jetten M. Effects of aerobic and microaerobic conditions on anaerobic ammonium‐oxidizing (Anammox) sludge. Appl Environ Microbiol. 1997;63:2446–2448. doi: 10.1128/aem.63.6.2446-2448.1997. [DOI] [PMC free article] [PubMed] [Google Scholar]
- Strous M., Heijnen J.J., Kuenen J.G., Jetten M.S.M. The sequencing batch reactor as a powerful tool for the study of slowly growing anaerobic ammonium‐oxidizing microorganisms. Appl Microbiol Biotechnol. 1998;50:589–596. [Google Scholar]
- Strous M., Kuenen J.G., Jetten M.S.M. Key physiology of anaerobic ammonium oxidation. Appl Environ Microbiol. 1999;65:3248–3250. doi: 10.1128/aem.65.7.3248-3250.1999. [DOI] [PMC free article] [PubMed] [Google Scholar]
- Strous M., Pelletier E., Mangenot S., Rattei T., Lehner A., Taylor M.W. Deciphering the evolution and metabolism of an anammox bacterium from a community genome. Nature. 2006;440:790–794. doi: 10.1038/nature04647. et al. [DOI] [PubMed] [Google Scholar]
- Tang C.J., Zheng P., Chen T.T., Zhang J.Q., Mahmood Q., Ding S.A. Enhanced nitrogen removal from pharmaceutical wastewater using SBA‐ANAMMOX process. Water Res. 2011;45:201–210. doi: 10.1016/j.watres.2010.08.036. et al. [DOI] [PubMed] [Google Scholar]
- Tchobanoglous G., Burton F.L., Stensel H.D. McGraw‐Hill; 2003. [Google Scholar]
- Tokutomi T., Yamauchi H., Nishimura S., Yoda M., Abma W. Application of the nitritation and Anammox process into inorganic nitrogenous wastewater from semiconductor factory. J Environ Eng. 2011;137:146–154. [Google Scholar]
- Udert K.M., Kind E., Teunissen M., Jenni S., Larsen T.A. Effect of heterotrophic growth on nitritation/anammox in a single sequencing batch reactor. Water Sci Technol. 2008;58:277–284. doi: 10.2166/wst.2008.389. [DOI] [PubMed] [Google Scholar]
- Verstraete W., Vlaeminck S.E. ZeroWasteWater: short‐cycling of wastewater resources for sustainable cities of the future. Int J Sustain Dev World Ecol. 2011;18:253–264. [Google Scholar]
- Verstraete W., Wittelbolle L., Heylen K., Vanparys B., de Vos P., van de Wiele T., Boon N. Microbial resource management: the road to go for environmental biotechnology. Eng Life Sci. 2007;7:117–126. [Google Scholar]
- Verstraete W., de Caveye P.V., Diamantis V. Maximum use of resources present in domestic ‘used water’. Bioresour Technol. 2009;100:5537–5545. doi: 10.1016/j.biortech.2009.05.047. [DOI] [PubMed] [Google Scholar]
- Villegas J.D., de Laclos H.F., Dovat J., Membrez Y., Holliger C. Nitrogen removal from digested manure in a simple one‐stage process. Water Sci Technol. 2011;63:1991–1996. doi: 10.2166/wst.2011.430. [DOI] [PubMed] [Google Scholar]
- Vlaeminck S.E., Geets J., Vervaeren H., Boon N., Verstraete W. Reactivation of aerobic and anaerobic ammonium oxidizers in OLAND biomass after long‐term storage. Appl Microbiol Biotechnol. 2007;74:1376–1384. doi: 10.1007/s00253-006-0770-2. [DOI] [PubMed] [Google Scholar]
- Vlaeminck S.E., Cloetens L.F.F., Carballa M., Boon N., Verstraete W. Granular biomass capable of partial nitritation and anammox (vol 58, pg 1113, 2008) Water Sci Technol. 2009a;59:609–617. doi: 10.2166/wst.2008.731. [DOI] [PubMed] [Google Scholar]
- Vlaeminck S.E., Terada A., Smets B.F., Van der Linden D., Boon N., Verstraete W., Carballa M. Nitrogen removal from digested black water by one‐stage partial nitritation and anammox. Environ Sci Technol. 2009b;43:5035–5041. doi: 10.1021/es803284y. [DOI] [PubMed] [Google Scholar]
- Vlaeminck S.E., Terada A., Smets B.F., De Clippeleir H., Schaubroeck T., Bolca S. Aggregate size and architecture determine microbial activity balance for one‐stage partial nitritation and anammox. Appl Environ Microbiol. 2010;76:900–909. doi: 10.1128/AEM.02337-09. et al. [DOI] [PMC free article] [PubMed] [Google Scholar]
- Vlaeminck S.E., Hay A.G., Maignien L., Verstraete W. In quest of the nitrogen oxidizing prokaryotes of the early Earth. Environ Microbiol. 2011;13:283–295. doi: 10.1111/j.1462-2920.2010.02345.x. [DOI] [PubMed] [Google Scholar]
- Volcke E.I.P., Picioreanu C., De Baets B., van Loosdrecht M.C.M. Effect of granule size on autotrophic nitrogen removal in a granular sludge reactor. Environ Technol. 2010;31:1271–1280. doi: 10.1080/09593331003702746. [DOI] [PubMed] [Google Scholar]
- Weissenbacher N., Takacs I., Murthy S., Fuerhacker M., Wett B. Gaseous nitrogen and carbon emissions from a full‐scale deammonification plant. Water Environ Res. 2010;82:169–175. doi: 10.2175/106143009x447867. [DOI] [PubMed] [Google Scholar]
- Wett B. Solved upscaling problems for implementing deammonification of rejection water. Water Sci Technol. 2006;53:121–128. doi: 10.2166/wst.2006.413. [DOI] [PubMed] [Google Scholar]
- Wett B., Buchauer K., Fimml C. 2007. , and ) Energy self‐sufficiency as a feasible concept for wastewater treatment systems. In IWA Leading Edge Technology Conference. Singapore.
- Wett B., Nyhuis G., Hell M., Takács I., Murthy S. 2010a. , and ) Development of enhanced deammonification selector. In WEFTEC 2010. New Orleans, USA. [DOI] [PubMed]
- Wett B., Hell M., Nyhuis G., Puempel T., Takacs I., Murthy S. Syntrophy of aerobic and anaerobic ammonia oxidisers. Water Sci Technol. 2010b;61:1915–1922. doi: 10.2166/wst.2010.969. [DOI] [PubMed] [Google Scholar]
- Winkler M.K.H., Kleerebezem R., Kuenen J.G., Yang J., van Loosdrecht M.C.M. 2011. , and ) Segregation of biomass in cyclic anaerobic/aerobic granular sludge allows the enrichment of anaerobic ammonium oxidizing bacteria. In 1st international symposium on Microbial resource management in biotechnology: Concepts & applications. Gent, Belgium.
- Wyffels S., Boeckx P., Pynaert K., Zhang D., Van Cleemput O., Chen G., Verstraete W. Nitrogen removal from sludge reject water by a two‐stage oxygen‐limited autotrophic nitrification denitrification process. Water Sci Technol. 2004;49:57–64. [PubMed] [Google Scholar]
- Yan J., Hu Y.Y. Partial nitrification to nitrite for treating ammonium‐rich organic wastewater by immobilized biomass system. Bioresour Technol. 2009;100:2341–2347. doi: 10.1016/j.biortech.2008.11.038. [DOI] [PubMed] [Google Scholar]
- Yu R., Kampschreur M.J., van Loosdrecht M.C.M., Chandran K. Mechanisms and specific directionality of autotrophic nitrous oxide and nitric oxide generation during transient anoxia. Environ Sci Technol. 2010;44:1313–1319. doi: 10.1021/es902794a. [DOI] [PubMed] [Google Scholar]
- Zessner M., Lampert C., Kroiss H., Lindtner S. Cost comparison of wastewater in Danubian countries. Water Sci Technol. 2010;62:223–230. doi: 10.2166/wst.2010.271. [DOI] [PubMed] [Google Scholar]
- Zhu G.‐L., Hu Y.‐Y., Wang Q.‐R. Nitrogen removal performance of anaerobic ammonia oxidation co‐culture immobilized in different gel carriers. Water Sci Technol. 2009;59:2379–2386. doi: 10.2166/wst.2009.293. [DOI] [PubMed] [Google Scholar]
- Zubrowska‐Sudol M., Yang J., Trela J., Plaza E. Evaluation of deammonification process performance at different aeration strategies. Water Sci Technol. 2011;63:1168–1176. doi: 10.2166/wst.2011.356. [DOI] [PubMed] [Google Scholar]