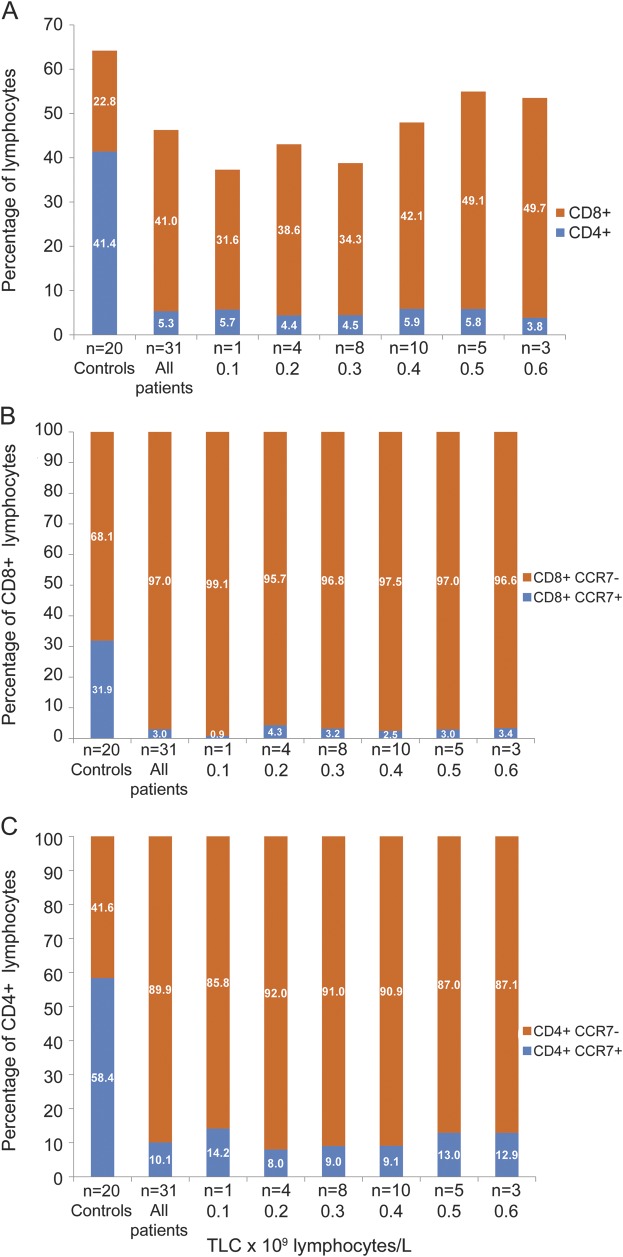
Figure 2. Lymphocyte subset analysis in whole blood of fingolimod-treated patients.
Cross-sectional analysis of whole-blood samples of patients receiving therapy showing mean percentage CD8+ and CD4+ lymphocytes (A), CD8+CCR7+ and CCR7− cells (B), and CD4+CCR7+ and CCR7– cells (C) in relation to total lymphocyte counts (TLCs) in fingolimod-treated patients and controls.

