Abstract
The DNA nanofilter is a microfabricated electrophoretic separation device consisting of a periodic array of thin slits (circa 60 nm) separated by deeper wells (circa 320 nm). We demonstrate that this device can act as a tuneable, clog-free filter when operating in a low frequency, asymmetric field inversion mode. This filtration occurs by using the asymmetric field inversion to achieve bi-directional migration of short (less than 1000 bp) DNA. Moreover, similar ratchet-type operation can improve separations when compared to a constant field separation in the same device. These modes of operation enhance the utility of the DNA nanofilter as a component of integrated lab-on-a-chip devices. The experimental data confirm theoretical predictions for the bidirectional transport of DNA in entropy-based separations.
Introduction
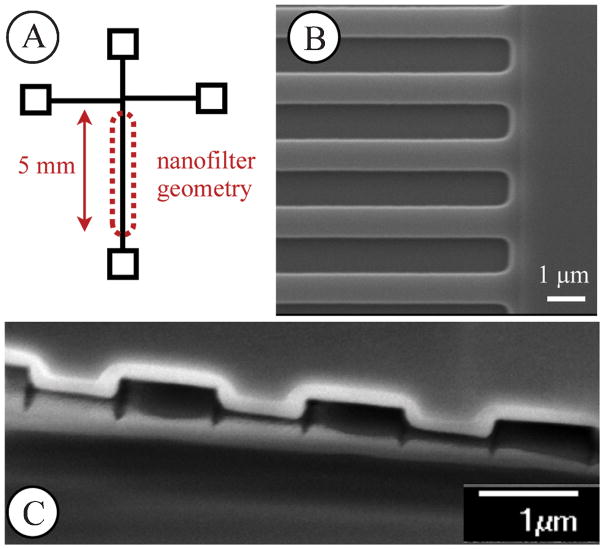
The DNA “nanofilter”1, seen in Fig. 1, is one of a bevy of microfabricated devices used to enhance DNA separations or study the basic physics of DNA electrophoresis2,3. Under a constant electric field, this device separates short DNA (less than approximately 1000 base pairs, bp) as a function of molecular weight. If the time scale for electrophoresis is slow compared to diffusion, the resulting near-equilibrium separation is analogous to standard chromatography4. Due to excluded volume interactions in the slit, the partition coefficient between the slit and the well is a function of the molecular weight of the DNA5. The shorter DNA have more degrees of freedom in the slit, whereupon they elute from the device first1,4,6–9. Under a strong dc electric field, the physics of the DNA motion are less well understood10,11. Importantly, for any constant value of the electric field, all of the DNA molecules move from the inlet to the outlet of the device. As a result, a nanofilter operating under a constant electric field does not actually filter the DNA in the conventional sense. Rather, it serves as a medium for separating the DNA as a function of their size.
Fig. 1.
(A) Schematic of the shifted-T channel geometry including the 5 mm separation arm containing the nanofilter geometry. Voltages are applied via platinum electrodes in the reservoirs to control the electric fields. (B) Top-down scanning electron microscope image of the wells and slits comprising the nanofilter. The slit and well length are 1 μm and the DNA travels, on average, from the top to bottom in this figure. (C) A scanning electron microscope image of the cross section of the device. The top layer is the silicon, with the white film being the silicon dioxide layer. The bottom layer is the glass.
We show here that, as predicted by theory12,13, the electric field in the nanofilter device can be tuned to operate as a “temporal asymmetry ratchet”13 that only allows those DNA smaller than a critical molecular weight to reach the end of the device. In doing so, we expand the practical functionality of the slit-well motif2 from separations to actual filtration. Since the ratchet nanofilter described here provides a molecular weight cut-off without clogging like a traditional filter, it should become a useful component of the microfluidics toolbox. In addition to demonstrating experimentally the principle of ratchet nanofiltration, we also show that a temporal asymmetry ratchet that permits all of the DNA to elute from the device can enhance their separation when compared to a constant electric field separation.
Theory
Let us first recall the relevant theory for a temporal asymmetry ratchet12,13. Denote the electrophoretic velocity of a DNA molecule of N base pairs by ν(N, E), where E is the magnitude of the electric field resulting from an imposed potential drop across the nanofilter. It will prove convenient to also define an electrophoretic mobility, . For a time t1, we apply an electric field of strength E1 from bottom-to-top in Fig. 1A, such that the negatively charged DNA move from top-to-bottom. Subsequently, for a time t2 we apply an electric field E2 ≠ E1 from top-to-bottom. In both cases i = (1, 2), the time is chosen such that the distance travelled by the DNA under the given electric field Ei is long compared to the nanofilter pitch. As a result, the corresponding velocity νi(N, Ei) is approximately the average velocity of the DNA under a constant electric field, ignoring the brief transience in the velocity when the electric field changes direction and magnitude. The net velocity of the DNA of size N from top-to-bottom in Fig. 1 is then
| (1) |
If the velocity is a linear function of the electric field, ν = μ(N)E, as is the case for Ogston sieving in gel electrophoresis14, then all of the DNA should move in the direction of the time-averaged electric field,
| (2) |
albeit at different speeds. However, if the velocity is a nonlinear function of electric field, Eq. (1) allows for the possibility that DNA of different sizes may move in different directions. It is known from prior experimental work4 that the DNA electrophoretic mobility in the nanofilter geometry is indeed a nonlinear function of the electric field, and that this function depends on molecular weight.
To achieve filtration in the conventional sense, where the smaller DNA pass through the filter and the larger DNA are retained, it is not sufficient to simply have a mobility μ = μ(N, E)that depends on both the size of the DNA and the electric field. We also need be able to select values of Ei and ti such that there exists a critical molecular weight N* where νnet(N < N*) > 0 and νnet(N > N*) < 0. The requisite conditions for Ei and ti are not always readily apparent, but they can be determined if we know the functional form of μ(N, E) under a steady electric field. For example, Tessier and Slater13 found one such condition via simulations of DNA electrophoresis in the entropic trap array15, which is a slit-well motif for separating long DNA. In the present circumstances, the semi-phenomenological model4 used to describe DNA electrophoresis in the nanofilter array permits many monotonically decreasing functions of νnet(N) for given values for Ei and ti. To achieve filtration, we need to select one such set of values for Ei and ti such that the monotonic function νnet(N) passes through zero at the desired value N*.
In many cases of interest, the particular DNA in the mixture may not contain any species where N ≈ N*. In these circumstances, no DNA are entrained inside the filter; long DNA that enter the array are shuttled back to the inlet while the shorter DNA are allowed to pass through to the outlet. Even if the mixture contains a species with zero net velocity under the temporal asymmetry ratchet, this species can easily be removed by applying a backward pulse after recovering the eluted products. As a result, a ratchet nanofilter performance does not decrease due to clogging, as is the case in traditional filtration.
Methods
We used projection photolithography and reactive ion etching to build the nanofilter device. We first spin-coated a 700 nm layer of SPR995-CM photoresist (Rohm and Haas) on a four-inch silicon wafer. This photoresist layer was exposed on a projection lithography stepper (Canon FPA 2500 i3) using a photomask that contains the fluid reservoirs and connecting channels (Fig. 1A), which have a width of 30 μm. After developing, we used a deep trench etching process (Plasma-Therm SLR 770) to etch the exposed portions of the wafer to a depth of 60 nm, as measured by profilometry. We then spin-coated a new layer of photoresist on the etched wafer and aligned a second mask to the features on the etched wafer. This second mask was identical to the first photomask except that it had 1 μm long stripes in the nanofilter geometry region that prevented exposure of the slit portion during photolithography. After exposure and development, we etched all exposed areas of the wafer to a depth of 320 nm, again confirmed by confocal microscopy and surface profilometry. The device then was cleaned using oxygen plasma followed by a piranha bath. We then deposited a 100 nm layer of low stress nitride on the whole wafer using low pressure chemical vapor deposition. We removed the nitride layer on the fluid reservoir portions of the device, and then used potassium hydroxide at 90°C for 6 hours to etch the reservoirs through the wafer. We immersed the wafer in phosphoric acid at 160°C for 12 hours to remove the nitride layer, and then grew a 200 nm oxide layer over the whole device in an oxygen environment at 1100°C for 2 hours. The dimensions of the device were then confirmed using confocal and scanning electron microscopy. The images in Fig. 1 are all after the oxide layer has been added. A scanning electron microscope image of the final slit-well geometry is shown in Fig. 1B and a cross-section of the device is shown in Fig. 1C. After characterization, we anodically bonded (Karl Suss SB6) the oxidized silicon device to a 500 μm thick borofloat glass wafer and cut the device out of the wafer using a wafer saw (Disco DAD 2H/6T).
For the electrophoresis experiments, we filled the device with 5× TBE buffer (Sigma) at pH 8.1, supplemented with 0.07% (w/v) ascorbic acid, 0.07% (w/v) 40 kDa polyvinyl pyrrolidine, and 3% (v/v) β-mercaptoethanol (all from Sigma). Platinum electrodes attached to a high voltage power supply (LabSmith HVS-1500) fixed the electric potential at each fluid reservoir. We calculated the electric field in the nanofilter using Kirchoff’s laws based on the fixed electric potential in each of the reservoirs, assuming the resistance of a given part of the device of length L is R = σL/A, where A is the cross-sectional area available for ionic conduction and the resistivity σ is independent of position. For the slit-well portion of the device, we computed the resistance of this arm as resistors in series.
The device was mounted on a programmable stage and intensity data were collected from a photomultiplier tube (Hamamatsu H7422-04) mounted on an inverted microscope (Leica DMI-4000). During the experiments, the 40× microscope objective scanned the 5 mm nanofilter region of the device at a speed of 2.5 mm/s every 20 seconds and the data were collected at 1 kHz, resulting in a measure of intensity versus the position in the nanofilter.
The experimental data presented here used PCR marker double stranded DNA (New England Biolabs) with 5 fragments at 50, 150, 300, 500, and 766 bp with approximate weight percentages of 30%, 20%, 16%, 13%, and 21% respectively, dyed with YOYO-1 (Molecular Probes) at a dye ratio of 1 dye molecule per 5 base pairs of DNA. PCR marker at 250 μg/mL was loaded into one of the side reservoirs while buffer was loaded to the other three reservoirs. DNA was loaded and injected into the nanofilter geometry using a standard shifted-T protocol16.
Results and Discussion
To calibrate the ratchet, we first measured the electrophoretic mobilities in one of our devices under the constant electric fields E1 = 20 V/cm and E2 = 37 V/cm, as reported in Table 1. The elution order was confirmed by integrating deconvolved Gaussian fits to the electropherogram for baseline resolved data and comparing the relative areas under each peak to the concentrations of the mixture provided by New England Biolabs. Note that the ratchet can operate at many different electric field combinations, which we will explore shortly. Overall, we found that this particular device led to separations as a function of molecular weight for constant electric fields of around 15 V/cm to 40 V/cm. We then needed to select ratchet times t1 and t2 that lead to the desired cut-off molecular weight N* from Eq. (1). The values of t1 and t2 must be large enough that the DNA molecules are able to travel across several slit-well periods during each cycle of the ratchet. This is not a very difficult criterion to satisfy, making the pulse times very useful degrees of freedom in the ratchet design. For these first experiments, we arbitrarily chose t1 = 30 s and calculated νnet as a function of t2 for each DNA size according to Eq. (1), using the measured νi(N, Ei) values in Table 1. For t2 = 7 s, the predictions in Table 1 suggest that 150 bp < N* < 300 bp, whereupon the two smaller DNA peaks should move towards the exit and the three larger DNA peaks should move back towards the entrance.
Table 1.
Calibration data and net velocities for the ratchet experiments in Figs. 2 and 3. The predicted values are computed from Eq. (1) and the experimental values are computed from the electropherograms from the experiment. The calibration data were acquired on the same day as the separation. For the ratchet, the times are t1 = 30 s and t2 = 7 s.
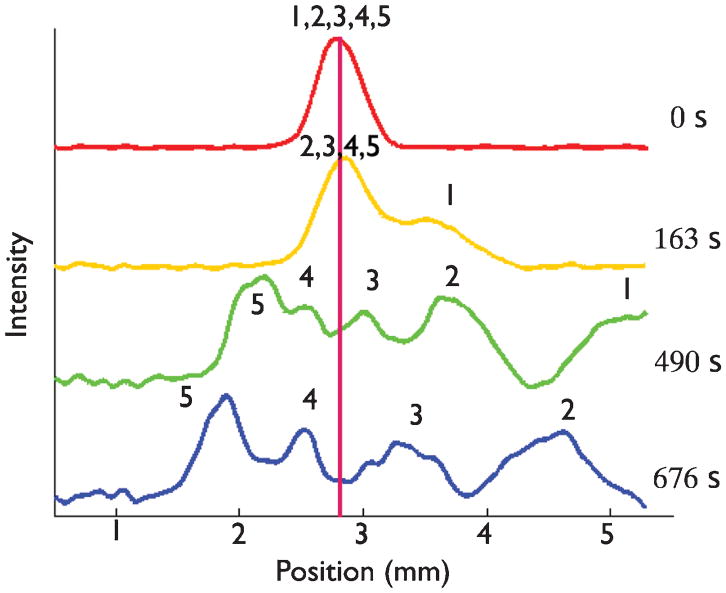
Immediately after calibration, we ran the device in ratchet mode using the parameters in Table 1. The initial injection was performed under a strong electric field of 80 V/cm, which leads to no separation and allows us to place the DNA mixture in the center of the device. We denote the time t = 0 as the end of the injection and the start of the ratcheting procedure. The result is seen in Fig. 2, the application of the temporal asymmetry ratchet lead to bidirectional motion of the DNA thus creating a non-clogging filter. As seen in Table 1 the resulting velocities are reasonably close to the predictions as well.
Fig. 2.
Ratchet nanofiltration using the calibration data in Table 1. The DNA were injected at 80 V/cm. The forward field E1 = 20 V/cm was applied for t1 = 30 s and the reverse field E2 = 37 V/cm was applied for t2 = 7 s. The numbers above the peaks represent the different sized DNA in the mixture to identify peaks; 1, 2, 3, 4, and 5 represent the 50, 150, 300, 500, and 766 bp fragments respectively.
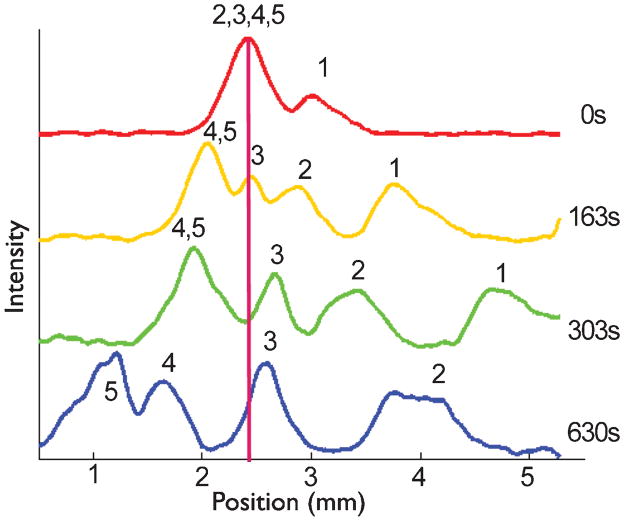
Using the same ratcheting parameters as in Fig. 2, we demonstrated filtration from a partially separated mixture, as seen in Fig. 3. In these experiments, we injected the plug at a lower electric field, 37 V/cm, so that by the time the DNA mixture reached the center of the array the 50 bp fragment had already separated from the rest of the mixture. As seen in Table 1, the experimental velocities are still in relatively good agreement with the predictions. This second experiment with the same ratcheting protocol shows that sharp injections are not necessary for ratchet nanofiltration. This attractive feature contrasts with the stringent requirements for conventional analytical separations in the nanofilter geometry1, where the injection plug width can be a substantial source of band broadening.
Fig. 3.
Using the ratchet to filter a partially separated plug. The DNA were injected at 37 V/cm, which led to some separation before the plug reached the center of the array. After time t =0, the forward field E1 = 20 V/cm was applied for t1 = 30 s and the reverse field E2 = 37 V/cm was applied for t2 = 7 s. The numbers above the peaks represent the different sized DNA in the mixture to identify peaks; 1, 2, 3, 4, and 5 represent the 50, 150, 300, 500, and 766 bp fragments respectively.
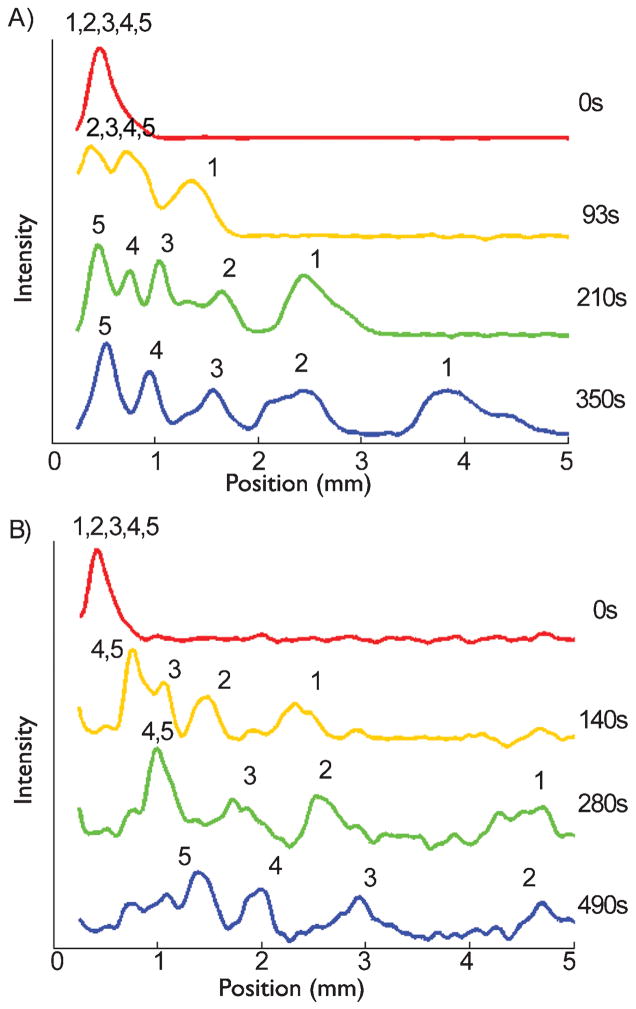
In addition to filtration, we were also able to show that a reverse pulse actually enhances the separation when compared to a constant forward electric field. For these experiments, we used a ratchet with E1 = 20 V/cm and E2 = 37 V/cm and times t1 = 60 s and t2 = 5 s. In this case, using the calibration data in Table 1, Eq. (1) predicts that all the DNA fragments have positive net velocities. Figure 4 compares the electropherograms obtained from the ratchet separation (A) to a separation obtained under a constant dc field of 20 V/cm (B). In both cases, the peaks are resolved but the ratchet protocol, which includes the reverse pulses at a strong field, resolved all five species more quickly and used less of the array. As seen in Fig. 4, the ratchet achieved easily resolved peaks for all five species after about 200 s using only 3 mm of the 5 mm array. In contrast, the constant field separation required well over 400 s to visibly resolve all five species. This would allow the pulsed field separation to occur in smaller devices, while keeping a similar separation time. Moreover, by the time the 4th and 5th peaks were resolved in the constant field separation, the 1st peak had already left the device and we were not able to see all five peaks within the device.
Fig. 4.
Comparison between (A) the ratchet protocol with all species moving forward and (B) a constant field separation with E = 20 V/cm. For the ratchet separation, the forward field E1 = 20 V/cm was applied for t1 = 60 s and the reverse field E2 = 37 V/cm was applied for t2 = 5 s. The numbers above the peaks represent the different sized DNA in the mixture to identify peaks; 1, 2, 3, 4, and 5 represent the 50, 150, 300, 500, and 766 bp fragments respectively.
Note that the enhanced separation time seen in Fig. 4A is only visible for the scanning detection mode, where we obtain the fluorescence intensity as a function of position in the device at fixed times. While the ratchet results in faster separations, it takes longer for the all the fragments to reach the end of the device due to the ratcheting mechanism. Using finish line detection scheme with a fixed detection window, the ratchet could be used in a shorter separation array than a DC field separation.
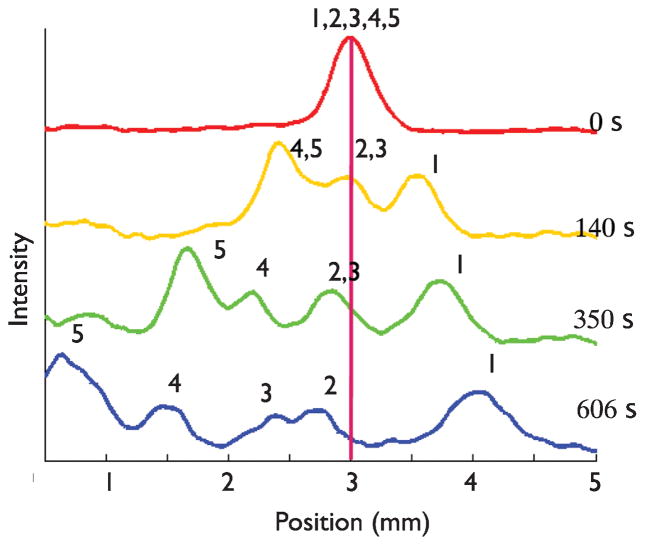
Ideally, we would like to calibrate a given nanofilter device and then use this device for numerous ratchet nanofiltration experiments over several days or even weeks. To test out this desirable approach, we made a new chip and calibrated the velocities in this second nanofilter array. For this chip we found that the optimum electric fields were E1 = 12 V/cm and E2 = 25 V/cm with the times of t1 = 17s and t2 = 6s. As seen in Table 2, this lead to the prediction that 300 bp < N* < 500 bp, whereupon the three smaller DNA peaks should move towards the exit and the two larger DNA peaks should move back towards the entrance.
Table 2.
Calibration data and net velocities for the ratchet experiments in Fig. 5. The predicted values are computed from Eq. (1) and the experimental values are computed from the electropherograms from the experiment. The calibration data were acquired on a different day than the separation.
To test the longevity of the calibration we operated the nanofilter using this ratchet protocol and chip on a subsequent day. It is clear from Fig. 5 that the repetitive application of the temporal asymmetry ratchet indeed leads to filtration, with the 50 bp fragment moving towards the exit of the device and the remaining species being rejected from the nanofilter. The scan after 606 s of the ratchet in Fig. 5 shows the 50 bp DNA about to enter the waste reservoir. Since the other four fragments were mobile, the ratchet protocol leads to a non-clogging filter where only the 50 bp fragments are eluted. Unfortunately, as we see in Table 2, Eq. (1) predicts that the 150 bp and 300 bp fragment should also move towards the exit of the device, albeit at a relatively slow speed.
Fig. 5.
Ratchet nanofiltration using the calibration data in Table 2. The DNA were injected at 80 V/cm. The forward field E1 = 12 V/cm was applied for t1 = 17 s and the reverse field E2 = 25 V/cm was applied for t2 = 6 s. The numbers above the peaks represent the different sized DNA in the mixture to identify peaks; 1, 2, 3, 4, and 5 represent the 50, 150, 300, 500, and 766 bp fragments respectively.
In principle, the calibration data in Table 2 should be sufficient to design a temporal asymmetry ratchet with a desired cut-off molecular weight N*. In practice, although the relative mobilities are reproducible, the absolute mobilities fluctuate from day-to-day due to variations in the surface coating, buffer pH, reservoir pressures, and other uncontrollable experimental parameters17. For a ratchet nanofilter, shifts in the absolute mobility can lead to changes in the direction of the net velocity for a given DNA molecule, which then leads to an undesirable shift in the cut-off molecular weight N*.
To circumvent these problems with the absolute mobility fluctuations between experiments, one can calibrate the device immediately before running the ratchet. In this approach, one first quickly obtains the electrophoretic mobilities at E1 and E2 from two separation experiments, flushes the test DNA to the outlet, and. then immediately initiates the ratchet nanofiltration with a fresh injection. In practice, the calibration procedure can be decoupled from the ratchet nanofiltration by employing two exit reservoirs; the analytes from the calibration step would be eluted to the first exit and the filtered analytes would be eluted to the second exit.
Conclusions
In the current contribution, we have shown how the slit-well motif can be combined with a temporal asymmetry ratchet to achieve filtration of DNA. The key to the operation of the device12,13 is that under a constant, unidirectional electric field, rod-like DNA exhibit a size dependent electrophoretic mobility that is non-linear with respect to the applied electric field4. By switching the duration, direction, and magnitude of the applied electric field, we are able to tune the direction of the DNA motion based on the size of the DNA molecule. The asymmetry in the applied electric fields allows operation of the device as a clog-free, tuneable filter where only DNA smaller than N* are eluted. We also showed that a brief backward pulse can enhance conventional analytical separations as a function of molecular weight.
The ratchet experiment described here required the injection of a group of DNA into the nanofilter geometry before applying the temporal asymmetry ratchet. True filter operation could be accomplished by applying the ratchet to the entirety of the loaded DNA sample using a two-reservoir design. In the portion of the microfluidic channel devoid of the slit-well geometry, all DNA sizes move away from the loading reservoir and toward the nanofilter during application of the ratchet. In the slit-well geometry, DNA with size greater than N* are rejected from the nanofilter while DNA smaller than N* pass through the nanofilter. The data presented here shows that the direction of transport in the nanofilter depends on DNA size, and thus the nanofilter geometry can be operated as a true filter.
As a microfluidic device, the throughput of the nanofilter is naturally limited by the small volume of fluid it handles. While the width of the slits is limited by the stability of the material,18 the process is trivial to parallelize by creating multiple channels separated by thin walls. However, it is unlikely that a ratchet nanofilter will replace gel electrophoresis for purifying larger quantities of DNA. Rather, we envision that this nanofilter geometry can be used as an in-line filtration step in integrated lab-on-a-chip type devices designed to perform multiple manipulation steps on a small (and often precious) sample. It could purify DNA following PCR of a cell lysate, or only allow desired DNA molecular weights through to the rest of the device for further processing19. Subsqeuent on-chip processing would likely not need large amounts of analyte so the lower throughput of this device would not be an issue.
Acknowledgments
We thank K. Andre Mkhoyan for advice on the cross-sectional SEM. This work was supported by NIH grant R01-HG005216. Parts of this work were carried out in the Characterization Facility, University of Minnesota, which receives partial support from NSF through the MRSEC program.
Notes and references
- 1.Fu J, Mao P, Han J. Appl Phys Lett. 2005;87:263902. doi: 10.1063/1.2149979. [DOI] [PMC free article] [PubMed] [Google Scholar]
- 2.Dorfman KD. Rev Mod Phys. 2010;82:2903. [Google Scholar]
- 3.Dorfman KD, King SB, Olson DW, Thomas JDP, Tree DR. Chem Rev. 2013;113:2584. doi: 10.1021/cr3002142. [DOI] [PMC free article] [PubMed] [Google Scholar]
- 4.Fu J, Yoo J, Han J. Phys Rev Lett. 2006;97:018103. doi: 10.1103/PhysRevLett.97.018103. [DOI] [PMC free article] [PubMed] [Google Scholar]
- 5.Giddings JC, Kucera E, Russell CP, Myers MN. J Phys Chem. 1968;72:4937. [Google Scholar]
- 6.Fu J, Schoch RB, Stevens AL, Tannenbaum SR, Han J. Nature Nanotechnol. 2007;2:121. doi: 10.1038/nnano.2006.206. [DOI] [PMC free article] [PubMed] [Google Scholar]
- 7.Bow H, Fu J, Han J. Electrophoresis. 2008;29:4646. doi: 10.1002/elps.200800256. [DOI] [PubMed] [Google Scholar]
- 8.Li ZR, Liu GR, Chen YZ, Wang JS, Bow H, Cheng Y, Han J. Electrophoresis. 2008;29:329. doi: 10.1002/elps.200700679. [DOI] [PubMed] [Google Scholar]
- 9.Li ZR, Liu GR, Han J, Cheng Y, Chen YZ, Wang JS, Hadjiconstantinou NG. Phys Rev E: Stat, Nonlinear, Soft Matter Phys. 2009;80:041911. doi: 10.1103/PhysRevE.80.041911. [DOI] [PubMed] [Google Scholar]
- 10.Strychalski EA, Lau HW, Archer LA. J Appl Phys. 2009;106:024915. doi: 10.1063/1.3183953. [DOI] [PMC free article] [PubMed] [Google Scholar]
- 11.Laachi N, Declet C, Matson C, Dorfman KD. Phys Rev Lett. 2007;98:098106. doi: 10.1103/PhysRevLett.98.098106. [DOI] [PubMed] [Google Scholar]
- 12.Slater GW, Guo HL, Nixon GI. Phys Rev Lett. 1996;78:1170. [Google Scholar]
- 13.Tessier F, Slater GW. Appl Phys A: Mater Sci Process. 2002;75:285. [Google Scholar]
- 14.Viovy JL. Rev Mod Phys. 2000;72:813. [Google Scholar]
- 15.Han J, Craighead HC. Science. 2000;288:1026. doi: 10.1126/science.288.5468.1026. [DOI] [PubMed] [Google Scholar]
- 16.Jacobson SC, Hergenroder R, Koutny LB, Warmack RJ, Ramsey JM. Anal Chem. 1994;66:1107. [Google Scholar]
- 17.Ou J, Carpenter SJ, Dorfman KD. Biomicrofluidics. 2010;4:013203. doi: 10.1063/1.3283903. [DOI] [PMC free article] [PubMed] [Google Scholar]
- 18.Mao P, Han J. Lab Chip. 2005;5:837. doi: 10.1039/b502809d. [DOI] [PubMed] [Google Scholar]
- 19.Meltzer RH, Krogmeier JR, Kwok LW, Allen R, Crane B, Griffis JW, Knaian L, Kojanian N, Malkin G, Nahas MK, Papkov V, Shaikh S, Vyavahare K, Zhong Q, Zhou Y, Larson JW, Gilmanshin R. Lab Chip. 2011;11:863. doi: 10.1039/c0lc00477d. [DOI] [PubMed] [Google Scholar]


