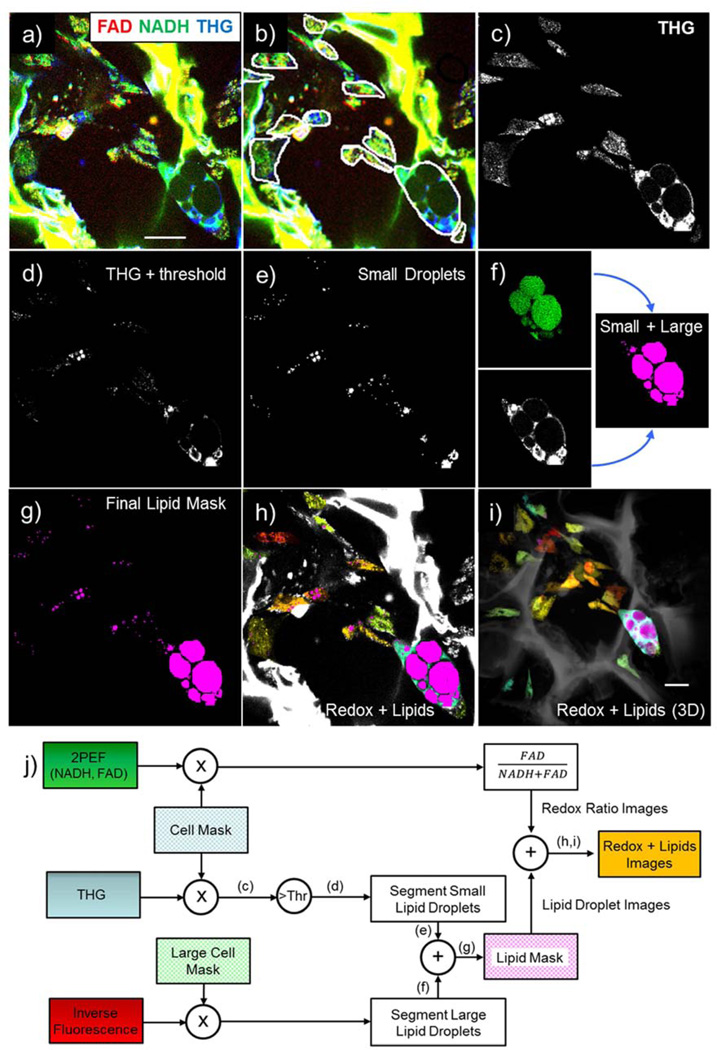
Figure 2.
Image Processing Workflow. a) Unprocessed images (red= FAD, green= NADH, blue= THG). b) Manually identified cells. c) Intracellular THG signal used for lipid segmentation. d) THG image after intensity thresholding. e) Small droplet segmentation. f) 2-step large droplet segmentation- inverse fluorescence auto-segmentation with manual adjustment aided by THG, g) Merged (i.e. small and large) lipid mask. h) Redox color-coded image superimposed on THG-based lipid image. i) Redox color-coded and THG-based lipid 3D projection. j) Schematic representation of image processing workflow

