

Abstract
Experimental evidence suggests that the cell membrane is a highly organized structure that is compartmentalized by the underlying membrane cytoskeleton (MSK). The interaction between the cell membrane and the cytoskeleton led to the “picket-fence” model, which was proposed to explain certain aspects of membrane compartmentalization. This model assumes that the MSK hinders and confines the motion of receptors and lipids to compartments in the membrane. However, the impact of the MSK on receptor clustering, aggregation, and downstream signaling remains unclear. For example, some evidence suggests that the MSK enhances dimerization, while other evidence suggests decreased dimerization and signaling. Herein, we use computational Monte Carlo simulations to examine the effects of MSK density and receptor concentration on receptor dimerization and clustering. Preliminary results suggest that the MSK may have the potential to induce receptor clustering, which is a function of both picket-fence density and receptor concentration.
Keywords: Plasma membrane, Membrane cytoskeleton, Picket fence, Clustering, Spatial modeling, EGFR
1 Introduction
Since the fluid mosaic model was proposed by Singer and Nicholson (1) almost 40 years ago our understanding of membrane biology has changed considerably (2-4), primarily due to advances in imaging technologies. For example, high resolution microscopy captures structures at the nanometer scale (5-7), while protein-tracking experiments have revealed spatiotemporal dynamics of membrane-bound receptors (8-12). These techniques are providing new insight and suggesting modifications to the fluid mosaic model.
There are two distinct differences between experimental data and the fluid mosaic model that have prompted renewed investigation of the plasma membrane (2). First, the diffusion of both proteins and lipids was found to be slower in the plasma membrane than in artificial membranes (13-15). Second, a dramatic decrease in diffusion rates was observed for protein oligomers or molecular complexes in the membrane, compared to the monomer (16-18). These differences have stimulated many experimental studies, in order to obtain improved understanding of the plasma membrane and its interaction with the underlying membrane cytoskeleton (MSK) (6, 19-21).
It has been hypothesized that the cell membrane is compartmentalized into microdomains, such as protein islands (20) and lipid rafts (22). In addition, the “picket-fence” model, which is not mutually exclusive of protein islands or lipid rafts, has been proposed as a potential mechanism for formation of microdomains (10, 11). In the picket-fence model the MSK acts as the fence by corralling transmembrane proteins, while integral proteins serve as the “pickets” hindering receptor, as well as, lipid mobility (10, 23). This model accurately explains changes in diffusion rates, with lipids and proteins undergoing short-term confined diffusion (with diffusion rates consistent with data on artificial membranes) within a compartment (or corral), followed by hop diffusion between adjacent confinement zones (12, 24). The restricted motion by the picket fence also potentially explains the differences in receptor diffusion in artificial and plasma membranes (18, 25, 26).
The role of membrane microdomains and picket fences in receptor clustering, aggregation, and downstream signaling is controversial. For example, lipid rafts have been hypothesized to both promote and prevent signaling (27-29). Some evidence indicates that picket fences may have an inhibitory role on cell signaling (30-32), while other evidence points to an increase in receptor clustering, with enhanced downstream signaling (33-35). Mathematical modeling studies may help improve understanding of these conflicting data. Several different theoretical approaches, ranging from thermodynamic and statistical mechanical models to stochastic Monte Carlo simulations, have been used to examine the effects of clustering on signaling (36-42). These studies did not, however, investigate the effects of the picket fence on receptor clustering, although corral effects on membrane molecule diffusion and cluster lifetime were examined (40, 42). In this study, we explore use of spatial stochastic simulations to test how the MSK (i.e., picket-fence density) influences receptor clustering. While many in silico methods have been developed to study cellular signaling, including receptor interactions (e.g., dimerization), receptors are often assumed to be well-mixed and spatial information is neglected (e.g., 43, 44). Here we utilize the spatial kinetic Monte Carlo (SKMC) method (45, 46) to investigate the effects of the MSK on receptor clustering.
2 Materials and Methods
Spatial Kinetic Monte Carlo (SKMC)Method
Simulations were performed using the SKMC algorithm, which is a modified null-event, lattice-based MC algorithm (45, 46). The algorithm, which is essentially the same as that described by Mayawala et al (45), is briefly summarized below. The spatial domain, representative of a small region of the plasma membrane, was a two-dimensional square lattice of side 1μm, divided into 100 × 100 bins, each of dimension a = 10 nm. Thus the total surface area of the lattice was 1 μm2. The initial conditions were established by randomly populating lattice sites with receptors. Also, periodic boundary conditions were imposed; that is, if a particle were to pass through one edge of the lattice it reappears at the opposite edge. Each simulation was performed ten times, and the results averaged, in order to enable statistically significant interpretation of effects of parameter variation on clustering.
The SKMC algorithm consists of first randomly selecting an occupied lattice site, and then choosing either a successful (reaction or diffusion) or unsuccessful (null) event, based on calculated probabilities. If a successful event is chosen, it is executed.
The transition rate, , for diffusion of species from any site i (i.e., lattice point i) to a nearest-neighboring site j is defined as
| 1 |
where and Γd = 4D/a2 and D is the diffusion coefficient of the species located at site i. The term Bi denotes the set of four possible nearest-neighboring sites to which diffusion can occur in two dimensions from site i. Because species are allowed to diffuse only to an unoccupied site, we define an occupancy function σj for each of the four nearest-neighboring sites, in order to simplify the procedure for computing the transition rate for diffusion. For any site k (= i or j), σk is set equal to 1 if the site is occupied, or to 0 if the site is unoccupied.
The transition rate for a chemical reaction at site i, , depends on the reaction type, and is given in Table I for each of the different reaction types considered in the present work. This table also summarizes the transition rate for diffusion events. To focus our study on the effects of the MSK on clustering, we used a simplified model of the epidermal growth factor receptor (EGFR) signaling pathway, which we adapted from Kholodenko et al (43). The reaction mechanism and rate coefficient parameters are given in Table II. In this table, kj and k−j are the forward and reverse rate constants for reaction j, and Vmax and Km are Michaelis-Menten constants.
Table I. SKMC Transition Rates.
The diffusion (ΓD) and reaction (ΓR) transition rates are defined at discrete points on a square lattice. The lattice species are M (monomer), D (dimer) and pD (phosphorylated dimer). L is the extracellular ligand (EGF, see Table II) that binds the receptor (EGFR)
| Microscopic Event | Transition Rate |
|---|---|
| Diffusion |
, where σi is the occupancy function = 1 if site i is filled and Γd = D/a2, where D is the diffusivity of the receptor and a the microscopic lattice pixel dimension, taken equal to the encounter radius. Bi denotes the set of 4 possible nearest- neighboring sites to which diffusion from site i can occur |
|
| |
| Reactions | |
| Ligand-Association Reaction L + M → M* |
, where k is the macroscopic reaction rate constant with units of s−1, the arrow “→” denotes an irreversible reaction and [L] is the ligand concentration |
| Ligand-Dissociation Reaction M* → L + M |
, where k is the macroscopic reaction rate constant with units of s−1 |
| Dimerization Reaction M* + M* → D |
, where k is the macroscopic reaction rate constant with units of (receptors/site)−1 s−1 |
| Dimer Dissociation Reaction D → M* + M* |
, where k is the macroscopic reaction rate constant with units of s−1 |
| Phosphorylation and Dephosphorylation Reactions D → pD pD → D |
, where k is the macroscopic reaction rate constant with units of s−1 |
Table II. Simplified EGFR Reaction Model.
The symbol “R” represents the receptor and the suffixes “u” and “b” denote unbound and ligand-bound states. The phoshphorylated receptor is denoted by “pR.” Reaction #5 was included in the predimerization (that is, dimerization without binding ligand) simulations. The units are nM and s
| No. | Reaction | Rate constant parameters | |
|---|---|---|---|
| 1 | EGF + Ru <=> Rb | k1 = 0.003 | k−1 = 0.06 |
| 2 | Rb + Rb <=> Rb-Rb | k2 = 0.01 | k−2 = 0.1 |
| 3 | Rb-Rb <=> pR | k3 = 1 | k−3 = 0.01 |
| 4 | pR → Rb-Rb | Vmax = 268 | Km = 56.2 |
| 5* | Ru + Ru <=> Ru-Ru | k5 = 0.01 | k−5 = 0.4 |
Predimerization reaction
The probability of an event x (= reaction “r” or diffusion “d”) at site i is computed by using the relation
| 2 |
where Γmax is a normalization constant, defined as
| 3 |
where the multiplicative factor of 4 accounts for events occurring in the four directions of the two-dimensional square lattice. Finally, the time step Δt used to advance the simulation time was computed by using
| 4 |
Picket-Fence Model
In order to model cytoskeletal effects on receptor clustering in the cell membrane, “picket fences” were placed on the lattice; previous work has investigated the appropriateness of the lattice model to simulate the effect of corrals on diffusion of molecules in the cell membrane (40). For this preliminary study, we varied both the picket-fence density (i.e., number of corrals per unit surface area) and the receptor concentration (i.e., number of receptors per unit surface area). We based our picket densities on the experimental data of Kusumi et al (2, 24, 47), who have observed that the corrals range in size from 30 to 230 nm. We selected densities of 400, 100, and 25 corrals/μm2, which correspond to corral (or compartment) sizes of 50, 100, and 200 nm, respectively. These confinement sizes are consistent with the above experimental observations, and cover a similar size range. The EGFR concentrations were selected to be consistent with the values reported by Kholodenko et al (43), because we adapted their reaction mechanism, as discussed above. According to Kholodenko et al, out of a total of 1–3×10⁵ receptors/cell 60-80% are displayed on the cell membrane. The cell diameter was 20 μm, and therefore the corresponding plasma membrane receptor concentration ranges from 48–191 receptors/μm2. In order to encompass this concentration range, we varied the EGFR concentration from 30–300 receptors/μm2.
The picket fences occupy lattice sites and therefore prevent reaction and diffusion events in the direction of the boundary. For example, if a receptor is adjacent to a picket fence on the jth lattice site, the latter is assigned an occupancy function (σj) of 1, thereby yielding a zero transition rate of diffusion for the receptor to that site (Eq. 1). Similarly, a receptor separated from another by a picket fence cannot dimerize.
Single-particle tracking reveals short-term receptor confinement within a compartment, followed by long-term “hop” diffusion to an adjacent corral. Cytoskeletal rearrangements and actin dissociation are believed to be responsible for this hop diffusion (2, 10). In order to simulate hop diffusion, breaks or openings were inserted in the fences, periodically in time and randomly in space. The rate at which openings were inserted in the fences was determined empirically, by a fit to experimental measurements (19). One opening per 0.04 μm2 area of picket fence was introduced at every 10 ms. Placing these breaks enables receptors to diffuse out of their confinement zones. After one iteration of the SKMC with the picket fence “gates” open, they are closed. These rates of opening and closing the gates are consistent with the kinetics of actin polymerization/depolymerization (8, 48-51), which is on the order of the algorithm’s time step (Δt, Eq. 4). We confirmed that the probability of receptor escape from a corral was independent of picket-fence density by computing the ratio of number of escapes to number of receptor collisions with the corral.
Quantification of clusters
In order to compute the total number of clusters in the computational domain and the size of each cluster, we used the Fuzzy c-means (FCM) clustering technique (52). The FCM is a data-clustering technique in which the data are divided into clusters, with each data point belonging to a cluster to some degree, which is specified by its membership grade. Thus elements in the same class are similar to one another, whereas those in different classes are not. To start the calculation procedure to determine aggregation within each corral, an initial cluster number was specified, which was then refined using the FCM. If the number of corrals was greater than the total number of monomers, the initial guess for cluster number was set equal to the number of monomers divided by two, signifying that two or more receptors define a cluster. However, if the number of corrals was less than the total number of receptor molecules, the initial cluster number was set equal to the number of corrals, thus specifying clustering within each corral.
The FCM algorithm performs the analysis unaware of the picket fences, and so different clusters can occupy the same corral or a single cluster can span multiple corrals. Assuming that the mechanism of clustering is the picket fence, we combined or separated clusters, depending on which corral they occupied. For example, clusters occupying the same corral were combined, and clusters with receptor members occupying more than one corral were separated or eliminated. Clusters were also rejected if they contained fewer than two receptors.
3 Results
Picket-Fence Density and Clustering
We first addressed whether picket-fence density affects receptor clustering, by varying it from a low value of 25 corrals/μm2, to an intermediate value of 100 corrals/μm2, and then to a high value of 400 corrals/μm2. For this study, we used a receptor concentration of 200 EGFR/μm2, after Kholodenko et al (43). Also after Kholodenko et al (43) all results presented in this work were generated with an EGF concentration of 20 nM in the incubation medium. This concentration was rescaled by the cytoplasmic volume, as described in (43).
The receptors were randomly placed on the lattice, as shown in Figure 1, row 1. The randomness of receptor distribution was confirmed by using the Hopkins test (53, 54), which showed that all data followed Gaussian distributions. In addition, we applied the Chi-squared Goodness-of-fit test (55), which validated the null hypothesis, confirming a state of randomness (Fig. 1). The Hopkins statistic (H) is expected to be ½ for randomly distributed points and closer to unity for clustered points (54).
Figure 1. Receptor Clustering versus Picket-Fence Density.

Schematic illustration of the lattices and Hopkins test with the chi-square parameters for each lattice. Three different picket-fence densities of 25 (first two columns), 100 (middle two columns), and 400 corrals/μm2 (last two columns) were examined. Results are shown at three different time points of 0 (first row), 1 (second row) and 2 s (third row). For all cases the receptor concentration was 200 receptors/μm2 and stimulus with 20nM of ligand (EGF) in the incubation medium (see text) was applied at time t = 0 s.. The randomness of receptor distribution at t = 0 s was tested by using the Hopkins test and confirmed with the Chi-square test. Here H is the Hopkins statistic and pdf the probability density function. With increasing time the tests showed increased clustering for all three picket-fence densities, with the greatest amount of clustering displayed by the intermediate picket-fence density.
Receptors were allowed to diffuse, and at 1 s (Fig. 1, row 2) there was a small right-shift of the data in the Hopkins test, indicating some clustering. At 2 s (Fig. 1, row 3) the receptors were further clustered, indicated by the significant right-shift of the data in the Hopkins test. The Chi-squared values also indicated a nonrandom, that is, clustered, state. Comparing the results for the three picket-fence densities at 2 s showed that by both the Hopkins and the Goodness-of-fit tests the greatest amount of clustering occurred for the 100 corrals/μm2 density. The largest picket-fence density used here (400 corrals/μm2) produced the least amount of clustering, as indicated by both tests. The clustering is intermediate for the smallest corral density tested (25 corrals/μm2).
We explored further the effects of picket-fence density by applying the fuzzy c-means (FCM) clustering algorithm (52) to the simulation results. Representative computed distributions of clusters and cluster sizes are shown in Figure 2. We used 200 receptors/μm2 for these simulations, which were performed 10 times, and average results are reported with 95% confidence interval (Figure 3). For 25 corrals/μm2 the average total number of clusters in the lattice (= cluster density per μm2 of plasma membrane) was 19 (Figure 3), with an average cluster size of 5 receptors. When the corral density was increased to 100 /μm2, the average cluster size decreased to 3 receptors, but the cluster density increased to 28 (Figure 3). Finally, the largest corral density tested (400 /μm2) produced the smallest average cluster density and size: 17 (Figure 3) and 2, respectively.
Figure 2. The FCM Technique.
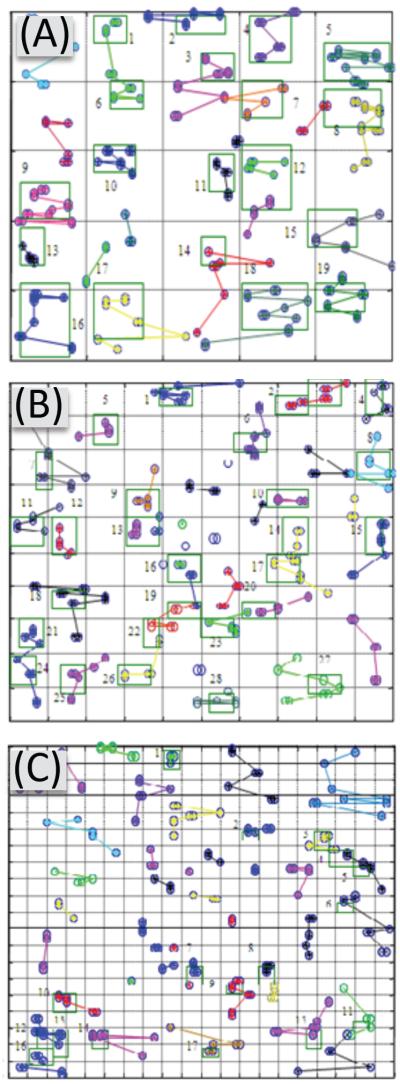
The FCM technique determines the membership status of receptors to a given cluster. The FCM results were analyzed and clusters rejected if they bordered corrals or contained fewer than two receptors in a corral. The colors represent cluster membership and the lines represent the Euclidian distance from the receptor location at the current time to its location at the previous time step within the cluster. The FCM technique was applied to the data in Figure 1. The receptor and ligand concentrations, 200 receptors/μm2 and 20 nM EGF in the incubation medium, were the same for all the three three-picket fence densities studied: (A) 25 corrals/μm2, (B) 100 corrals/μm2, and (C) 400 corrals/μm2. Shown here, to illustrate the FCM technique, are the raw results produced by it, before post processing. The average number of clusters per lattice and average number of receptors per cluster both varied with picket-fence density: 19 and 5 for 25 corrals/μm2 (A), 28 and 3 for 100 corrals/μm2 (B), and 17 and 2 for 400 corrals/μm2(C).
Figure 3. Number of Clusters and Cluster Size versus Picket Fence Density.

Variation of cluster number with picket-fence density and receptor concentration. For the smallest receptor concentration examined, clustering decreases with increasing picket-fence density, whereas for the larger concentrations the cluster number peaks at the intermediate picket-fence density. The receptor number did not appear to exhibit much variation, as indicated by the small 95% confidence interval
Receptor Concentration and Clustering
We then examined whether receptor concentration affected clustering, by performing simulations with 30, 50, 100, 200, and 300 receptors/μm2. The results showed that for low receptor concentrations (30 and 50 EGFR/μm2) the greatest amount of clustering occurred at the smallest picket-fence density, 25 corrals/μm2, with 8-13 clusters/μm2 (Figure 3). At concentrations of 50 and 100 receptors/μm2 we observed a switch in where the maximal clustering occured, to the intermediate picket-fence density of 100 corrals/μm2. With further increases in receptor concentration to the largest values tested, 200 and 300 EGFR/μm2, the greatest amount of clustering continued to occur at 100 corrals/μm2. In addition, the increase in cluster number with increases in picket-fence density from 25 to 100 corrals/μm2 was much steeper than for the smaller receptor concentrations (Fig. 3).
Oligomerization-Induced Trapping
In order to test a possible mechanism for clustering, we investigated how dimerization may lead to clustering by oligomerization-induced trapping (2, 11, 12). We examined the temporal behavior of the mean square displacement (MSD) of both monomers and dimers, for the highest and lowest picket-fence densities studied. Shown in Figure 4 (left column) are representative MSD plots for a single monomer and a single dimer that were followed in time. We observed hindered diffusion for both picket-fence densities. For example, for the 400 corrals/μm2 case the monomer trajectory indicated an escape at approximately 0.3 s (noted by the increase in MSD) and then confined motion until approximately 1.25 s. On the other hand, the dimer trajectory indicated confinement within the corral of area 0.0025 μm2 for the entire 2 s simulation. The single-particle trajectories (Figure 4, right column) obtained from the simulation showed that the monomer traveled across a much larger area than did the dimer.
Figure 4. Mean Squared Displacement as a Function of Time for Monomers and Dimers.

The computed mean squared displacements (MS, left images) and single-particle tracking results (SPT, right images) are plotted as a function of time for both monomers and dimmers. Results are presented for the highest (400 corrals/μm2, top row) and lowest (25 corrals/μm2, bottom row) picket-fence densities tested. For both cases the receptor and ligand concentrations were 200 receptors/μm2 and 20nM, respectively. For the time period given here there were dimer escapes only for the 25 corrals/μm2 condition. But in both cases the monomer displayed more escapes and covered a larger area than did the dimer.
The MSD plots for the 25 corrals/μm2 showed escapes for both monomer and dimer at approximately 0.5 s. The dimer escaped, but was then confined from 1.1 s until 1.6 s, when it escaped again, while the monomer hopped to another corral at 1.1 s, where it was confined to an area of 0.04 μm2, and then escaped again at approximately 1.5 s. The single-particle trajectories showed that the monomer traversed a greater area than did the dimer, but the relative differences were smaller than for the 400 corrals/μm2 density (Fig. 4, right column). When averaged over all ten simulations, all monomers and dimers, and over the entire 2 s time period of simulation, 12 hops for monomers and 8 hops for dimers were observed for the 400 corrals/μm2 case. For 25 corrals/μm2 density the number of monomer and dimer hops were 5 and 2, respectively. For both monomers and dimers, the number of hops decreased for the larger corral size.
For the three picket-fence densities of 25, 100 and 400 corrals/μm2 the traversed areas averaged over the ten simulations were, respectively, 0.05, 0.019, and 0.0038 μm2 for dimers and 0.138, 0.041, and 0.0152 μm2 for monomers. The results indicate that dimerized receptors covered less area, which may support oligomerization-induced trapping. The difference in areas covered by monomers and dimers was most pronounced for the largest picket-fence density studied.
We next investigated the behavior of the MSD as a function of the number of collisions of the particle with the corral. We rescaled time in the MSD plots of single particles in Figure 4 to number of collisions, by using the slope of the essentially linear relationship (over a long time period) between collision number and time. The results (Figure S1) showed that dimer escapes were present only for the 25 corrals/μm2 case. For 400 corrals/μm2 the monomer escaped at approximately1.3 ×106 collisions, but the dimer remained confined (Figure S1, top row). An approximate doubling of the number of collisions examined did not reveal any dimer escape for this particle (Figure S1, top row, right panel). The relative escape rates at different picket-fence densities show how time, collisions, and escapes are being scaled. For the picket-fence density of 25 corrals/μm2 a larger area was traversed and a greater number of escapes occurred in a smaller time period (Figure S1, bottom row). These results illustrate time scaling of receptor signaling events based on the density of the membrane cytoskeleton may be important in signaling.
Finally, to further examine if clustering may be a result of oligomerization-induced trapping, we compared results generated with (Figure 5, left column) and without (Figure 5, right column) ligand. We used all three picket-fence densities, a receptor concentration of 200 /μm2, and a ligand concentration of 20 nM in the incubation medium, as discussed previously. For this study, receptors were not allowed to predimerize (i.e., reaction 5 in Table II was switched off). The Hopkins and Chi-squared tests both showed increased clustering when ligand was added, indicating that clustering may be enhanced due to dimerization.
Figure 5. Oligomerization-Induced Trapping.

Shown here are the simulation results at a time of 2 s, obtained both with (left column) and without (right column) ligand. The Hopkins and Chi-squared statistics are shown for picket-fence densities of 25 (first row), 100 (second row) and 400 (last row) corrals/μm2. Here H is the Hopkins statistic and pdf the probability density function. For all cases the receptor and ligand concentrations were 200 receptors/μm2 and 20nM, respectively. For this study, the predimerization reaction (i.e., dimerization in absence of ligand) was switched off. These results suggest that dimerization may enhance clustering.
4 Discussion
The epidermal growth factor receptor (EGFR), a member of the ErbB family of plasma membrane receptors, is expressed in a variety of cell types and tissues (56,57). These receptors are critically important in many biological processes, including embryonic development (57-59); for example, loss of EGFR results in severe embryonic or perinatal abnormalities in mice (57). This family of receptors has also been implicated in the development and metastasis of various human cancers, and is therefore the subject of intensive study and a target in drug development (56-60). However, EGFR-targeted therapy has shown only modest benefits, with tumors developing resistance to some therapies, illustrating the need for improved understanding of the signaling mechanism (56, 61-63). For example, the role of membrane microdomains and picket fences in receptor aggregation and downstream signaling remains unclear (27-29), with experimental evidence indicating that picket fences may both inhibit cell signaling (30-32) and increase receptor clustering with enhanced downstream signaling (33-35). Understanding the spatial organization of the receptor will increase understanding of EGFR activation and aid in developing new cancer therapies (63). We therefore attempted, by using mathematical modeling, to understand how receptor clustering is influenced by the membrane cytoskeleton, as the first step towards the ultimate goal of studying the effects on signaling.
The major result suggested by our Monte Carlo simulation, which represents a first attempt at quantitating receptor clustering due to microdomains and picket fences, is that clustering depends on both picket-fence density and receptor concentration (Figures 1-3). The finding that receptor clustering, and hence perhaps downstream signaling, is a function of both receptor concentration and corral density is consistent with the Monte Carlo simulation results of Collins et al (42), who concluded that both cluster size and receptor density affect cluster lifetime. Similarly, Lim and Yin (38) and Gopalakrishnan et al (39) concluded from their computer simulations that receptor density can govern binding of receptor by ligand.
Our simulations showed that for picket-fence densities ≥ 100 corrals/μm2 the cluster number density increased with increasing receptor concentration (Figure 3). At low receptor concentrations (30 and 50 receptors/μm2), increasing picket-fence density had an inhibitory effect on clustering, whereas at normal to high receptor concentrations (100–300 receptors/μm2) the greatest amount of clustering was observed at a picket-fence density of 100 corrals/μm2 (Figure 2). Thus it appears that with increasing receptor concentration the maximal clustering occurs at larger picket-fence densities. However, additional studies with greater parameter variation are needed to confirm this preliminary observation.
The cluster density and average number of receptors per cluster were also found to depend on both picket-fence density and receptor concentration (Figures 2 and 3). For a receptor concentration of 200 /μm2 the maximal cluster density (~ 28) was observed at a picket-fence density of 100 corrals/μm2, whereas the maximal average cluster size (~ 5 receptors/cluster) occurred at a picket-fence density of 25 corrals/μm2 (Figure 2). Both cluster density and cluster size decreased when the picket-fence density was increased to 400 corrals/μm2 (Figures 2 and 3). The calculated cluster density and cluster size ranged from 2 to 50 and 2 to 10, respectively.
By using image correlation microscopy Clayton et al (64) studied EGFR clustering in the plasma membrane of BaF/3 cells. They observed that in the presence of EGF the cluster density was 19 ± 4 clusters/μm2, and the average number of receptors per cluster was 3.7. Saffarian et al (65), who used fluorescence intensity distribution analysis, also observed clusters of two or more molecules in CHO cells under physiological conditions. More recently, Abulrob et al (63) examined EGFR clustering in HeLa cells, by using nearfield scanning optical microscopy. They concluded that the EGFR is organized in small clusters of average size 150 nm, and the number of receptors varied from one or two to greater than 100, but the majority (over 60 percent) of clusters in the EGF-treated cells contained fewer than 12 receptors. It is encouraging that our preliminary simulation results for cluster density and size compare favorably with these experimental measurements; however, further study is needed to better understand cluster formation.
The competition between rate of receptor dimerization, and thus increased probability of entrapment, within a corral and rate of receptor escape from the corral regulates both the cluster number and cluster size. The rate of receptor collision with the corral is expected to increase with increasing picket-fence density, because the corral size decreases. In addition, as discussed previously, the number of receptor escapes from a corral versus the number of collisions with the corral was found to be independent of corral size. Therefore the rate of receptor escape from a corral is expected to increase as the corral density increases. This hypothesis is consistent with our computed results for number of hops by monomers and dimers. For both species the average number of escapes over the 2 second simulation time period decreased with increasing corral size: from 12 and 8, respectively, for the 400 corrals/μm2 density to 5 and 2, respectively, for the 25 corrals/μm2 case. Thus the residence time of receptors within a corral is expected to increase with increasing corral size (decreasing picket-fence density), and so a dimerization event becomes more likely to occur.
Increasing receptor concentration also increases the probability of dimerization (Figure 3). In addition, for the same number of receptors in different-size corrals we expect the probability of dimerization to increase with decreased corral size, because the particles are closer together. However, with increasing picket-fence density receptors are more likely to be dispersed in different corrals, especially initially, and thus less likely to dimerize. This difference is expected to be particularly significant for low receptor concentration (i.e., low receptor number). Therefore it is clear that several different competing effects govern cluster number and cluster size.
Our computed results for cluster density and size under different conditions (Figures 2 and 3) do indeed suggest a complex interaction among the different parameters. For example, for the lowest receptor concentration (30 and 50 receptors) examined the number of clusters decreased monotonically with increasing picket-fence density (Figure 3), suggesting that sparsely distributed receptors in the smaller corrals may be inhibiting dimerization and clustering. For larger receptor concentrations the number of clusters increased when the picket-fence density was increased from 25 to 100 corrals/μm2 (Figure 3). It would appear that the receptor concentration is sufficiently large that the decreased corral size has a larger effect on clustering than the increased diffuseness of receptors with increased picket-fence density. This shift in sensitivity may also explain why the increase in cluster number became more pronounced with increasing receptor concentration. However, with a further increase in picket-fence density from 100 to 400 corrals/μm2, the cluster number decreased. In addition, the decrease in cluster number was more pronounced with increasing receptor concentration. The increased diffuseness of the receptor may be responsible for the decrease in cluster number. However, it is not clear why this rate of decrease with increasing picket-fence density is steeper for the larger receptor concentrations. Also, the average cluster size showed a monotic decrease with increasing picket-fence density, at least for the corral sizes tested (Figure 2). Whether this behavior is due to increased receptor hopping among the smaller corrals than the larger ones, the much more dispersed receptor distribution (whose effect is greater than that of the increased reaction probability of dimerization) in the smaller corrals, or both is not yet clear. Thus more work is needed to unravel the complex interactions among receptor concentration, corral density, and ligand concentration that together determine cluster size and density.
Cell signaling and the MSK have experimentally been shown to be coupled (23, 66). Coordinating microdomain densities to regulate cell signaling may be an important mechanism. Our simulation results (Figure 1) show a time delay in clustering, which may activate some signaling pathways, while suppressing others. This time delay is picket-fence density-dependent; for example, for 25 corrals/μm2 the receptors are more clustered at 1 s than for the higher densities (Figure 1, row 2). Our preliminary results appear to be in agreement with oligomerization-induced trapping as a mechanism for clustering. Both our computed mean square displacement and single-particle tracking results showed that the dimer traversed a fraction of the area covered by the monomer (Figures 4 and S1), suggesting oligomerization-induced trapping. In addition, as the picket-fence density was increased, the trapping of the dimer became more pronounced. Finally, by comparing results generated with and without ligand, we noted increased clustering in the presence of ligand, which may be a result of dimerization, which was not allowed to occur in the absence of ligand (Figure 5).
This effect of ligand is consistent with the observation by Saffarian et al (65) that addition of EGF markedly increased receptor dimer and tetramer formation, and with the experimental results of Jia et al (67), who investigated EGFR clustering with atomic force microscopy, transmission electron microscopy, and confocal laser microscopy, and concluded that it is inhibited in the absence of EGF. Similarly, a single-molecule fluorescence imaging study suggested that after treatment with EGF the activated receptors were mainly dimers (68). Clayton et al (64) report an increase in cluster size and decrease in cluster density in the presence of ligand. It has also been observed experimentally that prevention of both ligand binding and receptor phosphorylation of the intracellular domain results in decreased receptor cluster size (63,69). In the classical model of EGFR signaling it is proposed that upon binding ligand the receptor assumes an open confirmation that enables dimerization (65). Interestingly, the flow cytometry studies of Szabo et al (70) showed that while EGF induced larger ErbB1 clusters in A431 cells, it led to a substantial decrease in the size of ErbB2 homoclusters in SKBR-3 cells. The number of receptors and fraction of predimerized receptors were, however, different in the two systems. In addition, Yu et al (62) observed that the same concentration of EGF resulted in different responses from different cell types, depending on EGFR expression level. Therefore, further study is needed to establish more precisely the dependence of cluster size and density on receptor and corral densities and ligand concentration.
In summary, our preliminary results show that compartments in the plasma membrane can both inhibit and enhance clustering, similar to experimental observations (27-35). For example, the relationship between receptor dynamics and MSK rearrangement may play an important physiological role, such as in activation of ERK, which can lead to either differentiation or proliferation, depending on signal duration (44, 71). However, additional study is required to better understand the mechanistic relationship among ligand, receptor type, receptor density, corral size and corral density on clustering and the effects of clustering on cell signaling.
Supplementary Material
Figure S1. Rescaling time to collision number in mean square displacement (MSD) plots. The x-axis was rescaled from time to number of collisions, using the slope of the essentially linear relationship (over a long time period) between collision number and time. The top two panels show the MSD for a picket-fence density of 400 corrals/μm2 and the bottom panel for 25 corrals/μm2. For all cases the receptor and ligand concentrations were 200 receptors/μm2 and 20nM in the incubation medium (see text). The right panel in the top row was used to illustrate that even a doubling of the number of collisions did not reveal any dimer escapes from the more dense picket fence.
ACKNOWLEDGEMENTS
This work was supported by NIH grant P50GM085273 (the New Mexico Spatiotemporal Modeling Center). Michelle Costa was supported by an INCBN NSF IGERT fellowship. We thank the reviewers for very helpful comments and suggestions.
Footnotes
Publisher's Disclaimer: This is a PDF file of an unedited manuscript that has been accepted for publication. As a service to our customers we are providing this early version of the manuscript. The manuscript will undergo copyediting, typesetting, and review of the resulting proof before it is published in its final citable form. Please note that during the production process errors may be discovered which could affect the content, and all legal disclaimers that apply to the journal pertain.
References
- 1.Singer SJ, Nicolson GL. The fluid mosaic model of the structure of cell membranes. Science. 1972;175:720–731. doi: 10.1126/science.175.4023.720. [DOI] [PubMed] [Google Scholar]
- 2.Kusumi A, Nakada C, Ritchie K, Murase K, Suzuki K, Murakoshi H, Kasai RS, Kondo J, Fujiwara T. Paradigm shift of the plasma membrane concept from the two-dimensional continuum fluid to the partitioned fluid: high-speed single-molecule tracking of membrane molecules. Annu Rev Biophys Biomol Struct. 2005;34:351–378. doi: 10.1146/annurev.biophys.34.040204.144637. [DOI] [PubMed] [Google Scholar]
- 3.Wisniewska A, Draus J, Subczynski WK. Is a fluid-mosaic model of biological membranes fully relevant? Studies on lipid organization in model and biological membranes. Cell Mol Biol Lett. 2003;8:147–159. [PubMed] [Google Scholar]
- 4.Vereb G, Szollosi J, Matko J, Nagy P, Farkas T, Vigh L, Matyus L, Waldmann TA, Damjanovich S. Dynamic, yet structured: The cell membrane three decades after the Singer-Nicolson model. Proc Natl Acad Sci U S A. 2003;100:8053–8058. doi: 10.1073/pnas.1332550100. [DOI] [PMC free article] [PubMed] [Google Scholar]
- 5.Morone N, Fujiwara T, Murase K, Kasai RS, Ike H, Yuasa S, Usukura J, Kusumi A. Three-dimensional reconstruction of the membrane skeleton at the plasma membrane interface by electron tomography. J Cell Biol. 2006;174:851–862. doi: 10.1083/jcb.200606007. [DOI] [PMC free article] [PubMed] [Google Scholar]
- 6.Morone N, Nakada C, Umemura Y, Usukura J, Kusumi A. Three-dimensional molecular architecture of the plasma-membrane-associated cytoskeleton as reconstructed by freeze-etch electron tomography. Methods Cell Biol. 2008;88:207–236. doi: 10.1016/S0091-679X(08)00412-3. [DOI] [PubMed] [Google Scholar]
- 7.Danuser G, Waterman-Storer CM. Quantitative fluorescent speckle microscopy: where it came from and where it is going. J Microsc. 2003;211:191–207. doi: 10.1046/j.1365-2818.2003.01222.x. [DOI] [PubMed] [Google Scholar]
- 8.Andrews NL, Lidke KA, Pfeiffer JR, Burns AR, Wilson BS, Oliver JM, Lidke DS. Actin restricts FcepsilonRI diffusion and facilitates antigen-induced receptor immobilization. Nat Cell Biol. 2008;10:955–963. doi: 10.1038/ncb1755. [DOI] [PMC free article] [PubMed] [Google Scholar]
- 9.Koyama-Honda I, Ritchie K, Fujiwara T, Iino R, Murakoshi H, Kasai RS, Kusumi A. Fluorescence imaging for monitoring the colocalization of two single molecules in living cells. Biophys J. 2005;88:2126–2136. doi: 10.1529/biophysj.104.048967. [DOI] [PMC free article] [PubMed] [Google Scholar]
- 10.Murase K, Fujiwara T, Umemura Y, Suzuki K, Iino R, Yamashita H, Saito M, Murakoshi H, Ritchie K, Kusumi A. Ultrafine membrane compartments for molecular diffusion as revealed by single molecule techniques. Biophys J. 2004;86:4075–4093. doi: 10.1529/biophysj.103.035717. [DOI] [PMC free article] [PubMed] [Google Scholar]
- 11.Ritchie K, Iino R, Fujiwara T, Murase K, Kusumi A. The fence and picket structure of the plasma membrane of live cells as revealed by single molecule techniques (Review) Mol Membr Biol. 2003;20:13–18. doi: 10.1080/0968768021000055698. [DOI] [PubMed] [Google Scholar]
- 12.Suzuki K, Ritchie K, Kajikawa E, Fujiwara T, Kusumi A. Rapid hop diffusion of a G-protein-coupled receptor in the plasma membrane as revealed by single-molecule techniques. Biophys J. 2005;88:3659–3680. doi: 10.1529/biophysj.104.048538. [DOI] [PMC free article] [PubMed] [Google Scholar]
- 13.Cherry RJ, Godfrey RE, Peters R. Mobility of bacteriorhodopsin in lipid vesicles. Biochem Soc Trans. 1982;10:342–343. doi: 10.1042/bst0100342. [DOI] [PubMed] [Google Scholar]
- 14.Peters R, Cherry J. Lateral and rotational diffusion of bacteriorhodopsin in lipid bilayers: experimental test of the Saffman-Delbruck equations. Proc Natl Acad Sci U S A. 1982;79:4317–4321. doi: 10.1073/pnas.79.14.4317. [DOI] [PMC free article] [PubMed] [Google Scholar]
- 15.Saffman PG, Delbruck M. Brownian motion in biological membranes. Proc Natl Acad Sci U S A. 1975;72:3111–3113. doi: 10.1073/pnas.72.8.3111. [DOI] [PMC free article] [PubMed] [Google Scholar]
- 16.Roess DA, Horvat RD, Munnelly H, Barisas BG. Luteinizing hormone receptors are self-associated in the plasma membrane. Endocrinology. 2000;141:4518–4523. doi: 10.1210/endo.141.12.7802. [DOI] [PubMed] [Google Scholar]
- 17.Nelson S, Horvat RD, Malvey J, Roess DA, Barisas BG, Clay CM. Characterization of an intrinsically fluorescent gonadotropin-releasing hormone receptor and effects of ligand binding on receptor lateral diffusion. Endocrinology. 1999;140:950–957. doi: 10.1210/endo.140.2.6518. [DOI] [PubMed] [Google Scholar]
- 18.Hegener O, Prenner L, Runkel F, Baader SL, Kappler J, Haberlein H. Dynamics of beta2-adrenergic receptor-ligand complexes on living cells. Biochemistry. 2004;43:6190–6199. doi: 10.1021/bi035928t. [DOI] [PubMed] [Google Scholar]
- 19.Fujiwara T, Ritchie K, Murakoshi H, Jacobson K, Kusumi A. Phospholipids undergo hop diffusion in compartmentalized cell membrane. J Cell Biol. 2002;157:1071–1081. doi: 10.1083/jcb.200202050. [DOI] [PMC free article] [PubMed] [Google Scholar]
- 20.Wilson BS, Pfeiffer JR, Raymond-Stintz MA, Lidke D, Andrews N, Zhang J, Yin W, Steinberg S, Oliver JM. Exploring membrane domains using native membrane sheets and transmission electron microscopy. Methods Mol Biol. 2007;398:245–261. doi: 10.1007/978-1-59745-513-8_17. [DOI] [PubMed] [Google Scholar]
- 21.Dietrich C, Bagatolli LA, Volovyk ZN, Thompson NL, Levi M, Jacobson K, Gratton E. Lipid rafts reconstituted in model membranes. Biophys J. 2001;80:1417–1428. doi: 10.1016/S0006-3495(01)76114-0. [DOI] [PMC free article] [PubMed] [Google Scholar]
- 22.Nagy P, Vereb G, Sebestyen Z, Horvath G, Lockett SJ, Damjanovich S, Park JW, Jovin TM, Szollosi J. Lipid rafts and the local density of ErbB proteins influence the biological role of homo- and heteroassociations of ErbB2. J Cell Sci. 2002;115:4251–4262. doi: 10.1242/jcs.00118. [DOI] [PubMed] [Google Scholar]
- 23.Nakada C, Ritchie K, Oba Y, Nakamura M, Hotta Y, Iino R, Kasai RS, Yamaguchi K, Fujiwara T, Kusumi A. Accumulation of anchored proteins forms membrane diffusion barriers during neuronal polarization. Nat Cell Biol. 2003;5:626–632. doi: 10.1038/ncb1009. [DOI] [PubMed] [Google Scholar]
- 24.Ritchie K, Shan XY, Kondo J, Iwasawa K, Fujiwara T, Kusumi A. Detection of non-Brownian diffusion in the cell membrane in single molecule tracking. Biophys J. 2005;88:2266–2277. doi: 10.1529/biophysj.104.054106. [DOI] [PMC free article] [PubMed] [Google Scholar]
- 25.Woolf PJ, Linderman JJ. Self organization of membrane proteins via dimerization. Biophys Chem. 2003;104:217–227. doi: 10.1016/s0301-4622(02)00369-1. [DOI] [PubMed] [Google Scholar]
- 26.Brinkerhoff CJ, Woolf PJ, Linderman JJ. Monte Carlo simulations of receptor dynamics: insights into cell signaling. J Mol Histol. 2004;35:667–677. doi: 10.1007/s10735-004-2663-y. [DOI] [PubMed] [Google Scholar]
- 27.Allen JA, Halverson-Tamboli RA, Rasenick MM. Lipid raft microdomains and neurotransmitter signalling. Nat Rev Neurosci. 2007;8:128–140. doi: 10.1038/nrn2059. [DOI] [PubMed] [Google Scholar]
- 28.Pike LJ. Lipid rafts: bringing order to chaos. J Lipid Res. 2003;44:655–667. doi: 10.1194/jlr.R200021-JLR200. [DOI] [PubMed] [Google Scholar]
- 29.Miura Y, Hanada K, Jones TL. G(s) signaling is intact after disruption of lipid rafts. Biochemistry. 2001;18:15418–15423. doi: 10.1021/bi015574a. [DOI] [PubMed] [Google Scholar]
- 30.Marmor MD, Julius M. Role for lipid rafts in regulating interleukin-2 receptor signaling. Blood. 2001;98:1489–1497. doi: 10.1182/blood.v98.5.1489. [DOI] [PubMed] [Google Scholar]
- 31.Bénéteau M, Pizon M, Chaigne-Delalande B, Daburon S, Moreau P, De Giorgi F, Ichas F, Rebillard A, Dimanche-Boitrel MT, Taupin JL, Moreau JF, Legembre P. Localization of Fas/CD95 into the lipid rafts on down-modulation of the phosphatidylinositol-3-kinase signaling pathway. Mol Can Res. 2008;6:604–613. doi: 10.1158/1541-7786.MCR-07-0331. [DOI] [PubMed] [Google Scholar]
- 32.Ganguly S, Pucadyil TJ, Chattopadhyay A. Actin cytoskeleton-dependent dynamics of the human serotonin1A receptor correlates with receptor signaling. Biophys J. 2008;95:451–463. doi: 10.1529/biophysj.107.125732. [DOI] [PMC free article] [PubMed] [Google Scholar]
- 33.Douglass AD, Vale RD. Single-molecule microscopy reveals plasma membrane microdomains created by protein-protein networks that exclude or trap signaling molecules in T cells. Cell. 2005;121:937–950. doi: 10.1016/j.cell.2005.04.009. [DOI] [PMC free article] [PubMed] [Google Scholar]
- 34.Heneberg P, Lebduska P, Draberova L, Korb J, Draber P. Topography of plasma membrane microdomains and its consequences for mast cell signaling. Eur J Immunol. 2006;36:2795–2806. doi: 10.1002/eji.200636159. [DOI] [PubMed] [Google Scholar]
- 35.Chichili GR, Rodgers W. Clustering of membrane raft proteins by the actin cytoskeleton. J Biol Chem. 2007;282:36682–36691. doi: 10.1074/jbc.M702959200. [DOI] [PubMed] [Google Scholar]
- 36.Guo C, Levine H. A thermodynamic model for receptor clustering. Biophys J. 1999;77:2358–2365. doi: 10.1016/S0006-3495(99)77073-6. [DOI] [PMC free article] [PubMed] [Google Scholar]
- 37.Shi Y. Clustering and signaling of cell receptors. Physica A. 2002;311:199–212. [Google Scholar]
- 38.Lim KI, Yin J. Localization of receptors in lipid rafts can inhibit signal transduction. Biotechnol Bioeng. 2005;90:694–702. doi: 10.1002/bit.20464. [DOI] [PubMed] [Google Scholar]
- 39.Gopalakrishnan M, Forsten-Williams K, Nugent MA, Täuber UW. Effects of receptor clustering on ligand dissociation kinetics: theory and simulations. Biophys J. 2005;89:3686–3700. doi: 10.1529/biophysj.105.065300. [DOI] [PMC free article] [PubMed] [Google Scholar]
- 40.Niehaus AM, Vlachos DG, Edwards JS, Plechac P, Tribe R. Microscopic simulation of membrane molecule diffusion on corralled membrane surfaces. Biophys J. 2008;94:1551–1564. doi: 10.1529/biophysj.107.106484. [DOI] [PMC free article] [PubMed] [Google Scholar]
- 41.Duke T, Graham I. Equilibrium mechanisms of receptor clustering. Prog Biophys Mol Biol. 2009;100:18–24. doi: 10.1016/j.pbiomolbio.2009.08.003. [DOI] [PubMed] [Google Scholar]
- 42.Collins S, Stamatakis M, Vlachos DG. Adaptive coarse-grained Monte Carlo simulation of reaction and diffusion dynamics in heterogenous plasma membranes. BMC Bioinformatics. 2010;11:218. doi: 10.1186/1471-2105-11-218. [DOI] [PMC free article] [PubMed] [Google Scholar]
- 43.Kholodenko BN, Demin OV, Moehren G, Hoek JB. Quantification of Short Term Signaling by the Epidermal Growth Factor Receptor. J. Biol. Chem. 1999;274:30169–30181. doi: 10.1074/jbc.274.42.30169. [DOI] [PubMed] [Google Scholar]
- 44.Sasagawa S, Ozaki Y, Fujita K, Kuroda S. Prediction and validation of the distinct dynamics of transient and sustained ERK activation. Nat Cell Biol. 2005;7:365–373. doi: 10.1038/ncb1233. [DOI] [PubMed] [Google Scholar]
- 45.Mayawala K, Vlachos DG, Edwards JS. Computational modeling reveals molecular details of epidermal growth factor binding. BMC Cell Biol. 2005;6:41. doi: 10.1186/1471-2121-6-41. [DOI] [PMC free article] [PubMed] [Google Scholar]
- 46.Mayawala K, Vlachos DG, Edwards JS. Heterogeneities in EGF receptor density at the cell surface can lead to concave up scatchard plot of EGF binding. FEBS Lett. 2005;579:3043–3047. doi: 10.1016/j.febslet.2005.04.059. [DOI] [PubMed] [Google Scholar]
- 47.Kusumi A, Shira YM, Koyama-Honda I, Suzuki KGN, Fujiwara TK. Hierarchial organization of the plasma membrane: investigations by single-molecule tracking vs. fluorescence correlation spectroscopy. FEBS Letters. 2010;584:1814–1823. doi: 10.1016/j.febslet.2010.02.047. [DOI] [PubMed] [Google Scholar]
- 48.Danuser G, Waterman-Storer CM. Quantitative fluorescent speckle microscopy of cytoskeleton dynamics. Annu Rev Biophys Biomol Struct. 2006;35:361–387. doi: 10.1146/annurev.biophys.35.040405.102114. [DOI] [PubMed] [Google Scholar]
- 49.Beres SB, Sylva GL, Sturdevant DE, Granville CN, Liu M, Ricklefs SM, Whitney AR, Parkins LD, Hoe NP, Adams GJ, Low DE, DeLeo FR, McGeer A, Musser JM. Genome-wide molecular dissection of serotype M3 group A Streptococcus strains causing two epidemics of invasive infections. Proc Natl Acad Sci U S A. 2004;101:11833–11838. doi: 10.1073/pnas.0404163101. [DOI] [PMC free article] [PubMed] [Google Scholar]
- 50.Vallotton P, Gupton SL, Waterman-Storer CM, Danuser G. Simultaneous mapping of filamentous actin flow and turnover in migrating cells by quantitative fluorescent speckle microscopy. Proc Natl Acad Sci U S A. 2004;101:9660–9665. doi: 10.1073/pnas.0300552101. [DOI] [PMC free article] [PubMed] [Google Scholar]
- 51.Deshpande VS, McMeeking RM, Evans AG. A bio-chemo-mechanical model for cell contractility. Proc Natl Acad Sci U S A. 2006;103:14015–14020. doi: 10.1073/pnas.0605837103. [DOI] [PMC free article] [PubMed] [Google Scholar]
- 52.Bezdek JC. Pattern recognition with fuzzy objective function algorithms. Plenum Press; NY: 1981. (Advanced Applications in Pattern Recognition) [Google Scholar]
- 53.Hopkins B, Skellam JG. A new method for determining the type of distribution of plant individuals. Annals of Botany. 1954;18(2):213–227. [Google Scholar]
- 54.Zhang J, Leiderman K, Pfeiffer JR, Wilson BS, Oliver JM, Steinberg SL. Characterizing the topography of membrane receptors and signaling molecules from spatial patterns obtained using nanometer-scale electron-dense probes and electron microscopy. Micron. 2006;37:14–24. doi: 10.1016/j.micron.2005.03.014. [DOI] [PubMed] [Google Scholar]
- 55.Snedecor GW, Cochran WG. Statistical methods. Iowa State University Press; Ames: 1989. [Google Scholar]
- 56.Lo HW. Nuclear mode of the EGFR signaling network: biology, prognostic value, and therapeutic involvement. Discov Medc. 2010;10:44–51. [PMC free article] [PubMed] [Google Scholar]
- 57.Olayioue MA, Neve RM, Lane HA, Hynes NE. The ErbB signaling network: receptor heterodimerization in development and cancer. EMBO J. 2000;19:3159–3167. doi: 10.1093/emboj/19.13.3159. [DOI] [PMC free article] [PubMed] [Google Scholar]
- 58.Bublil EM, Yarden Y. The EGF receptor family: spearheading a merger of signaling and therapeutics. Curr Opin Cell Biol. 2007;19:124–134. doi: 10.1016/j.ceb.2007.02.008. [DOI] [PubMed] [Google Scholar]
- 59.Casalini PC, Iorio MV, Galmozzi E, Ménard S. Role of HER receptors family in development and differentiation. J Cell Physiol. 2004;200:343–350. doi: 10.1002/jcp.20007. [DOI] [PubMed] [Google Scholar]
- 60.Hynes NE, MacDonald G. ErbB receptors and signaling pathways in cancer. Cuff Opin Cell Biol. 2009;21:177–184. doi: 10.1016/j.ceb.2008.12.010. [DOI] [PubMed] [Google Scholar]
- 61.Sebastian S, Settleman J, Reshkin SJ, Azzariti A, Bellizzi A, Paradiso A. The complexity of targeting EGFR signaling in cancer: from expression to turnover. Biochem Biophys Acta. 2006;1766:120–139. doi: 10.1016/j.bbcan.2006.06.001. [DOI] [PubMed] [Google Scholar]
- 62.Yu C, Hale J, Ritchie K, Prasad NK, Irudayaraj J. Receptor overexpression or inhibition alters cell surface dynamics of EGF-EGFR interaction: new insights from real-time single molecule analysis. Biochem Biophys Res Commun. 2008;378:376–382. doi: 10.1016/j.bbrc.2008.11.018. [DOI] [PubMed] [Google Scholar]
- 63.Abulrob A, Lu Z, Baumann E, Vobornik D, Taylor R, Stanimirovic D, Johnston LJ. Nanoscale imaging of epidermal growth factor receptor clustering. Effects of inhibitors. J Biol Chem. 2010;285:3145–3156. doi: 10.1074/jbc.M109.073338. [DOI] [PMC free article] [PubMed] [Google Scholar]
- 64.Clayton AHA, Walker F, Orchard SG, Henderson C, Fuchs D, Rothacker J, Nice EC, Burgess AW. Ligand-induced dimer-tetramer transition during the activation of the cell surface epidermal growth factor receptor–a multidimensional microscopy analysis. J Biol Chem. 2005;280:30392–30399. doi: 10.1074/jbc.M504770200. [DOI] [PubMed] [Google Scholar]
- 65.Saffarian S, Li Y, Elson EL, Pike LJ. Oligomerization of the EGF receptor investigated by live cell fluorescence intensity distribution analysis. Biophys J. 2007;93:1021–1031. doi: 10.1529/biophysj.107.105494. [DOI] [PMC free article] [PubMed] [Google Scholar]
- 66.Sheetz MP, Sable JE, Dobereiner HG. Continuous membrane-cytoskeleton adhesion requires continuous accommodation to lipid and cytoskeleton dynamics. Annu Rev Biophys Biomol Struct. 2006;35:417–434. doi: 10.1146/annurev.biophys.35.040405.102017. [DOI] [PubMed] [Google Scholar]
- 67.Jia C, Zhou Z, Liu R, Chen S, Xia R. EGF receptor clustering is induced by a 0.4 mT power frequency magnetic field and blocked by the EGF receptor tyrosine kinase inhibitor PD153035. Bioelectromagnetics. 2007;28:197–207. doi: 10.1002/bem.20293. [DOI] [PubMed] [Google Scholar]
- 68.Xiao Z, Zhang W, Yang Y, Xu L, Fang X. Single-molecule diffusion study of activated EGFR implicates its endocytic pathway. Biochem Biophys Res Commun. 2008;369:730–734. doi: 10.1016/j.bbrc.2008.02.084. [DOI] [PubMed] [Google Scholar]
- 69.Clayton AHA, Tavarnesi ML, Johns TG. Unligated epidermal growth factor receptor forms higher order oligomers within microclusters on A431 cells that are sensitive to tyrosine kinase inhibitor binding. Biochemistry. 2007;46:4589–4597. doi: 10.1021/bi700002b. [DOI] [PubMed] [Google Scholar]
- 70.Szabo A, Horvath G, Szollosi J, Nagy P. Quantitative characterization of the large-scale association of ErbB1 and ErbB2 by flow cytometeric homo-FRET measurements. Biophys J. 2008;95:2086–2096. doi: 10.1529/biophysj.108.133371. [DOI] [PMC free article] [PubMed] [Google Scholar]
- 71.Thrane EV, Schwarze PE, Thoresen GH, Lag M, Refsnes M. Persistent versus transient map kinase (ERK) activation in the proliferation of lung epithelial type 2 cells. Exp Lung Res. 2001;27:387–400. doi: 10.1080/019021401750193638. [DOI] [PubMed] [Google Scholar]
Associated Data
This section collects any data citations, data availability statements, or supplementary materials included in this article.
Supplementary Materials
Figure S1. Rescaling time to collision number in mean square displacement (MSD) plots. The x-axis was rescaled from time to number of collisions, using the slope of the essentially linear relationship (over a long time period) between collision number and time. The top two panels show the MSD for a picket-fence density of 400 corrals/μm2 and the bottom panel for 25 corrals/μm2. For all cases the receptor and ligand concentrations were 200 receptors/μm2 and 20nM in the incubation medium (see text). The right panel in the top row was used to illustrate that even a doubling of the number of collisions did not reveal any dimer escapes from the more dense picket fence.