Abstract
Background and purpose
The micro-architecture of bone has been increasingly recognized as an important determinant of bone strength. Successful operative stabilization of fractures depends on bone strength. We evaluated the osseous micro-architecture and strength of the osteoporotic human femoral head.
Material and methods
6 femoral heads, obtained during arthroplasty surgery for femoral neck fracture, underwent micro-computed tomography (microCT) scanning at 30 μm, and bone volume ratio (BV/TV), trabecular thickness, structural model index, connection density, and degree of anisotropy for volumes of interest throughout the head were derived. A further 15 femoral heads underwent mechanical testing of compressive failure stress of cubes of trabecular bone from different regions of the head.
Results
The greatest density and trabecular thickness was found in the central core that extended from the medial calcar to the physeal scar. This region also correlated with the greatest degree of anisotropy and proportion of plate-like trabeculae. In the epiphyseal region, the trabeculae were organized radially from the physeal scar. The weakest area was found at the apex and peripheral areas of the head. The strongest region was at the center of the head.
Interpretation
The center of the femoral head contained the strongest trabecular bone, with the thickest, most dense trabeculae. The apical region was weaker. From an anatomical and mechanical point of view, implants that achieve fixation in or below this central core may achieve the most stable fixation during fracture healing.
The dynamic hip screw (DHS) and cephalomedullary nails are widely used to manage osteoporotic proximal femoral fractures. It is estimated that between 5% and 16% of fixations fail (Parker 1992). The most common mode of failure is supero-lateral cut-out of the screw (Haynes et al. 1997). There are several reasons for failure, including advanced age, fracture stability, reduction, and screw position (Simpson et al. 1989, Gundle et al. 1995, Massoud 2009).
Radiological studies have suggested that the location of the lag screw within the femoral head is a strong independent predictor of cut-out (Parmar et al. 2005). Clinical rules have been developed to position the screw in areas with lower observed rates of cut-out. These methods have not been derived from biomechanical evaluation of bone density, or cut-out resistance, within the femoral head. The tip-to-apex distance (TAD), first described by (Baumgaertner et al. 1995), is the most widely used guide. One publication recommended that the combined (antero-posterior and lateral) distance from the tip of the screw to the apex should be between 15 mm and 25 mm to reduce the risk of cut-out (Parmar et al. 2005). Parker (1992) suggested that the central and inferior areas were the best site of placement. The authors of the most recent study recommended that the lag screw should be placed in either a central-inferior or an anterior-inferior position, and that the TAD should be kept to less than 25 mm (De Bruijn et al. 2012). The authors of these retrospective studies did not reach any clear consensus about the optimum placement of the screw, and none of these methods explain why these particular loci were associated with successful outcomes.
Recent micro-imaging techniques such as microCT analysis may clarify the micro-architecture of the femoral head and help in optimization of screw placement. Micro-architectural changes are increasingly being recognized as predictors of future fragility fractures (Rozental et al. 2013).
We performed 2 experiments based on micro-architecture and failure stress to investigate the osseous micro-architecture and strength of trabecular bone in the human femoral head, to allow recommendations to be made about optimum screw position.
Material and methods
Experiment 1
We obtained approval from the Research Ethics Committee for use of discarded bone material (LREC 2002/1/22). Femoral heads were obtained from 6 patients (5 women) who had sustained an osteoporotic-type proximal femoral fracture, requiring arthroplasty. Patients were excluded if a pathological etiology (tumor) was suspected or if they were unable to consent through cognitive impairment. Mean age was 72 (61–83) years. To preserve the trabecular architecture of the femoral heads, they were removed during the surgical procedure without use of a “corkscrew” instrument. The sample was stored in formaldehyde prior to scanning.
MicroCT scanning was undertaken with a Skyscan 1172 mircoCT scanner (Bruker-microCT (formerly Skyscan Ltd), Kontich, Belgium). Shadow-projection images were taken at 0.7-degree steps for a full 360-degree stage rotation. The pixel resolution was 30 μm. A random motion of 5 was used, and 3 frames were averaged at each step to reduce signal noise. An aluminium filter (0.5 mm) was used to reduce beam hardening, and the beam energy was 100 kV. The images were reconstructed into axial slices using NRecon (version 1.6; Skyscan). Further processing and analysis was carried out using the software package CTAn (version 1.11; Bruker-microCT).
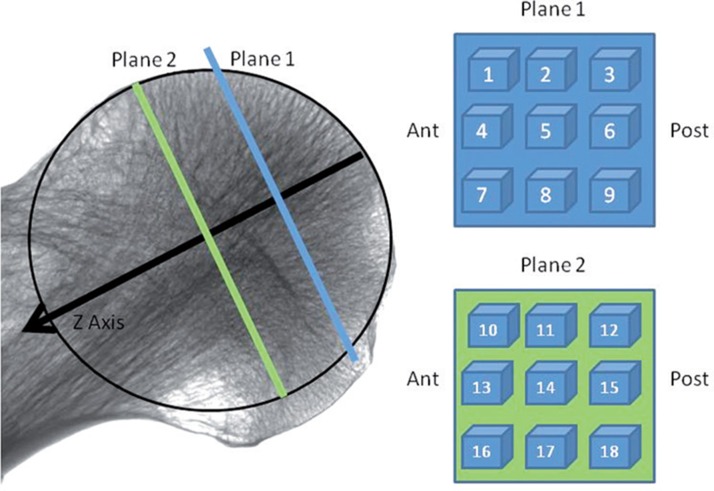
The maximal diameter of the femoral head was measured. Thereafter, a virtual sphere was used to describe the femoral head, with the diameter fitting this maximal diameter. The z-axis of the scan was defined as a line passing up the center of the femoral neck. The point where it exited the femoral head was defined as the apex. This plane was defined anatomically and the x- and y-planes were defined orthogonal to this plane (Figure 1).
Figure 1.
Arrangement of volumes of interest (VOIs) on 2 planes orthogonal to the neck axis (z-direction). Plane 1 was located orthogonal to the neck axis halfway between the center of the head and the apex. Plane 2 was located similarly at the center of the head. The center was defined as the center of the largest sphere that could be contained in the femoral head.
We created 18 cubic volumes of interest (VOIs) (Figure 1). These were arranged in a 3 × 3 arrangement on 2 planes. The first plane was located perpendicular to the z-axis halfway between the apex of the head and the center of the head. The second plane was located at the midpoint of the sphere, again orthogonal to the z-axis. Each VOI measured 5 mm3. At each VOI, we determined the following indices: bone volume fracture (BV/TV), trabecular thickness (Tb.Th.), structural model index (SMI), connectivity density (Conn.D), and degree of anisotropy (DA) (Table 1) These indices were calculated by CTAn after automatic filters were applied to binarize and despeckle the scans. The SMI is a method that determines trabecular morphology. A figure closer to 0 signifies plate-like trabeculae while a figure closer to 3 suggests rod-like trabeculae. Negative SMI values can occur where trabeculae have a concave surface (Hildebrand and Ruegsegger 1997).
Table 1.
Micro-architectural indices measured for each volume of interest (VOI)
| Micro-architectural index | Abbrev. | Unit | Description | |
|---|---|---|---|---|
| Percentage bone volume | BV/TV | % | Measure of the ratio of solid to space within a given volume surrogate parameter for bone strength (Legrand et al. 2000) | |
| Trabecular thickness | Tb. Th | mm | The width of the trabecular—important for determining structural integrity (Tanck et al. 2009) | |
| Structural model index | SMI | None | Indicates relative presence of rods, plates, or cylinders in a 3D model (Hildebrand and Ruegsegger 1997). Plate 0, rod 3, sphere 4 (Skyscan 2010) | |
| Degree of anisotropy | DA | None | Measure of how well orientated a microstructure is within a given volume (Cotter et al. 2009) | |
| Connectivity density | Conn.D | mm-3 | Number of connections between trabecular structures in a given volume—a good measure of bone structure (Fajardo and Muller 2001) |
Experiment 2
15 further femoral heads (from 11 men and 4 women) were obtained in a similar way. Mean age was 81 (62–102) years. At the time of removal, the superior and inferior regions of the head were marked in line with the fovea, to aid subsequent orientation. The heads were stored in phosphate buffered saline (PBS) for up to 5 days before preparation and testing. Samples were allowed to acclimatize to ambient temperature before testing. The specimens were kept moist at all times.
We used a custom-designed cutting jig to make two 10-mm thick discs from the femoral heads that corresponded to the locations described above. Cubes of bone of dimensions 10 mm × 10 mm × 10 mm were cut from each disc. For each sample, 1 cube was made from plane 1, and 5 cubes were made from plane 2. These cubes corresponded to positions 5 (apex) and 10 (antero-superior), 12 (postero-superior), 14 (central), 16 (antero-inferior) and 18 (postero-inferior) (Figure 1). The dimensions of the cube face to be tested were confirmed by averaging 3 readings taken with a micrometer caliper.
The cubes were positioned between horizontal plates on a Zwick Roell mechanical testing apparatus. The cubes were compressed by 2 mm under displacement control at a rate of 1 mm/s and data points were recorded for every 0.1 s, 0.1 mm of displacement, and 0.1 N force increment. The cubes were loaded in the z-direction. A dataset was generated for each head that recorded applied force versus displacement. We determined the failure force from a force-displacement graph; this was defined as the point where no further force was required to produce further displacement of the bone. The area in contact with the plate was calculated and the failure stress was calculated (failure stress (Nmm-2) = failure force (N) / area (mm2)).
Statistics
We could not check data from experiment 1 for normality because of the low number of samples. We therefore used non-parametric tests. For the bone volume ratio, trabecular thickness, and connectivity density, the mean and standard deviation across the 18 VOIs in each head was calculated. A Friedman test was performed on the datasets and F-values and p-values were determined. We performed a post-hoc Dunn’s multiple comparison test with a Bonferonni adjustment of subsequent p-values to identify which cubes were statistically different from the central (cube 14) area.
For experiment 2, we performed a Shapiro-Wilk test and this showed the data to be normally distributed. A repeat-measures 1-way analysis of variance (ANOVA) was performed. Post-hoc comparison using a Bonferroni correction (reporting adjusted p-values) was made between the apical cube (cube 5) and the other cubes, and the central cube (cube 14) and the other cubes.
Statistical significance was set at p < 0.05 for both experiments, and corrections were made for multiple testing, with the corrected p-value reported.
Statistical analysis was performed using Graphpad Prism software version 6.
Results
Experiment 1
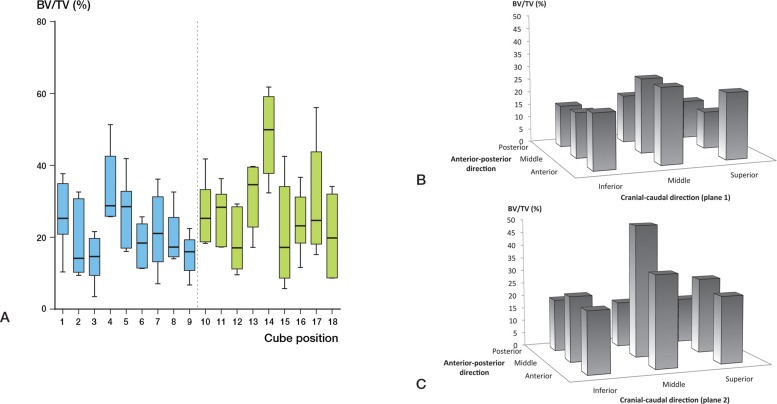
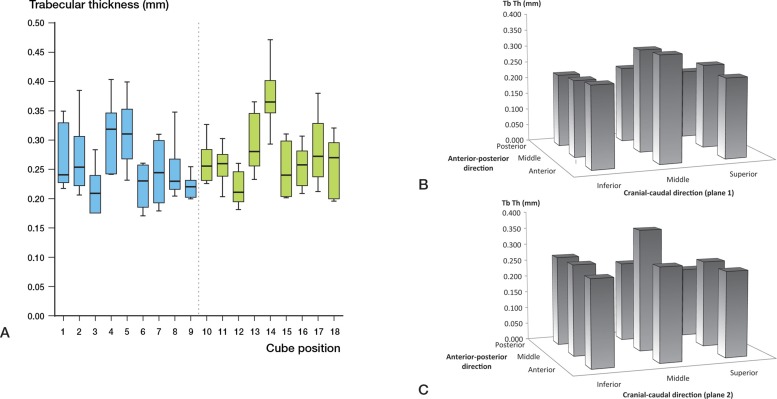
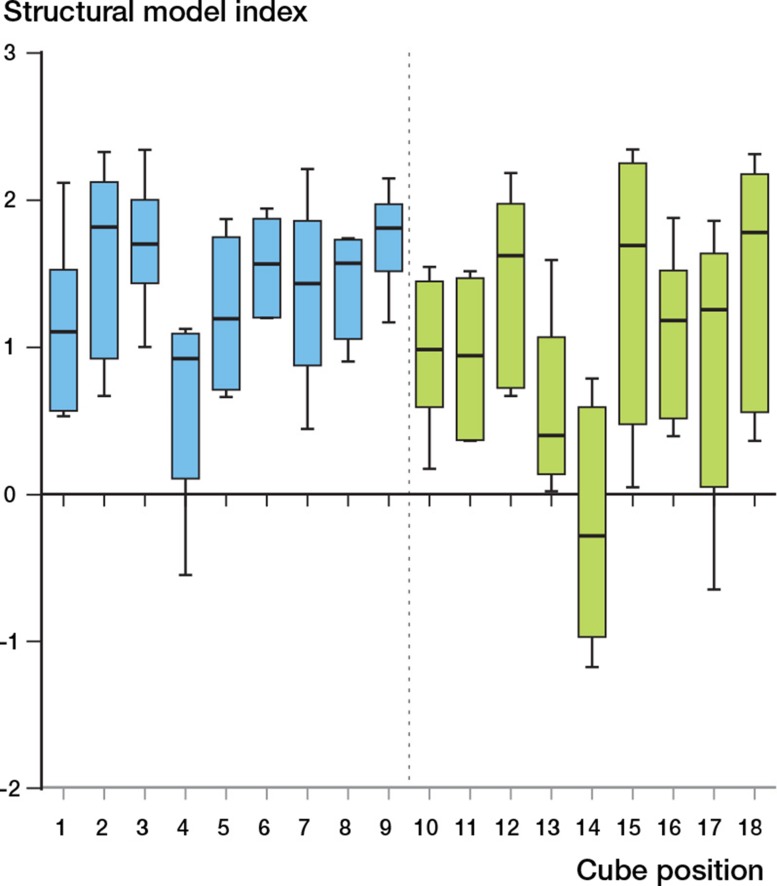
BV/TV varied throughout the head (p < 0.001) (Figure 2A). The highest BV/TV was in cube location 14 at the center of the head. All the VOIs with low BV/TV were located in the inferior portion of the head (cube locations 3, 9, 12, 15, and 18) (Figure 2B and C). Cube 14 also had the highest trabecular thickness (p < 0.001) (Table 3, see supplementary data, and Figure 3A). The trabecular thickness in this cube was similarly higher than all other cube locations (Figure 3B and C). Cube location 14 showed the lowest SMI (p < 0.001) (Figure 4). This suggests that trabeculae in this VOI had plate-like morphology. There was no significant variation in the DA (Figure 5, see supplementary data) but the lowest anisotropy occurred in cube locations 5 and 14, corresponding to the areas containing the thickest, densest plate-like trabeculae. Bone is this region had the greatest isotropy and strength in all directions (Figure 5). Connectivity density also showed no variation amongst the locations within the femoral head (p = 0.3) (Figure 6, see supplementary data).
Figure 2.
A. Bone volume to total volume ratio (BV/TV, with 95% CI) at different sites in the femoral head (%). B and C. 3-dimensional representation of BV/TV distribution throughout femoral head.
Figure 3.
A. Trabecular thickness (Tb.Th, with 95% CI) at different sites in the femoral head. B and C. 3-dimensional representation of trabecular thickness (Tb.Th.) distribution throughout femoral head.
Figure 4.
Structural model index (SMI, with 95% CI) at different sites in the femoral head.
Experiment 2
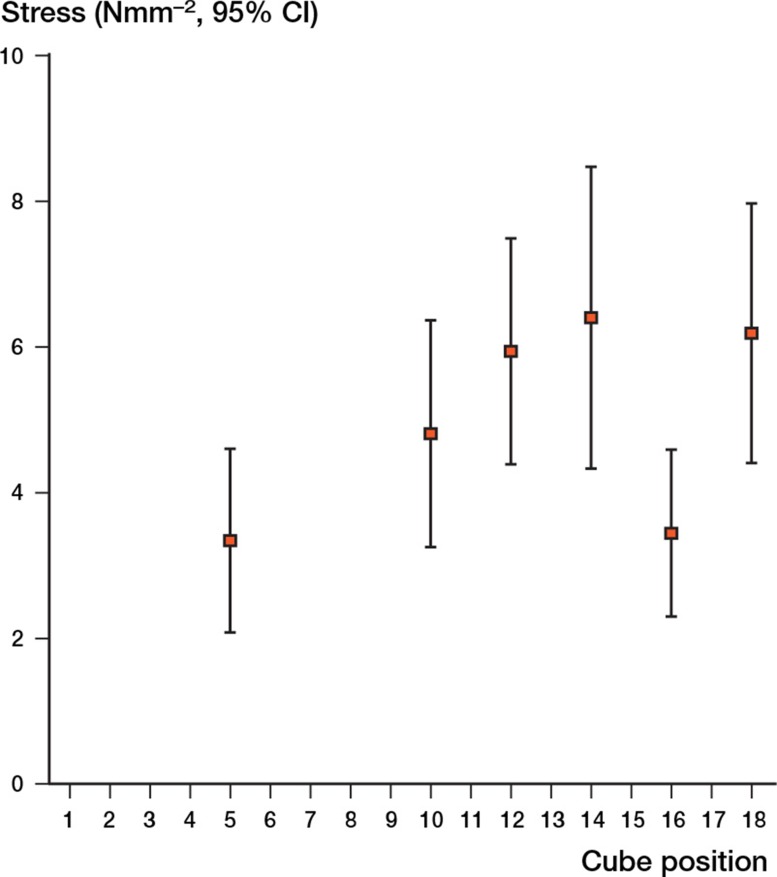
The largest failure stress was observed in cube location 14 (central). The failure stress varied throughout the head (p = 0.002) (Figure 7). The central area was significantly stronger than the apical cube location (cube 5) (mean difference 3.1 Nmm-2, 95% CI: 1.4–4.70; p < 0.001). The apex was weaker than cube location 10 (p = 0.003), cube location 12 (p = 0.001), and cube location 18 (p = 0.004).
Figure 7.
Failure stress in the femoral head (with 95% CI).
Discussion
We found marked heterogeneity and failure stress throughout the head. Despite uniform loss of bone mass and trabecular thickness, several studies (Ciarelli et al. 2000, Homminga et al. 2002) and our own data suggest that the highest strength in the trabecular structure is found at the center of the head. These areas are associated with transfer of stress from the acetabulum to the femoral diaphyses. Homminga et al. (2002) suggested that osteoporotic femoral heads have overadapted strength in the primary loading direction at the expense of other loading planes, predisposing the femur to fracture. Issever et al. (2009) showed that there were statistically significant distinctions between the inferior and superior locations in BV/TV, Tb.Th, and SMI, which is in keeping with our data.
Previous clinical studies of DHS screw placement have been retrospective. Tip-to-apex distance (TAD) is a scale variable that describes cumulative distance on AP and lateral radiographs, corrected for magnification, of the screw from the apex of the head. As it is a scale variable, a screw may have the same TAD, but differing positions around the neck axis of the hip. 7 studies have examined TAD and/or the position of the lag screw in relation to cut-out (Table 2). Some authors have recommended avoiding the superior segments of the head (Pervez et al. 2004) while others have proposed that placing the lag screw in the inferior or central part of the femoral head can give favorable outcomes (Hsueh et al. 2010). The latter authors, in the largest series to date, reported the results of 937 patients over a 4-year period. They reported a prevalence of cut-out of 7%. They found that the best outcomes were for screws placed in a central position (middle/middle). They used the technique of Bonamo and Accettola (1982) to define screw placement. This technique has a significant drawback. Although superior to inferior classification is made on the AP radiograph, there is no attempt to quantify lateral to medial placement on the AP. An area in the superior medial aspect of the head on the AP may be quite dissimilar to the superior lateral aspect. Hsueh et al. (2010) noted 11 cases of screw cut-out with a TAD of < 25 mm. These failures were related to malreduction and superior screw placement. As these studies have been observational clinical studies, they can offer no definite structural explanation for the optimum place for a DHS. The term TAD may also suggest that the position of the tip is most important for fixation, whereas the position of the tip is in reality a guide to where the screw threads are positioned in the head. This is compounded by the commonly held belief that the apical subchondral region is where the strongest bone is (Kyle et al. 1979, Laskin et al. 1979). The majority of papers agree that the superior and posterior parts of the femoral head should be avoided. The literature generally favors either central or inferior placement in the coronal plane and central placement in the sagittal plane.
Table 2.
Studies examining tip-to-apex distance (TAD) and screw placement
| Study | Recommended TAD | Position with ↑ cut-out | Optimum position |
|---|---|---|---|
| Hseuh et al. 2010 | < 15 mm | Superior and inferior/posterior | Middle/middle or inferior/middle |
| Pervez et al. 2004 | < 20 mm | Superior and anterior | |
| Gundle et al. 1995 | Superior and posterior | ||
| Baumgaertner 1995 | < 25 mm | Superior and posterior | |
| Parker 1992 | Superior and posterior | Central and inferior | |
| Davis et al. 1990 | Posterior | Central | |
| Mainds and Newman 1989 | Superior | Central and inferior |
The SMI was most plate-like in the central volume of interest (VOI), while 3 of the parameters measured in this study (Tb.Th, SMI, and BV/TV) indicated that the weakest bone is in the inferior VOIs of the head, a site that 3 papers recommend as an optimum position for the lag screw. One explanation for this discrepancy would be that as an inferiorly placed lag screw migrates, it does so superiorly into the region of most dense bone. If a screw is placed eccentrically in the sagittal plane (i.e. anterior or posterior), superior migration would not encounter the strongest bone in the center of the head and the lag screw may be at risk of cut-out.
We could not quantify the trabecular orientation in this study. This factor may be important in predicting failures. Where screws are placed on or below the neck axis, with screw threads engaging the weight-bearing trabecular network, TAD may be less important. The positioning of screw threads in the superior portion of the head on the AP view combined with any position on the lateral is unacceptable. An inferiorly placed screw on the AP view may be acceptable if it is in the central portion on the lateral roentgen. This method helps to place the DHS in the area of the femoral head where the principal trabecular groups intersect. Even in severe osteoporosis, the principal compressive trabeculae remain (Singh et al. 1970).
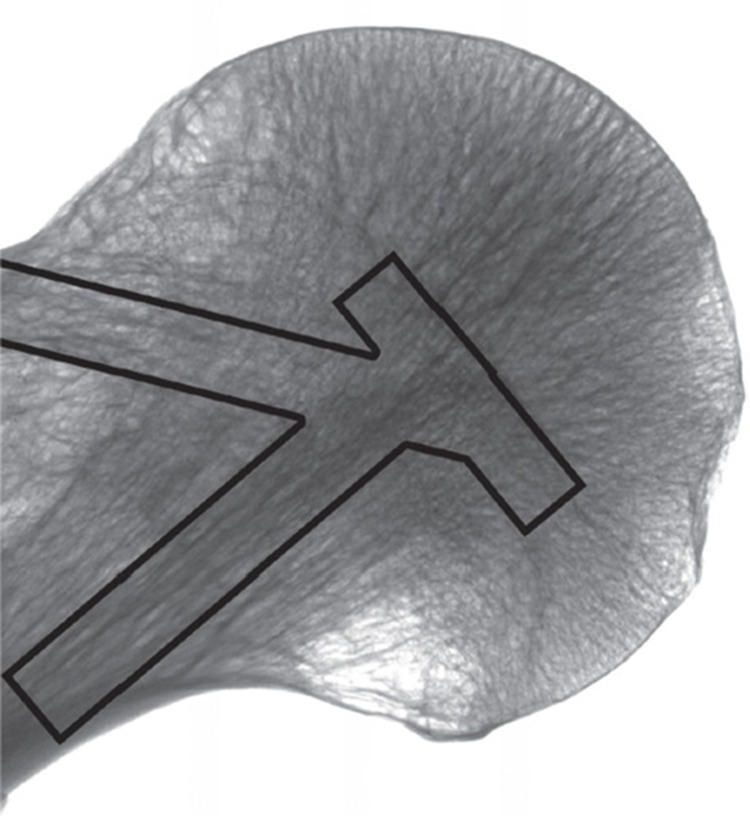
We postulate a model of femoral head structure whereby the strongest bone is located at the center of the femoral head. This area coincides with the intersection of the compressive trabecular groups from the medial calcar and greater trochanter, along with the area of physeal scar (Figure 8). Placement of the screw in this “middle/middle” area may ensure that the implant device gains fixation in this area. “Inferior/middle” placement may also achieve stable fixation superior to the implant. Using TAD alone may result in the acceptance of superiorly, anteriorly, or posteriorly placed implants, leading to a higher risk of failure. This risk may increase further in smaller femoral heads. The surgeon should consider the particular characteristics of the implant used and the area of the implant that achieves fixation. This study has shown that the subchondral bone at the apex of the femoral head is of low density and strength.
Figure 8.
Coronal reformat of microCT scan of a femoral head and neck. The columns represent the major trabecular groups and physeal scar.
The present study was limited by the small number of specimens. Despite this limitation, we have demonstrated statistically significant variation in strength and architecture in the femoral head. Future studies should examine age- and sex-related changes in the femoral head, in an in vivo setting. Advances in imaging techniques such as high-resolution peripheral quantititave computed tomography may allow this. We were also limited by not being able to test the femoral head cubes that were imaged mechanically. This limitation occurred due to the time taken for microCT scanning; a femoral head could take up to 6 hours to scan. During this time, changes in the hydration may have occurred, leading to variation in mechanical strength.
In summary, although the TAD is a useful and valid method in guiding placement, it may be incomplete and is not based on the underlying bone structure. We found that the bone is most dense with the best structural indices at the center of the femoral head, on the neck axis, and we therefore conclude that lag screws placed in this area will achieve optimum fixation.
Acknowledgments
PJ designed the experiments, conduced the scanning for experiment 1, conducted the statistical analysis, and co-wrote the manscript. RR conducted the scanning for experiment 1 and co-wrote the paper. PP and JG designed experiment 1 [authors: correct?] and performed the statistical analysis. RW, AM, and DP designed and performed experiment 2, analyzed data, and contributed to manuscript writing. JTP, CRH, and HRS supervised the experiments and edited the manuscripts.
This research was supported by a research grant from Stryker UK.
No competing interests declared.
Supplementary data
Table 3 and Figures 5 and 6 are available at Acta’s website (www.actaorthop.org), identification number 6125.
References
- Baumgaertner MR, Curtin SL, Lindskog DM, Keggi JM. 7. Vol. 77. 1995: The value of the tip-apex distance in predicting failure of fixation of peritrochanteric fractures of the hip. J Bone Joint Surg (Am) ; pp. 1058–64. [DOI] [PubMed] [Google Scholar]
- Bonamo JJ, Accettola AB. Treatment of intertrochanteric fractures with a sliding nail-plate . J Trauma. 1982;22(3):205–15. doi: 10.1097/00005373-198203000-00006. [DOI] [PubMed] [Google Scholar]
- Ciarelli TE, Fyhrie DP, Schaffler MB, Goldstein SA. Variations in three-dimensional cancellous bone architecture of the proximal femur in female hip fractures and in controls . J Bone Miner Res. 2000;15(1):32–40. doi: 10.1359/jbmr.2000.15.1.32. [DOI] [PubMed] [Google Scholar]
- Davis TR, Sher JL, Horsman A, Simpson M, Porter BB, Checketts RG. Intertrochanteric femoral fractures. Mechanical failure after internal fixation . J Bone Joint Surg (Br) 1990;72(1):26–31. doi: 10.1302/0301-620X.72B1.2298790. [DOI] [PubMed] [Google Scholar]
- De Bruijn K, den Hartog D, Tuinebreijer W, Roukema G. Reliability of predictors for screw cutout in intertrochanteric hip fractures . J Bone Joint Surg (Am) 2012;94(14):1266–72. doi: 10.2106/JBJS.K.00357. [DOI] [PubMed] [Google Scholar]
- Fajardo RJ, Muller R. Three-dimensional analysis of nonhuman primate trabecular architecture using micro-computed tomography . Am J Phys Anthropol. 2001;115(4):327–36. doi: 10.1002/ajpa.1089. [DOI] [PubMed] [Google Scholar]
- Gundle R, Gargan MF, Simpson AH. How to minimize failures of fixation of unstable intertrochanteric fractures . Injury. 1995;26(9):611–4. doi: 10.1016/0020-1383(95)00125-s. [DOI] [PubMed] [Google Scholar]
- Haynes RC, Poll RG, Miles AW, Weston RB. Failure of femoral head fixation: a cadaveric analysis of lag screw cut-out with the gamma locking nail and AO dynamic hip screw . Injury. 1997;28(5-6):337–41. doi: 10.1016/s0020-1383(97)00035-1. [DOI] [PubMed] [Google Scholar]
- Hildebrand T, Ruegsegger P. Quantification of bone microarchitecture with the structure model index . Comput Methods Biomech Biomed Engin. 1997;1(1):15–23. doi: 10.1080/01495739708936692. [DOI] [PubMed] [Google Scholar]
- Homminga J, McCreadie BR, Ciarelli TE, Weinans H, Goldstein SA, Huiskes R. Cancellous bone mechanical properties from normals and patients with hip fractures differ on the structure level, not on the bone hard tissue level . Bone. 2002;30(5):759–64. doi: 10.1016/s8756-3282(02)00693-2. [DOI] [PubMed] [Google Scholar]
- Hsueh KK, Fang CK, Chen CM, Su YP, Wu HF, Chiu FY. Risk factors in cutout of sliding hip screw in intertrochanteric fractures: an evaluation of 937 patients . Int Orthop. 2010;34(8):1273–6. doi: 10.1007/s00264-009-0866-2. [DOI] [PMC free article] [PubMed] [Google Scholar]
- Issever AS, Link TM, Kentenich M, Rogalla P, Schwieger K, Huber MB, et al. Trabecular bone structure analysis in the osteoporotic spine using a clinical in vivo setup for 64-slice MDCT imaging: comparison to microCT imaging and microFE modeling . J Bone Miner Res. 2009;24(9):1628–37. doi: 10.1359/jbmr.090311. [DOI] [PMC free article] [PubMed] [Google Scholar]
- Kyle RF, Gustilo RB, Premer RF. Analysis of six hundred and twenty-two intertrochanteric hip fractures . J Bone Joint Surg (Am) 1979;61(2):216–21. [PubMed] [Google Scholar]
- Laskin RS, Gruber MA, Zimmerman AJ. Intertrochanteric fractures of the hip in the elderly: a retrospective analysis of 236 cases . Clin Orthop. 1979;(141):188–95. [PubMed] [Google Scholar]
- Legrand E, Chappard D, Pascaretti C, Duquenne M, Krebs S, Rohmer V, et al. Trabecular bone microarchitecture, bone mineral density, and vertebral fractures in male osteoporosis . J Bone Miner Res. 2000;15(1):13–9. doi: 10.1359/jbmr.2000.15.1.13. [DOI] [PubMed] [Google Scholar]
- Mainds CC, Newman RJ. Implant failures in patients with proximal fractures of the femur treated with a sliding screw device . Injury. 1989;20(2):98–100. doi: 10.1016/0020-1383(89)90151-4. [DOI] [PubMed] [Google Scholar]
- Massoud EI. Fixation of subtrochanteric fractures : Does a technical optimization of the dynamic hip screw application improve the results? . Strategies Trauma Limb Reconstr. 2009;4(2):65–71. doi: 10.1007/s11751-009-0058-z. [DOI] [PMC free article] [PubMed] [Google Scholar]
- Parker MJ. Cutting-out of the dynamic hip screw related to its position . J Bone Joint Surg (Br) 1992;74(4):625. doi: 10.1302/0301-620X.74B4.1624529. [DOI] [PubMed] [Google Scholar]
- Parmar V, Kumar S, Aster A, Harper WH. Review of methods to quantify lag screw placement in hip fracture fixation . Acta Orthop Belg. 2005;71(3):260–3. [PubMed] [Google Scholar]
- Pervez H, Parker MJ, Vowler S. Prediction of fixation failure after sliding hip screw fixation . Injury. 2004;35(10):994–8. doi: 10.1016/j.injury.2003.10.028. [DOI] [PubMed] [Google Scholar]
- Rozental TD, Deschamps LN, Taylor A, Earp B, Zurakowski D, Day CS, et al. Premenopausal women with a distal radial fracture have deteriorated trabecular bone density and morphology compared with controls without a fracture . J Bone Joint Surg (Am) 2013;95(7):633–42. doi: 10.2106/JBJS.L.00588. [DOI] [PMC free article] [PubMed] [Google Scholar]
- Simpson AH, Varty K, Dodd CA. Sliding hip screws: modes of failure . Injury. 1989;20(4):227–31. doi: 10.1016/0020-1383(89)90120-4. [DOI] [PubMed] [Google Scholar]
- Singh M, Nagrath AR, Maini PS. Changes in trabecular pattern of the upper end of the femur as an index of osteoporosis . J Bone Joint Surg (Am) 1970;52(3):457–67. [PubMed] [Google Scholar]
- Skyscan CT-Analyser Version 1.10 - The user’s guide . 2010
- Tanck E, Bakker AD, Kregting S, Cornelissen B, Klein-Nulend J, Van Rietbergen B. Predictive value of femoral head heterogeneity for fracture risk . Bone. 2009;44(4):590–5. doi: 10.1016/j.bone.2008.12.022. [DOI] [PubMed] [Google Scholar]
Associated Data
This section collects any data citations, data availability statements, or supplementary materials included in this article.


