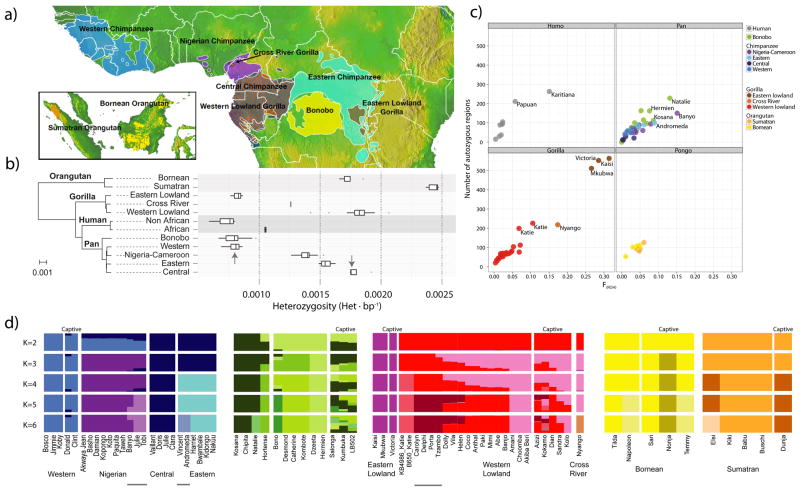
Figure 1. Samples, heterozygosity and genetic diversity.
a. Geographical distribution of great ape populations across Indonesia and Africa sequenced in this study. The formation of the islands of Borneo and Sumatra resulted in the speciation of the two corresponding orangutan populations. The Sanaga River forms a natural boundary between Nigeria-Cameroon and Central chimpanzee populations while the Congo River separates the bonobo population from the Central and Eastern chimpanzees. Eastern lowland and Western lowland gorillas are both separated by a large geographical distance. b. Heterozygosity estimates of each of the individual species and subspecies are superimposed onto a neighbor-joining tree from genome-wide genetic distance estimates. Arrows indicate heterozygosities previously reported30 for Western and Central chimpanzee populations c. Runs of homozygosity among great apes. The relationship between the coefficient of inbreeding (FROH) and the number of autozygous >1 Mbp segments is shown. Bonobos and Eastern lowland gorillas show an excess of inbreeding compared to the other great apes, suggesting small population sizes or a fragmented population. d. Genetic structure based on clustering of great apes. All individuals (columns) are grouped into different clusters (K=2 to K=6, rows) colored by species and according to their common genetic structure. Most captive individuals, labeled on top, show a complex admixture from different wild populations. A signature of admixture, for example, is clearly observed in the known hybrid Donald, a second-generation captive where we predict 15% admixture of Central chimpanzee on a Western background consistent with its pedigree. A gray line at the bottom denotes new groups at K=6 in agreement with the location of origin or ancestral admixture.

